
Recommended
More Related Content
What's hot
What's hot (20)
Viewers also liked
Viewers also liked (9)
Similar to Currency high lights 26.12.16
Similar to Currency high lights 26.12.16 (20)
Recently uploaded
Recently uploaded (20)
Currency high lights 26.12.16
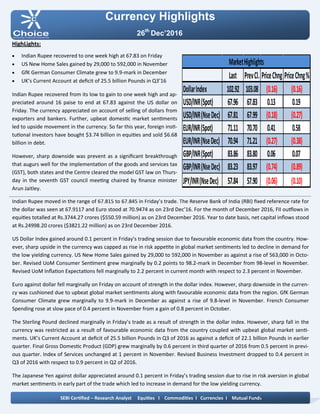
- 1. Currency Highlights 26th Dec’2016 HighLights: Indian Rupee recovered to one week high at 67.83 on Friday US New Home Sales gained by 29,000 to 592,000 in November GfK German Consumer Climate grew to 9.9-mark in December UK’s Current Account at deficit of 25.5 billion Pounds in Q3’16 Indian Rupee recovered from its low to gain to one week high and ap- preciated around 16 paise to end at 67.83 against the US dollar on Friday. The currency appreciated on account of selling of dollars from exporters and bankers. Further, upbeat domestic market sentiments led to upside movement in the currency. So far this year, foreign insti- tutional investors have bought $3.74 billion in equities and sold $6.68 billion in debt. However, sharp downside was prevent as a significant breakthrough that augurs well for the implementation of the goods and services tax (GST), both states and the Centre cleared the model GST law on Thurs- day in the seventh GST council meeting chaired by finance minister Arun Jaitley. Indian Rupee moved in the range of 67.815 to 67.845 in Friday’s trade. The Reserve Bank of India (RBI) fixed reference rate for the dollar was seen at 67.9117 and Euro stood at 70.9474 as on 23rd Dec’16. For the month of December 2016, FII outflows in equities totalled at Rs.3744.27 crores ($550.59 million) as on 23rd December 2016. Year to date basis, net capital inflows stood at Rs.24998.20 crores ($3821.22 million) as on 23rd December 2016. US Dollar Index gained around 0.1 percent in Friday’s trading session due to favourable economic data from the country. How- ever, sharp upside in the currency was capped as rise in risk appetite in global market sentiments led to decline in demand for the low yielding currency. US New Home Sales gained by 29,000 to 592,000 in November as against a rise of 563,000 in Octo- ber. Revised UoM Consumer Sentiment grew marginally by 0.2 points to 98.2-mark in December from 98-level in November. Revised UoM Inflation Expectations fell marginally to 2.2 percent in current month with respect to 2.3 percent in November. Euro against dollar fell marginally on Friday on account of strength in the dollar index. However, sharp downside in the curren- cy was cushioned due to upbeat global market sentiments along with favourable economic data from the region. GfK German Consumer Climate grew marginally to 9.9-mark in December as against a rise of 9.8-level in November. French Consumer Spending rose at slow pace of 0.4 percent in November from a gain of 0.8 percent in October. The Sterling Pound declined marginally in Friday’s trade as a result of strength in the dollar index. However, sharp fall in the currency was restricted as a result of favourable economic data from the country coupled with upbeat global market senti- ments. UK’s Current Account at deficit of 25.5 billion Pounds in Q3 of 2016 as against a deficit of 22.1 billion Pounds in earlier quarter. Final Gross Domestic Product (GDP) grew marginally by 0.6 percent in third quarter of 2016 from 0.5 percent in previ- ous quarter. Index of Services unchanged at 1 percent in November. Revised Business Investment dropped to 0.4 percent in Q3 of 2016 with respect to 0.9 percent in Q2 of 2016. The Japanese Yen against dollar appreciated around 0.1 percent in Friday’s trading session due to rise in risk aversion in global market sentiments in early part of the trade which led to increase in demand for the low yielding currency. SEBI Certified – Research Analyst Equities I Commodities I Currencies I Mutual Funds Last PrevCl. PriceChng PriceChng% DollarIndex 102.92 103.08 (0.16) (0.16) USD/INR(Spot) 67.96 67.83 0.13 0.19 USD/INR(NseDec) 67.81 67.99 (0.18) (0.27) EUR/INR(Spot) 71.11 70.70 0.41 0.58 EUR/INR(NseDec) 70.94 71.21 (0.27) (0.38) GBP/INR(Spot) 83.86 83.80 0.06 0.07 GBP/INR(NseDec) 83.23 83.97 (0.74) (0.89) JPY/INR(NseDec) 57.84 57.90 (0.06) (0.10) MarketHighlights
- 2. Technical View: On daily chart, it has been observed that the JPYINR has completed a Bullish Bat harmonic pattern at 57.55 levels the coordinates of which are as follows: Technical Parameter: XA of the leg from 56 to 67.90,AB of the leg completed at 63.30 (i.e.38.20% of XA leg.), BC of the leg completed at 67.50 (i.e. near 88.60% of AB leg) and CD of the leg completed at 57.55 level. (i.e. 88% of XA and 224% of BC leg). On daily chart momentum indicator RSI is trading in oversold zone which indicates up side momentum can be seen in the prices. In addition, momentum indicator MACD has shown posi- tive crossover which suggest possibilities of rebound in the prices on daily chart. So for trading perspective, one could JPYINR buy in the range of 57.70 with SL of 57.30 for target of 58.40 levels. Pivot levels for the Day Technical View: The pair has shown breakout of its horizontal channel at 67.50 levels on daily chart and price has retested its breakout trend line at 67.40 levels. On daily chart price has taken support of its 61.80% Fib- onacci retracement levels. Moreover, prices have been trading above its 50 DEMA which gives the sign of bullishness in the prices. A momentum indicator RSI has been trading above 40 levels, which suggest further positive momentum can be seen in the prices. In addition, momentum indicator MACD has shown positive crossover on hourly chart. So for trading perspective, one could buy USDINR in range 67.70 with SL of 67.40 for target of 68.30. Currency Highlights 26th Dec’2016 USDINR JPYINR SEBI Certified – Research Analyst Equities I Commodities I Currencies I Mutual Funds S3 S2 S1 Pivot R1 R2 R3 USDINR 67.47 67.65 67.73 67.83 67.91 68.01 68.19 JPYINR 57.57 57.71 57.77 57.85 57.91 57.99 58.13
- 3. Pivot levels for the Day Currency Highlights 26th Dec’2016 GBPINR EURINR Technical View: The price has taken support of its horizontal trend line at 70.60 levels on daily chart. The EURINR pair has also taken support of its falling trend line at 70.70 levels on daily chart. The pair has been trading above its 15 HEMA on hourly chart, which suggest further bullishness can be seen in the prices. On daily chart momentum oscillator RSI has moved up form its oversold zone, which suggest bullishness in the prices. A momentum indicator MACD has shown positive cross- over on 4 hourly chart, which support our bullish view to the prices. For now we can expect prices should move higher to- wards 71.60 levels in the coming trading session. Technical View: The price has shown breakdown of its rising channel pattern at 85 levels on daily chart. The pair has been facing resistance of its falling trend line at 86.10 levels on daily chart. The prices have been facing resistance of its horizontal line at 86 levels. Moreover, prices have been trading below 50 DEMA, which suggest short term trend looks negative. Moreover, momentum indicator MACD has given nega- tive cross over on daily chart, which gives the sign of bearishness in the prices. The momentum indictor RSI has been trading below 60 levels on daily chart, which suggest the possibilities of further weakness in the prices. For now we expect prices should move lower towards 82.40 levels coming trading sessions. SEBI Certified – Research Analyst Equities I Commodities I Currencies I Mutual Funds S3 S2 S1 Pivot R1 R2 R3 GBPINR 82.43 82.86 83.05 83.29 83.48 83.72 84.15 EURINR 70.58 70.76 70.85 70.94 71.03 71.12 71.30
- 4. Currency Highlights SEBI Certified – Research Analyst Equities I Commodities I Currencies I Mutual Funds 26th Dec’2016 Economic Indicators Date Time Data Prior Expected Impact 26.12.16 05:20 AM Monetary Policy Meeting Minutes More hawkish than expected = Good for currency; JPYINR 26.12.16 05:20 AM SPPI y/y 0.5% 0.5% Actual > Forecast = Good for currency; JPYINR
- 5. Currency Highlights 26th Dec’2016 SEBI Certified – Research Analyst Equities I Commodities I Currencies I Mutual Funds Anish Vyas Digitally signed by Anish Vyas DN: cn=Anish Vyas, o=Choice Merchandise Broking Pvt. Ltd, ou=Sr. Research Associate, email=anish.vyas@choiceindia.com, c=IN Date: 2016.12.26 09:04:14 +05'30'