
Recommended
More Related Content
What's hot
What's hot (20)
Viewers also liked
Viewers also liked (20)
Similar to Currency high lights 11.05.16
Similar to Currency high lights 11.05.16 (20)
Recently uploaded
Recently uploaded (20)
Currency high lights 11.05.16
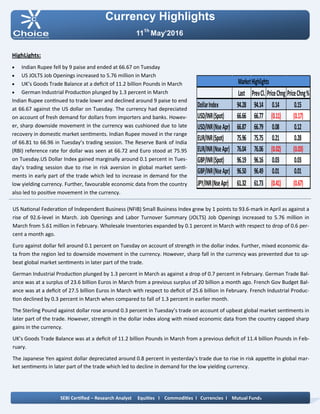
- 1. Currency Highlights 111h May’2016 HighLights: Indian Rupee fell by 9 paise and ended at 66.67 on Tuesday US JOLTS Job Openings increased to 5.76 million in March UK’s Goods Trade Balance at a deficit of 11.2 billion Pounds in March German Industrial Production plunged by 1.3 percent in March Indian Rupee continued to trade lower and declined around 9 paise to end at 66.67 against the US dollar on Tuesday. The currency had depreciated on account of fresh demand for dollars from importers and banks. Howev- er, sharp downside movement in the currency was cushioned due to late recovery in domestic market sentiments. Indian Rupee moved in the range of 66.81 to 66.96 in Tuesday’s trading session. The Reserve Bank of India (RBI) reference rate for dollar was seen at 66.72 and Euro stood at 75.95 on Tuesday.US Dollar Index gained marginally around 0.1 percent in Tues- day’s trading session due to rise in risk aversion in global market senti- ments in early part of the trade which led to increase in demand for the low yielding currency. Further, favourable economic data from the country also led to positive movement in the currency. US National Federation of Independent Business (NFIB) Small Business Index grew by 1 points to 93.6-mark in April as against a rise of 92.6-level in March. Job Openings and Labor Turnover Summary (JOLTS) Job Openings increased to 5.76 million in March from 5.61 million in February. Wholesale Inventories expanded by 0.1 percent in March with respect to drop of 0.6 per- cent a month ago. Euro against dollar fell around 0.1 percent on Tuesday on account of strength in the dollar index. Further, mixed economic da- ta from the region led to downside movement in the currency. However, sharp fall in the currency was prevented due to up- beat global market sentiments in later part of the trade. German Industrial Production plunged by 1.3 percent in March as against a drop of 0.7 percent in February. German Trade Bal- ance was at a surplus of 23.6 billion Euros in March from a previous surplus of 20 billion a month ago. French Gov Budget Bal- ance was at a deficit of 27.5 billion Euros in March with respect to deficit of 25.6 billion in February. French Industrial Produc- tion declined by 0.3 percent in March when compared to fall of 1.3 percent in earlier month. The Sterling Pound against dollar rose around 0.3 percent in Tuesday’s trade on account of upbeat global market sentiments in later part of the trade. However, strength in the dollar index along with mixed economic data from the country capped sharp gains in the currency. UK’s Goods Trade Balance was at a deficit of 11.2 billion Pounds in March from a previous deficit of 11.4 billion Pounds in Feb- ruary. The Japanese Yen against dollar depreciated around 0.8 percent in yesterday’s trade due to rise in risk appetite in global mar- ket sentiments in later part of the trade which led to decline in demand for the low yielding currency. SEBI Certified – Research Analyst Equities I Commodities I Currencies I Mutual Funds Last PrevCl. PriceChng PriceChng% DollarIndex 94.28 94.14 0.14 0.15 USD/INR(Spot) 66.66 66.77 (0.11) (0.17) USD/INR(NseApr) 66.87 66.79 0.08 0.12 EUR/INR(Spot) 75.96 75.75 0.21 0.28 EUR/INR(NseApr) 76.04 76.06 (0.02) (0.03) GBP/INR(Spot) 96.19 96.16 0.03 0.03 GBP/INR(NseApr) 96.50 96.49 0.01 0.01 JPY/INR(NseApr) 61.32 61.73 (0.41) (0.67) MarketHighlights
- 2. Technical View: The JPYINR price has been trading in rising wedge formation form past few weeks. Price has faced resistance of upper band of wedge pattern at 63 levels on daily chart. Prices have been facing resistance of falling trend line at 62.60 levels on hourly chart. The prices have been facing resistance of 161.80% Fibonacci projection at 63.10 levels which is known as golden ration. Moreover, Pair has been trading below its 60 hourly exponen- tial moving average which suggest short term trend remains down. On daily chart, momentum oscillator RSI has moved below 60 levels, which gives negative confirmation to the prices. A momentum indicator MACD has shown negative crossover on daily chart, which indicates short term trend remains nega- tive. Pivot levels for the Day Technical View: The price has formed shooting star candle stick on daily chart which is bearish pattern. Moreover, price has been moving in rectangle pattern and facing resistance at 67 levels on daily chart. Moreover, price have been trading below its 50 daily expo- nential moving average so any rally towards 66.90 level, which suggest near term trend remains weak. A momentum indicator RSI has been trading below 60 levels on hourly chart, which suggest bearishness in the prices. Momentum indictor MACD has shown negative signs and trading below single line on daily chart, which gives negative confirmation to the prices. For now we expect prices to move lower towards 66.60 lev- els in few trading sessions. Currency Highlights 11th May’2016 USDINR JPYINR SEBI Certified – Research Analyst Equities I Commodities I Currencies I Mutual Funds S3 S2 S1 Pivot R1 R2 R3 USDINR 66.56 66.72 66.80 66.88 66.96 67.04 67.20 JPYINR 60.51 60.94 61.13 61.37 61.56 61.80 62.23
- 3. Pivot levels for the Day Currency Highlights 11th May’2016 GBPINR EURINR Technical View: Price has been trading in symmetrical triangle pattern on dai- ly chart and facing resistance of its upper band at 76.90 lev- els. The pair has faced strong resistance of its falling trend line at 77 levels. The price has been trading in rising channel formation and facing resistance of upper band of channel pattern at 77.50 levels. Price has given breakdown its sym- metrical pattern at 76.60 levels on hourly chart. On the other hand, Pair has been trading below its 50 hourly exponential moving average which indicates that trend is remains down. A momentum oscillator RSI have been trading below 60 lev- els on daily chart which gives bearishness to the prices. Moreover, momentum indicator MACD has shown negative crossover on four hourly chart which support our bearish view on the pair. Technical View: The price has been tested of its falling channel pattern at 96 level on daily chart. Moreover, price has formed bullish ham- mer pattern on daily chart , which is followed by positive candle stick. On the other hand, Pair has been trading above its 21 hourly exponential moving average which indicates that short term trend is remains bullish. On daily chart, GBPINR has taken support of 61.80% Fibonac- ci retracement from its previous rally of 94 to 98 levels. A momentum oscillator RSI have been trading above 50 levels on daily chart which gives bullishness to the prices. Moreover, momentum indicator MACD has shown positive crossover on hourly chart which support our bullish view on the pair. SEBI Certified – Research Analyst Equities I Commodities I Currencies I Mutual Funds S3 S2 S1 Pivot R1 R2 R3 GBPINR 95.38 95.99 96.24 96.60 96.85 97.21 97.82 EURINR 75.52 75.81 75.95 76.10 76.24 76.39 76.68
- 4. Currency Highlights SEBI Certified – Research Analyst Equities I Commodities I Currencies I Mutual Funds Economic Indicators Date Time Data Prior Expected Impact 11.05.16 10:30am Leading Indicators 96.8% 96.4% Actual > Forecast = Good for currency; JPYINR 11.05.16 2:00pm Manufacturing Production m/m -1.1% 0.4% Actual > Forecast = Good for currency; GBPINR 11.05.16 2:00pm Industrial Production m/m -0.3% 0.7% Actual > Forecast = Good for currency; GBPINR 11.05.16 8:00pm Crude Oil Inventories -2.8M 11.05.16 11:30pm Federal Budget Balance -108B 116.20B Actual > Forecast = Good for currency; USDINR 11th May’2016
- 5. Currency Highlights 11th May’2016 SEBI Certified – Research Analyst Equities I Commodities I Currencies I Mutual Funds Amit Pathania Digitally signed by Amit Pathania DN: cn=Amit Pathania, o=Choice Equity Broking Pvt. ltd, ou=Research Department, email=amit.pathania@choiceindia.com, c=IN Date: 2016.05.11 08:32:31 +05'30'