
Recommended
More Related Content
What's hot
What's hot (20)
Similar to Currency high lights 29.08.16
Similar to Currency high lights 29.08.16 (20)
Recently uploaded
Recently uploaded (20)
Currency high lights 29.08.16
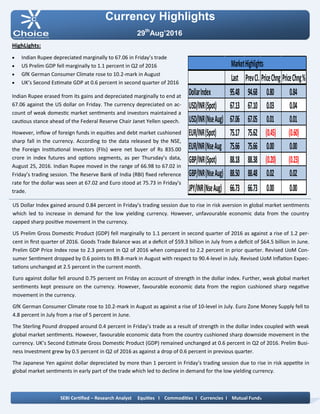
- 1. Currency Highlights 29th Aug’2016 HighLights: Indian Rupee depreciated marginally to 67.06 in Friday’s trade US Prelim GDP fell marginally to 1.1 percent in Q2 of 2016 GfK German Consumer Climate rose to 10.2-mark in August UK’s Second Estimate GDP at 0.6 percent in second quarter of 2016 Indian Rupee erased from its gains and depreciated marginally to end at 67.06 against the US dollar on Friday. The currency depreciated on ac- count of weak domestic market sentiments and investors maintained a cautious stance ahead of the Federal Reserve Chair Janet Yellen speech. However, inflow of foreign funds in equities and debt market cushioned sharp fall in the currency. According to the data released by the NSE, the Foreign Institutional Investors (FIIs) were net buyer of Rs 835.00 crore in index futures and options segments, as per Thursday’s data, August 25, 2016. Indian Rupee moved in the range of 66.98 to 67.02 in Friday’s trading session. The Reserve Bank of India (RBI) fixed reference rate for the dollar was seen at 67.02 and Euro stood at 75.73 in Friday’s trade. US Dollar Index gained around 0.84 percent in Friday’s trading session due to rise in risk aversion in global market sentiments which led to increase in demand for the low yielding currency. However, unfavourable economic data from the country capped sharp positive movement in the currency. US Prelim Gross Domestic Product (GDP) fell marginally to 1.1 percent in second quarter of 2016 as against a rise of 1.2 per- cent in first quarter of 2016. Goods Trade Balance was at a deficit of $59.3 billion in July from a deficit of $64.5 billion in June. Prelim GDP Price Index rose to 2.3 percent in Q2 of 2016 when compared to 2.2 percent in prior quarter. Revised UoM Con- sumer Sentiment dropped by 0.6 points to 89.8-mark in August with respect to 90.4-level in July. Revised UoM Inflation Expec- tations unchanged at 2.5 percent in the current month. Euro against dollar fell around 0.75 percent on Friday on account of strength in the dollar index. Further, weak global market sentiments kept pressure on the currency. However, favourable economic data from the region cushioned sharp negative movement in the currency. GfK German Consumer Climate rose to 10.2-mark in August as against a rise of 10-level in July. Euro Zone Money Supply fell to 4.8 percent in July from a rise of 5 percent in June. The Sterling Pound dropped around 0.4 percent in Friday’s trade as a result of strength in the dollar index coupled with weak global market sentiments. However, favourable economic data from the country cushioned sharp downside movement in the currency. UK’s Second Estimate Gross Domestic Product (GDP) remained unchanged at 0.6 percent in Q2 of 2016. Prelim Busi- ness Investment grew by 0.5 percent in Q2 of 2016 as against a drop of 0.6 percent in previous quarter. The Japanese Yen against dollar depreciated by more than 1 percent in Friday’s trading session due to rise in risk appetite in global market sentiments in early part of the trade which led to decline in demand for the low yielding currency. SEBI Certified – Research Analyst Equities I Commodities I Currencies I Mutual Funds Last PrevCl. PriceChng PriceChng% DollarIndex 95.48 94.68 0.80 0.84 USD/INR(Spot) 67.13 67.10 0.03 0.04 USD/INR(NseAug) 67.06 67.05 0.01 0.01 EUR/INR(Spot) 75.17 75.62 (0.45) (0.60) EUR/INR(NseAug 75.66 75.66 0.00 0.00 GBP/INR(Spot) 88.18 88.38 (0.20) (0.23) GBP/INR(NseAug) 88.50 88.48 0.02 0.02 JPY/INR(NseAug) 66.73 66.73 0.00 0.00 MarketHighlights
- 2. Technical View: The prices have been trading in falling channel pattern and prices have been facing resistance of upper band of channel pattern 67 levels on daily chart. The price has formed double top formation on daily chart. The pair has faced résistance of horizontal trend line at 67.05 levels on daily chart. Moreover, prices have been trading below its 21 HEMA on hourly chart, which indicates short term trend remains down. On daily chart, momentum oscillator RSI has faced resistance at 65 levels, which gives negative confirmation to the prices. A momentum indicator MACD has shown negative sign on daily hourly chart, which indicates further bearishness in the prices. For now we expect prices to move lower towards 66.20 levels in few trading sessions. Pivot levels for the Day Technical View: The price has given breakdown of its rising channel pattern at 67.20 levels and price has retested the lower trend line 67.17 levels on daily chart. On the other hand prices have been fac- ing resistance of horizontal trend line at 67.20 levels on daily chart. Moreover, price have been trading below its 21 daily expo- nential moving average which suggest short term trend is bearish. So any rally in the prices towards 67.20 level, used as selling opportunity. A momentum indicator RSI has remained below 60 levels on daily chart, which suggest bearishness in the prices. A momentum indictor MACD has given negative crossover on daily chart, which gives negative confirmation to the pric- es. For now we expect prices to move lower towards 66.80 lev- els in few trading sessions. Currency Highlights 29th Aug’2016 USDINR JPYINR SEBI Certified – Research Analyst Equities I Commodities I Currencies I Mutual Funds S3 S2 S1 Pivot R1 R2 R3 USDINR 66.84 66.94 67.00 67.04 67.10 67.14 67.24 JPYINR 66.46 66.58 66.65 66.70 66.77 66.82 66.94
- 3. Pivot levels for the Day Currency Highlights 29th Aug’2016 GBPINR EURINR Technical View: The prices have been trading in descending triangle pattern from past few weeks and prices has faced resistance of its upper band of triangle pattern at 76 levels on daily chart. On the other hand, Pair has been trading below its 21 hourly exponential moving average which indicates that trend is turned into bearish. A momentum oscillator RSI have been trading below 60 lev- els on daily chart which gives the signs of bearish to the pric- es. Moreover, momentum indicator MACD has shown negative sign on daily chart which support our bearish view on the pair. For now we expect prices should move lower towards 74.60 levels in the coming trading sessions. Technical View: The price has been trading in descending triangle formation from past weeks and prices have been facing resistance of its upper bad of triangle at 88.20 levels on daily chart. Any movement can be if prices shown breakout above falling tre nd line at 89 levels. The prices have been trading below its 50 DEMA, which sug- gest short term trend is down. A momentum indicator RSI has remained below 50 levels on daily chart, which suggest bearishness in the prices. Moreover, momentum indicator MACD has shown negative sign on daily chart which support our bearish view on the pair. For now we expect prices should move lower towards 87.80 levels in the coming trading sessions. SEBI Certified – Research Analyst Equities I Commodities I Currencies I Mutual Funds S3 S2 S1 Pivot R1 R2 R3 GBPINR 87.90 88.22 88.36 88.54 88.68 88.86 89.18 EURINR 75.31 75.49 75.57 75.67 75.75 75.85 76.03
- 4. Currency Highlights SEBI Certified – Research Analyst Equities I Commodities I Currencies I Mutual Funds Economic Indicators Date Time Data Prior Expected Impact 29.08.16 6:00PM Personal Spending m/m 0.4% 0.3% Actual > Forecast = Good for currency; USDINR 29.08.16 6:00PM Personal Income m/m 0.2% 0.4% Actual > Forecast = Good for currency; USDINR 29th Aug’2016
- 5. Currency Highlights 29th Aug’2016 SEBI Certified – Research Analyst Equities I Commodities I Currencies I Mutual Funds Amit Pathania Digitally signed by Amit Pathania DN: cn=Amit Pathania, o=Choice Equity Broking Pvt. ltd, ou=Research Department, email=amit.pathania@choiceindia.com, c=IN Date: 2016.08.27 14:58:14 +05'30'