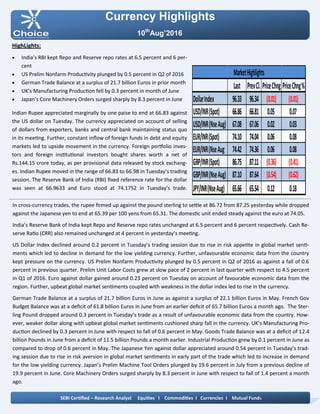
Currency Highlights
10th
Aug’2016
HighLights:
 India’s RBI kept Repo and Reserve repo rates at 6.5 percent and 6 per-
cent
 US Prelim Nonfarm Productivity plunged by 0.5 percent in Q2 of 2016
 German Trade Balance at a surplus of 21.7 billion Euros in prior month
 UK’s Manufacturing Production fell by 0.3 percent in month of June
 Japan’s Core Machinery Orders surged sharply by 8.3 percent in June
Indian Rupee appreciated marginally by one paise to end at 66.83 against
the US dollar on Tuesday. The currency appreciated on account of selling
of dollars from exporters, banks and central bank maintaining status quo
in its meeting. Further, constant inflow of foreign funds in debt and equity
markets led to upside movement in the currency. Foreign portfolio inves-
tors and foreign institutional investors bought shares worth a net of
Rs.144.15 crore today, as per provisional data released by stock exchang-
es. Indian Rupee moved in the range of 66.83 to 66.98 in Tuesday’s trading
session. The Reserve Bank of India (RBI) fixed reference rate for the dollar
was seen at 66.9633 and Euro stood at 74.1752 in Tuesday’s trade.
In cross-currency trades, the rupee firmed up against the pound sterling to settle at 86.72 from 87.25 yesterday while dropped
against the Japanese yen to end at 65.39 per 100 yens from 65.31. The domestic unit ended steady against the euro at 74.05.
India’s Reserve Bank of India kept Repo and Reserve repo rates unchanged at 6.5 percent and 6 percent respectively. Cash Re-
serve Ratio (CRR) also remained unchanged at 4 percent in yesterday’s meeting.
US Dollar Index declined around 0.2 percent in Tuesday’s trading session due to rise in risk appetite in global market senti-
ments which led to decline in demand for the low yielding currency. Further, unfavourable economic data from the country
kept pressure on the currency. US Prelim Nonfarm Productivity plunged by 0.5 percent in Q2 of 2016 as against a fall of 0.6
percent in previous quarter. Prelim Unit Labor Costs grew at slow pace of 2 percent in last quarter with respect to 4.5 percent
in Q1 of 2016. Euro against dollar gained around 0.23 percent on Tuesday on account of favourable economic data from the
region. Further, upbeat global market sentiments coupled with weakness in the dollar index led to rise in the currency.
German Trade Balance at a surplus of 21.7 billion Euros in June as against a surplus of 22.1 billion Euros in May. French Gov
Budget Balance was at a deficit of 61.8 billion Euros in June from an earlier deficit of 65.7 billion Euros a month ago. The Ster-
ling Pound dropped around 0.3 percent in Tuesday’s trade as a result of unfavourable economic data from the country. How-
ever, weaker dollar along with upbeat global market sentiments cushioned sharp fall in the currency. UK’s Manufacturing Pro-
duction declined by 0.3 percent in June with respect to fall of 0.6 percent in May. Goods Trade Balance was at a deficit of 12.4
billion Pounds in June from a deficit of 11.5 billion Pounds a month earlier. Industrial Production grew by 0.1 percent in June as
compared to drop of 0.6 percent in May. The Japanese Yen against dollar appreciated around 0.54 percent in Tuesday’s trad-
ing session due to rise in risk aversion in global market sentiments in early part of the trade which led to increase in demand
for the low yielding currency. Japan’s Prelim Machine Tool Orders plunged by 19.6 percent in July from a previous decline of
19.9 percent in June. Core Machinery Orders surged sharply by 8.3 percent in June with respect to fall of 1.4 percent a month
ago.
SEBI Certified – Research Analyst Equities I Commodities I Currencies I Mutual Funds
Last PrevCl. PriceChng PriceChng%
DollarIndex 96.33 96.34 (0.01) (0.01)
USD/INR(Spot) 66.86 66.81 0.05 0.07
USD/INR(NseAug) 67.08 67.06 0.02 0.03
EUR/INR(Spot) 74.10 74.04 0.06 0.08
EUR/INR(NseAug 74.42 74.36 0.06 0.08
GBP/INR(Spot) 86.75 87.11 (0.36) (0.41)
GBP/INR(NseAug) 87.10 87.64 (0.54) (0.62)
JPY/INR(NseAug) 65.66 65.54 0.12 0.18
MarketHighlights
Technical View:
The price has taken support of its rising trend line at 64.50
levels on daily chart. The pair has been trading in rising chan-
nel pattern and price has taken support of its lower band of
channel pattern at 63.40 levels on daily chart. Price has
formed bullish inverted hammer candle stick pattern with ap-
pealing volumes which is bullish reversal pattern. However,
prices have been facing resistance of 66.40 levels on daily
chart. Any major movement can been seen after breakout of
falling trend line at 66.50 levels.
In addition, on daily chart prices have been trading above its
21 daily exponential moving average which gives the bullish
confirmation to the prices.
On daily chart, momentum oscillator RSI has moved above
60 levels, which gives positive confirmation to the prices.
A momentum indicator MACD has shown positive crossover
on daily chart, which indicates further bullishness in the pric-
es.
Pivot levels for the Day
Technical View:
The price has given breakdown of rising channel pattern at
67.10 levels on daily chart. On the other hand prices have
been facing resistance of its horizontal trend line at 67.20
levels on daily chart.
Moreover, price have been trading below its 21 daily expo-
nential moving average which suggest short term trend is
bearish. So any rally in the prices towards 67.07 level, used
as selling opportunity.
A momentum indicator RSI has moved below 45 levels on
daily chart, which suggest bearishness in the prices.
A momentum indictor MACD has given negative crossover
on daily chart, which gives negative confirmation to the pric-
es.
For now we expect prices to move lower towards 66.60 lev-
els in few trading sessions.
Currency Highlights
10th
Aug’2016
USDINR JPYINR
SEBI Certified – Research Analyst Equities I Commodities I Currencies I Mutual Funds
S3 S2 S1 Pivot R1 R2 R3
USDINR 66.80 66.95 67.02 67.10 67.17 67.25 67.40
JPYINR 65.17 65.39 65.53 65.61 65.75 65.83 66.05
Pivot levels for the Day
Currency Highlights
10th
Aug’2016
GBPINR EURINR
Technical View:
The prices have been trading in descending triangle pattern
from past few weeks and prices has faced resistance of its
upper band of triangle pattern at 77 levels on daily chart.
On the other hand, Pair has been trading below its 21 daily
exponential moving average which indicates that trend is
remains down.
A momentum oscillator RSI have been trading below 50 lev-
els on daily chart which gives the signs of bullishness to the
prices.
Moreover, momentum indicator MACD has shown negative
sign on daily chart which support our bearish view on the
pair.
For now we expect prices should move lower towards 73.85
levels in the coming trading sessions.
Technical View:
The price has given breakdown of its symmetrical triangle
pattern at 88.50 levels on daily chart. Price has also given
the breakdown of its consolidation range of 89.50 to
88.50levels on hourly chart.
The price has formed Bearish candle on daily with appalling
volumes which indicates further down side movement can
be seen.
A momentum indicator RSI has moved below at 45 levels
on hourly chart, which suggest bearishness in the prices.
Moreover, momentum indicator MACD has shown negative
crossover on 4 hourly chart which support our bearish view
on the pair.
For now we expect prices should move lower towards 86.40
levels in the coming trading sessions.
SEBI Certified – Research Analyst Equities I Commodities I Currencies I Mutual Funds
S3 S2 S1 Pivot R1 R2 R3
GBPINR 86.52 86.84 86.96 87.16 87.28 87.48 87.80
EURINR 73.53 73.94 74.18 74.35 74.59 74.76 75.17
Currency Highlights
SEBI Certified – Research Analyst Equities I Commodities I Currencies I Mutual Funds
Economic Indicators
Date Time Data Prior Expected Impact
10.08.16 5:20AM Core Machinery Orders m/m -1.4% 3.4% Actual > Forecast = Good for
currency; JPYINR
10.08.16 5:20AM PPI y/y -4.2% -4.0% Actual > Forecast = Good for
currency; JPYINR
10.08.16 12:15PM French Industrial Production m/
m
-0.5% 0.3% Actual > Forecast = Good for
currency; EURINR
10.08.16 7:30PM JOLTS Job Openings 5.50M 5.52M Actual > Forecast = Good for
currency; USDINR
10.08.16 8:00PM Crude Oil Inventories 1.4M
10.08.16 11:30 PM Federal Budget Balance 6.3B -129.9M Actual > Forecast = Good for
currency; USDINR
10th
Aug’2016
Currency Highlights
10th
Aug’2016
SEBI Certified – Research Analyst Equities I Commodities I Currencies I Mutual Funds
Amit Pathania
Digitally signed by Amit Pathania
DN: cn=Amit Pathania, o=Choice Equity Broking Pvt. ltd, ou=Research
Department, email=amit.pathania@choiceindia.com, c=IN
Date: 2016.08.10 08:36:00 +05'30'

Currency high lights 10.08.16

  • 1.
    Currency Highlights 10th Aug’2016 HighLights:  India’sRBI kept Repo and Reserve repo rates at 6.5 percent and 6 per- cent  US Prelim Nonfarm Productivity plunged by 0.5 percent in Q2 of 2016  German Trade Balance at a surplus of 21.7 billion Euros in prior month  UK’s Manufacturing Production fell by 0.3 percent in month of June  Japan’s Core Machinery Orders surged sharply by 8.3 percent in June Indian Rupee appreciated marginally by one paise to end at 66.83 against the US dollar on Tuesday. The currency appreciated on account of selling of dollars from exporters, banks and central bank maintaining status quo in its meeting. Further, constant inflow of foreign funds in debt and equity markets led to upside movement in the currency. Foreign portfolio inves- tors and foreign institutional investors bought shares worth a net of Rs.144.15 crore today, as per provisional data released by stock exchang- es. Indian Rupee moved in the range of 66.83 to 66.98 in Tuesday’s trading session. The Reserve Bank of India (RBI) fixed reference rate for the dollar was seen at 66.9633 and Euro stood at 74.1752 in Tuesday’s trade. In cross-currency trades, the rupee firmed up against the pound sterling to settle at 86.72 from 87.25 yesterday while dropped against the Japanese yen to end at 65.39 per 100 yens from 65.31. The domestic unit ended steady against the euro at 74.05. India’s Reserve Bank of India kept Repo and Reserve repo rates unchanged at 6.5 percent and 6 percent respectively. Cash Re- serve Ratio (CRR) also remained unchanged at 4 percent in yesterday’s meeting. US Dollar Index declined around 0.2 percent in Tuesday’s trading session due to rise in risk appetite in global market senti- ments which led to decline in demand for the low yielding currency. Further, unfavourable economic data from the country kept pressure on the currency. US Prelim Nonfarm Productivity plunged by 0.5 percent in Q2 of 2016 as against a fall of 0.6 percent in previous quarter. Prelim Unit Labor Costs grew at slow pace of 2 percent in last quarter with respect to 4.5 percent in Q1 of 2016. Euro against dollar gained around 0.23 percent on Tuesday on account of favourable economic data from the region. Further, upbeat global market sentiments coupled with weakness in the dollar index led to rise in the currency. German Trade Balance at a surplus of 21.7 billion Euros in June as against a surplus of 22.1 billion Euros in May. French Gov Budget Balance was at a deficit of 61.8 billion Euros in June from an earlier deficit of 65.7 billion Euros a month ago. The Ster- ling Pound dropped around 0.3 percent in Tuesday’s trade as a result of unfavourable economic data from the country. How- ever, weaker dollar along with upbeat global market sentiments cushioned sharp fall in the currency. UK’s Manufacturing Pro- duction declined by 0.3 percent in June with respect to fall of 0.6 percent in May. Goods Trade Balance was at a deficit of 12.4 billion Pounds in June from a deficit of 11.5 billion Pounds a month earlier. Industrial Production grew by 0.1 percent in June as compared to drop of 0.6 percent in May. The Japanese Yen against dollar appreciated around 0.54 percent in Tuesday’s trad- ing session due to rise in risk aversion in global market sentiments in early part of the trade which led to increase in demand for the low yielding currency. Japan’s Prelim Machine Tool Orders plunged by 19.6 percent in July from a previous decline of 19.9 percent in June. Core Machinery Orders surged sharply by 8.3 percent in June with respect to fall of 1.4 percent a month ago. SEBI Certified – Research Analyst Equities I Commodities I Currencies I Mutual Funds Last PrevCl. PriceChng PriceChng% DollarIndex 96.33 96.34 (0.01) (0.01) USD/INR(Spot) 66.86 66.81 0.05 0.07 USD/INR(NseAug) 67.08 67.06 0.02 0.03 EUR/INR(Spot) 74.10 74.04 0.06 0.08 EUR/INR(NseAug 74.42 74.36 0.06 0.08 GBP/INR(Spot) 86.75 87.11 (0.36) (0.41) GBP/INR(NseAug) 87.10 87.64 (0.54) (0.62) JPY/INR(NseAug) 65.66 65.54 0.12 0.18 MarketHighlights
  • 2.
    Technical View: The pricehas taken support of its rising trend line at 64.50 levels on daily chart. The pair has been trading in rising chan- nel pattern and price has taken support of its lower band of channel pattern at 63.40 levels on daily chart. Price has formed bullish inverted hammer candle stick pattern with ap- pealing volumes which is bullish reversal pattern. However, prices have been facing resistance of 66.40 levels on daily chart. Any major movement can been seen after breakout of falling trend line at 66.50 levels. In addition, on daily chart prices have been trading above its 21 daily exponential moving average which gives the bullish confirmation to the prices. On daily chart, momentum oscillator RSI has moved above 60 levels, which gives positive confirmation to the prices. A momentum indicator MACD has shown positive crossover on daily chart, which indicates further bullishness in the pric- es. Pivot levels for the Day Technical View: The price has given breakdown of rising channel pattern at 67.10 levels on daily chart. On the other hand prices have been facing resistance of its horizontal trend line at 67.20 levels on daily chart. Moreover, price have been trading below its 21 daily expo- nential moving average which suggest short term trend is bearish. So any rally in the prices towards 67.07 level, used as selling opportunity. A momentum indicator RSI has moved below 45 levels on daily chart, which suggest bearishness in the prices. A momentum indictor MACD has given negative crossover on daily chart, which gives negative confirmation to the pric- es. For now we expect prices to move lower towards 66.60 lev- els in few trading sessions. Currency Highlights 10th Aug’2016 USDINR JPYINR SEBI Certified – Research Analyst Equities I Commodities I Currencies I Mutual Funds S3 S2 S1 Pivot R1 R2 R3 USDINR 66.80 66.95 67.02 67.10 67.17 67.25 67.40 JPYINR 65.17 65.39 65.53 65.61 65.75 65.83 66.05
  • 3.
    Pivot levels forthe Day Currency Highlights 10th Aug’2016 GBPINR EURINR Technical View: The prices have been trading in descending triangle pattern from past few weeks and prices has faced resistance of its upper band of triangle pattern at 77 levels on daily chart. On the other hand, Pair has been trading below its 21 daily exponential moving average which indicates that trend is remains down. A momentum oscillator RSI have been trading below 50 lev- els on daily chart which gives the signs of bullishness to the prices. Moreover, momentum indicator MACD has shown negative sign on daily chart which support our bearish view on the pair. For now we expect prices should move lower towards 73.85 levels in the coming trading sessions. Technical View: The price has given breakdown of its symmetrical triangle pattern at 88.50 levels on daily chart. Price has also given the breakdown of its consolidation range of 89.50 to 88.50levels on hourly chart. The price has formed Bearish candle on daily with appalling volumes which indicates further down side movement can be seen. A momentum indicator RSI has moved below at 45 levels on hourly chart, which suggest bearishness in the prices. Moreover, momentum indicator MACD has shown negative crossover on 4 hourly chart which support our bearish view on the pair. For now we expect prices should move lower towards 86.40 levels in the coming trading sessions. SEBI Certified – Research Analyst Equities I Commodities I Currencies I Mutual Funds S3 S2 S1 Pivot R1 R2 R3 GBPINR 86.52 86.84 86.96 87.16 87.28 87.48 87.80 EURINR 73.53 73.94 74.18 74.35 74.59 74.76 75.17
  • 4.
    Currency Highlights SEBI Certified– Research Analyst Equities I Commodities I Currencies I Mutual Funds Economic Indicators Date Time Data Prior Expected Impact 10.08.16 5:20AM Core Machinery Orders m/m -1.4% 3.4% Actual > Forecast = Good for currency; JPYINR 10.08.16 5:20AM PPI y/y -4.2% -4.0% Actual > Forecast = Good for currency; JPYINR 10.08.16 12:15PM French Industrial Production m/ m -0.5% 0.3% Actual > Forecast = Good for currency; EURINR 10.08.16 7:30PM JOLTS Job Openings 5.50M 5.52M Actual > Forecast = Good for currency; USDINR 10.08.16 8:00PM Crude Oil Inventories 1.4M 10.08.16 11:30 PM Federal Budget Balance 6.3B -129.9M Actual > Forecast = Good for currency; USDINR 10th Aug’2016
  • 5.
    Currency Highlights 10th Aug’2016 SEBI Certified– Research Analyst Equities I Commodities I Currencies I Mutual Funds Amit Pathania Digitally signed by Amit Pathania DN: cn=Amit Pathania, o=Choice Equity Broking Pvt. ltd, ou=Research Department, email=amit.pathania@choiceindia.com, c=IN Date: 2016.08.10 08:36:00 +05'30'