
Recommended
More Related Content
What's hot
What's hot (20)
Similar to Currency high lights 05.08.16
Similar to Currency high lights 05.08.16 (16)
Recently uploaded
Recently uploaded (20)
Currency high lights 05.08.16
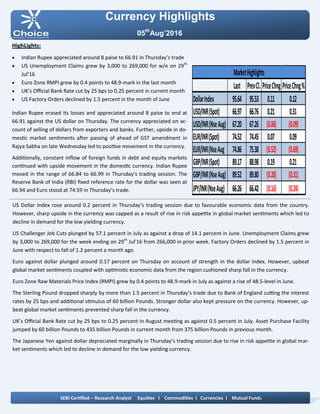
- 1. Currency Highlights 05th Aug’2016 HighLights: Indian Rupee appreciated around 8 paise to 66.91 in Thursday’s trade US Unemployment Claims grew by 3,000 to 269,000 for w/e on 29th Jul’16 Euro Zone RMPI grew by 0.4 points to 48.9-mark in the last month UK’s Official Bank Rate cut by 25 bps to 0.25 percent in current month US Factory Orders declined by 1.5 percent in the month of June Indian Rupee erased its losses and appreciated around 8 paise to end at 66.91 against the US dollar on Thursday. The currency appreciated on ac- count of selling of dollars from exporters and banks. Further, upside in do- mestic market sentiments after passing of ahead of GST amendment in Rajya Sabha on late Wednesday led to positive movement in the currency. Additionally, constant inflow of foreign funds in debt and equity markets continued with upside movement in the domestic currency. Indian Rupee moved in the range of 66.84 to 66.99 in Thursday’s trading session. The Reserve Bank of India (RBI) fixed reference rate for the dollar was seen at 66.94 and Euro stood at 74.59 in Thursday’s trade. US Dollar Index rose around 0.2 percent in Thursday’s trading session due to favourable economic data from the country. However, sharp upside in the currency was capped as a result of rise in risk appetite in global market sentiments which led to decline in demand for the low yielding currency. US Challenger Job Cuts plunged by 57.1 percent in July as against a drop of 14.1 percent in June. Unemployment Claims grew by 3,000 to 269,000 for the week ending on 29th Jul’16 from 266,000 in prior week. Factory Orders declined by 1.5 percent in June with respect to fall of 1.2 percent a month ago. Euro against dollar plunged around 0.17 percent on Thursday on account of strength in the dollar index. However, upbeat global market sentiments coupled with optimistic economic data from the region cushioned sharp fall in the currency. Euro Zone Raw Materials Price Index (RMPI) grew by 0.4 points to 48.9-mark in July as against a rise of 48.5-level in June. The Sterling Pound dropped sharply by more than 1.5 percent in Thursday’s trade due to Bank of England cutting the interest rates by 25 bps and additional stimulus of 60 billion Pounds. Stronger dollar also kept pressure on the currency. However, up- beat global market sentiments prevented sharp fall in the currency. UK’s Official Bank Rate cut by 25 bps to 0.25 percent in August meeting as against 0.5 percent in July. Asset Purchase Facility jumped by 60 billion Pounds to 435 billion Pounds in current month from 375 billion Pounds in previous month. The Japanese Yen against dollar depreciated marginally in Thursday’s trading session due to rise in risk appetite in global mar- ket sentiments which led to decline in demand for the low yielding currency. SEBI Certified – Research Analyst Equities I Commodities I Currencies I Mutual Funds Last PrevCl. PriceChng PriceChng% DollarIndex 95.64 95.53 0.11 0.12 USD/INR(Spot) 66.97 66.76 0.21 0.31 USD/INR(NseAug) 67.20 67.26 (0.06) (0.09) EUR/INR(Spot) 74.52 74.45 0.07 0.09 EUR/INR(NseAug 74.86 75.38 (0.52) (0.69) GBP/INR(Spot) 89.17 88.98 0.19 0.21 GBP/INR(NseAug) 89.52 89.80 (0.28) (0.31) JPY/INR(NseAug) 66.26 66.42 (0.16) (0.24) MarketHighlights
- 2. Technical View: The price has taken support of its rising trend line at 64.50 levels on daily chart. The pair has been trading in rising chan- nel pattern and price has taken support of its lower band of channel pattern at 63.40 levels on daily chart. Price has formed bullish inverted hammer candle stick pattern with ap- pealing volumes which is bullish reversal pattern. In addition, on daily chart prices have been trading above its 21 daily exponential moving average which gives the bullish confirmation to the prices. On daily chart, momentum oscillator RSI has moved above 50 levels, which gives positive confirmation to the prices. A momentum indicator MACD has shown positive crossover on daily chart, which indicates further bullishness in the pric- es. For now we expect prices to move higher towards 66.80 lev- els in few trading sessions. Pivot levels for the Day Technical View: The prices have been taking support of its rising trading line at 66.90 levels on daily chart. On the other hand prices have been taking support of at horizontal trend line at 67 levels on daily chart. Moreover, price have been trading above its 200 daily expo- nential moving average which suggest medium term trend is bullish. So any dips in the prices towards 67.10 level, used as buying opportunity. A momentum indicator RSI has moved above 45 levels on daily chart, which suggest bullishness in the prices. A momentum indictor MACD has given positive crossover on daily chart, which gives positive confirmation to the prices. For now we expect prices to move higher towards 67.60 lev- els in few trading sessions. Currency Highlights 05th Aug’2016 USDINR JPYINR SEBI Certified – Research Analyst Equities I Commodities I Currencies I Mutual Funds S3 S2 S1 Pivot R1 R2 R3 USDINR 66.80 66.98 67.09 67.16 67.27 67.34 67.52 JPYINR 65.59 65.91 66.09 66.23 66.41 66.55 66.87
- 3. Pivot levels for the Day Currency Highlights 05th Aug’2016 GBPINR EURINR Technical View: The prices have been trading in ascending triangle pattern from past few weeks and prices has taken support of its low- er band of triangle pattern at 74 levels in daily chart. On the other hand, Pair has been trading above its 200 daily exponential moving average which indicates that trend is remains up. A momentum oscillator RSI have been trading above 50 lev- els on daily chart which gives the signs of bullishness to the prices. Moreover, momentum indicator MACD has shown positive crossover on daily chart which support our bullish view on the pair. For now we expect prices should move higher towards 75.60 levels in the coming trading sessions. Technical View: The price has given breakout of its falling trend line at 89 levels on daily chart. Price has also given the breakout of its symmetrical pattern on hourly chart. The price has formed Bullish candle on daily with appalling volumes which indicates further up side movement can be seen. A momentum indicator RSI has moved above at 45 levels on hourly chart, which suggest bullishness in the prices. Moreover, momentum indicator MACD has shown positive crossover on 4 hourly chart which support our bullish view on the pair. For now we expect prices should move higher towards 90.20 levels in the coming trading sessions. SEBI Certified – Research Analyst Equities I Commodities I Currencies I Mutual Funds S3 S2 S1 Pivot R1 R2 R3 GBPINR 88.58 89.02 89.26 89.46 89.70 89.90 90.34 EURINR 73.51 74.29 74.58 75.07 75.36 75.85 76.63
- 4. Currency Highlights SEBI Certified – Research Analyst Equities I Commodities I Currencies I Mutual Funds Economic Indicators Date Time Data Prior Expected Impact 05.08.16 11:30AM German Factory Orders m/m 0.0% 0.5% Actual > Forecast = Good for currency; EURINR 05.08.16 1:00PM Halifax HPI m/m 1.3% -0.1% Actual > Forecast = Good for currency; GBPINR 05.08.16 6:00PM Average Hourly Earnings m/m 0.1% 0.2% Actual > Forecast = Good for currency; USDINR 05.08.16 6:00PM Non-Farm Employment Change 287K 180K Actual > Forecast = Good for currency; USDINR 05.08.16 6:00PM Unemployment Rate 4.9% 4.8% Actual > Forecast = Good for currency; USDINR 05th Aug’2016
- 5. Currency Highlights 05th Aug’2016 SEBI Certified – Research Analyst Equities I Commodities I Currencies I Mutual Funds Amit Pathania Digitally signed by Amit Pathania DN: cn=Amit Pathania, o=Choice Equity Broking Pvt. ltd, ou=Research Department, email=amit.pathania@choiceindia.com, c=IN Date: 2016.08.05 08:55:57 +05'30'