Booking open Available Pune Call Girls Wadgaon Sheri 6297143586 Call Hot Ind...
Currency high lights 18.05.16
1. Currency Highlights
18th
May’2016
HighLights:
US Core CPI expanded to 0.2 percent in the last month
UK’s Consumer Price Index (CPI) dropped to 0.3 percent in April
Euro Zone Trade Balance at a surplus of 22.3 billion Euros in March
US Building Permits increased to 1.12 million in the month of April
Japan’s Prelim Gross Domestic Product (GDP) rose by 0.4 percent in
Q1 of 2016
Indian Rupee continued to be under pressure and closed at two month
low at 66.88 against the US dollar on Tuesday. The currency had depreciat-
ed on account of fresh dollar demand from oil importers and banks. Addi-
tionally, concerns over slow inflow of the foreign capital led to negative
movement in the currency.
However, recovery in the domestic markets in later part of the trade cush-
ioned sharp fall in the currency. Indian Rupee moved in the range of 66.74
to 66.88 in Tuesday’s trading session.
US Dollar Index gained marginally in Tuesday’s trading session due to rise in risk aversion in global market sentiments which
led to increase in demand for the low yielding currency. Further, favourable economic data from the country led to positive
movement in the currency.
US Building Permits increased to 1.12 million in April as against a rise of 1.08 million in March. Consumer Price Index (CPI) rose
to 0.4 percent in last month from a previous gain of 0.1 percent in March. Core CPI expanded to 0.2 percent in April as com-
pared to 0.1 percent a month ago. Housing Starts increased to 1.17 million in April with respect to 1.10 million in March. Ca-
pacity Utilization Rate jumped to 75.4 percent in previous month when compared to 74.9 percent in March. Industrial Produc-
tion gained by 0.7 percent in April from a decline of 0.9 percent in March.
Euro against dollar plunged marginally on Tuesday on account of weak global market sentiments in later part of the trade cou-
pled with strength in the dollar index. However, sharp downside in the currency was cushioned due to favourable economic
data from the country.
Italian Trade Balance was at a surplus of 5.37 billion Euros in March as against a surplus of 3.86 billion Euros in February. Euro
Zone Trade Balance at a surplus of 22.3 billion Euros in March with respect to surplus of 20.6 billion Euros in prior month. The
Sterling Pound against dollar gained around 0.4 percent in Tuesday’s trade on account of favourable economic data from the
country. However, fall in the global market sentiments in later part of the trade along with strength in the dollar index capped
sharp gains in the currency.
UK’s Consumer Price Index (CPI) dropped to 0.3 percent in April as against a rise of 0.5 percent in March. Producer Price Index
(PPI) Input fell to 0.9 percent in last month from 2.2 percent in March. Retail Price Index (RPI) declined to 1.3 percent in April
with respect to 1.6 percent in March. Core CPI plunged to 1.2 percent in April as compared to 1.5 percent a month ago.
SEBI Certified – Research Analyst Equities I Commodities I Currencies I Mutual Funds
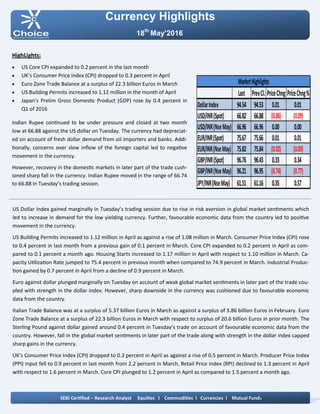
Last PrevCl. PriceChng PriceChng%
DollarIndex 94.54 94.53 0.01 0.01
USD/INR(Spot) 66.82 66.88 (0.06) (0.09)
USD/INR(NseMay) 66.96 66.96 0.00 0.00
EUR/INR(Spot) 75.67 75.66 0.01 0.01
EUR/INR(NseMay) 75.82 75.84 (0.02) (0.03)
GBP/INR(Spot) 96.76 96.43 0.33 0.34
GBP/INR(NseMay) 96.21 96.95 (0.74) (0.77)
JPY/INR(NseMay) 61.51 61.16 0.35 0.57
MarketHighlights
2. Technical View:
The JPYINR price has been taking support of rising trend line
at 61 levels on hourly chart. Prices have been taking support
of 50% Fibonacci retracement levels form its previous rally of
58 to 63 levels.
Moreover, Pair has been trading above its 21 hourly exponen-
tial moving average which suggest short term trend remains
up.
On hourly chart, momentum oscillator RSI has moved above
its 30 levels, which gives positive confirmation to the prices.
A momentum indicator MACD has shown positive crossover
on hourly chart, which indicates short term trend remains
Bullish.
Pivot levels for the Day
Technical View:
The price has been moving in rising channel pattern form
past few weeks and taking support of lower band of channel
pattern at 66.80 levels on hourly chart.
Moreover, price have been trading above its 21 hourly expo-
nential moving average which suggest near term trend re-
mains positive. So any dips in the prices lower towards 66.80
level, used as buying opportunity.
A momentum indicator RSI has been taking support at 45
levels on hourly chart, which suggest bullishness in the prices.
Momentum indictor MACD has shown positive crossover and
trading above single line on hourly chart, which gives posi-
tive confirmation to the prices.
For now we expect prices to move higher towards 67.40 lev-
els in few trading sessions.
Currency Highlights
18th
May’2016
USDINR JPYINR
SEBI Certified – Research Analyst Equities I Commodities I Currencies I Mutual Funds
S3 S2 S1 Pivot R1 R2 R3
USDINR 66.57 66.74 66.85 66.91 67.02 67.08 67.25
JPYINR 60.42 60.81 60.99 61.21 61.38 61.60 62.00
3. Pivot levels for the Day
Currency Highlights
18th
May’2016
GBPINR EURINR
Technical View:
The pair has given breakdown of its rising trend line at 75.80
levels. Price has given breakdown of its symmetrical triangle
pattern on 4 hourly chart at 76 levels. On the other hand,
Pair has been trading below its 50 hourly exponential moving
average which indicates that trend is remains weak.
A momentum oscillator RSI have been trading below 60 lev-
els on 4 hourly chart which gives bearishness to the prices.
Moreover, momentum indicator MACD has shown negative
crossover on four hourly chart which support our bearish
view on the pair.
For now we expect prices should move lower towards 75.20
levels in the coming trading sessions.
Technical View:
The price has been trading in falling channel pattern and fac-
ing resistance of upper trend line at 98 levels on hourly
chart. Moreover, price has formed bearish harami pattern on
hourly chart. Price has faced resistance of its horizontal
trend line at 97 levels on hourly chart.
On the other hand, Pair has been trading below its 21 hourly
exponential moving average which indicates that short term
trend is remains bearish.
A momentum oscillator RSI have been trading below 60 lev-
els on hourly chart which gives bullishness to the prices.
Moreover, momentum indicator MACD has shown negative
crossover on hourly chart and traded above of its signal line
which support our bearish view on the pair.
SEBI Certified – Research Analyst Equities I Commodities I Currencies I Mutual Funds
S3 S2 S1 Pivot R1 R2 R3
GBPINR 96.24 96.58 96.76 96.92 97.10 97.26 97.60
EURINR 75.14 75.48 75.65 75.82 75.99 76.16 76.50
4. Currency Highlights
SEBI Certified – Research Analyst Equities I Commodities I Currencies I Mutual Funds
Economic Indicators
Date Time Data Prior Expected Impact
18.05.16 5:20am Prelim GDP q/q -0.3% 0.1% Actual > Forecast = Good for
currency; JPYINR
18.05.16 2:00pm Average Earnings Index 3m/y 1.8% 1.7% Actual > Forecast = Good for
currency; GBPINR
18.05.16 2:00pm Claimant Count Change 6.7K 4.0K Actual > Forecast = Good for
currency; GBPINR
18.05.16 2:00pm Unemployment Rate 5.1% 5.1% Actual > Forecast = Good for
currency; GBPINR
18.05.16 2:30pm Final CPI y/y -0.2% -0.2% Actual > Forecast = Good for
currency; EURINR
18.05.16 8:00pm Crude Oil Inventories -3.4M Actual < Forecast = Good for
Crude Oil
18.05.16 11:30pm FOMC Meeting Minutes
18th
May’2016
5. Currency Highlights
18th
May’2016
SEBI Certified – Research Analyst Equities I Commodities I Currencies I Mutual Funds
Amit Pathania
Digitally signed by Amit Pathania
DN: cn=Amit Pathania, o=Choice Equity Broking Pvt. ltd, ou=Research
Department, email=amit.pathania@choiceindia.com, c=IN
Date: 2016.05.18 08:36:37 +05'30'