VIP Call Girl in Mumbai 💧 9920725232 ( Call Me ) Get A New Crush Everyday Wit...
Currency high lights 09.05.16
1. Currency Highlights
09th
May’2016
HighLights:
Indian Rupee grew marginally and ended at 66.54 on Thursday
US Non-Farm Employment Change fell to 160,000 in last month
Euro Zone RMPI declined by 1.3 points to 47.9-mark in April
Indian Rupee grew marginally and gained around one paise to end at
66.54 against the US dollar on Friday. The currency had appreciated on
account of mild selling of dollars from exporters and banks.
However, sharp positive movement in the currency was capped due to
weak domestic market sentiments. Indian Rupee moved in the range of
66.5450 to 66.62 in Friday’s trading session. The Reserve Bank of India
(RBI) reference rate for dollar was seen at 66.5830 and Euro stood at
75.9313 on Friday.
In cross-currency trades, the rupee moved down against the pound ster-
ling to finish at 96.44 from 96.20 yesterday. However, it ended steady
against the euro at 76.00. The domestic currency dropped against the yen
to 62.22 per 100 yens from 62.03.
US Dollar Index gained marginally around 0.1 percent in Friday’s trading session due to rise in risk aversion in global market
sentiments in early part of the trade which led to increase in demand for the low yielding currency.
However, unfavourable economic data from the country capped sharp gains in the currency.
US Average Hourly Earnings expanded by 0.3 percent in April as against a rise of 0.2 percent in March. Non-Farm Employment
Change dropped by 48,000 to 160,000 in last month from 208,000 in March. Unemployment Rate remained unchanged at 5
percent in the month of April. Consumer Credit was at a surplus of $29.7 billion in March with respect to surplus of $14.1 bil-
lion a month ago.
Euro against dollar fell marginally around 0.01 percent on Friday on account of strength in the dollar index. Further, weak eco-
nomic data from the region led to negative movement in the currency.
However, sharp downside in the currency was cushioned due to optimistic global market sentiments in later part of the trade.
Euro Zone Raw Materials Price Index (RMPI) declined by 1.3 points to 47.9-mark in April as against a rise of 49.2-level in
March.
The Sterling Pound against dollar dropped around 0.4 percent in Friday’s trade on account of strength in the dollar index. Fur-
ther, weak global market sentiments in early part of the trade led to negative movement in the currency.
The Japanese Yen against dollar appreciated around 0.12 percent in yesterday’s trade due to rise in risk aversion in global mar-
ket sentiments in early part of the trade which led to increase in demand for the low yielding currency.
However, unfavourable economic data from the country capped sharp gains in the currency.
SEBI Certified – Research Analyst Equities I Commodities I Currencies I Mutual Funds
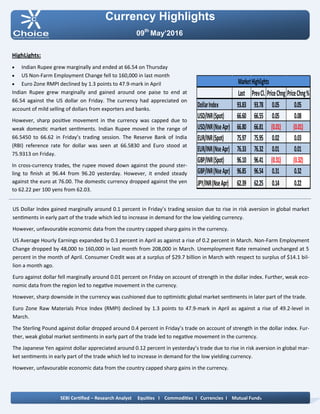
Last PrevCl. PriceChng PriceChng%
DollarIndex 93.83 93.78 0.05 0.05
USD/INR(Spot) 66.60 66.55 0.05 0.08
USD/INR(NseApr) 66.80 66.81 (0.01) (0.01)
EUR/INR(Spot) 75.97 75.95 0.02 0.03
EUR/INR(NseApr) 76.33 76.32 0.01 0.01
GBP/INR(Spot) 96.10 96.41 (0.31) (0.32)
GBP/INR(NseApr) 96.85 96.54 0.31 0.32
JPY/INR(NseApr) 62.39 62.25 0.14 0.22
MarketHighlights
2. Technical View:
The JPYINR price has been trading in rising wedge formation
form past few weeks. Price has faced strong resistance of up-
per band of wedge pattern at 63 levels on daily chart. Prices
have been facing resistance of falling trend line at 62.60 levels
on hourly chart.
Moreover, Pair has been trading below its 50 hourly exponen-
tial moving average which suggest short term trend remains
down.
On daily chart, momentum oscillator RSI has faced resistance
of horizontal trend line at 62 levels which suggest more selling
opportunity can be seen on higher side.
A momentum indicator MACD has shown negative sign on
daily chart, which indicates short term trend remains nega-
tive.
Pivot levels for the Day
Technical View:
The USDINR price has given breakdown of its rising trend line
at 66.90 levels on hourly chart. Moreover, price has been
moving in rectangle pattern and facing resistance at 67 levels
on daily chart.
On daily chart, USDINR has formed bearish doji candle stick
pattern which is bearish reversal pattern. Moreover, price
have been trading below its 50 daily exponential moving av-
erage so any rally towards 66.90 level, it would become the
best selling opportunity in near term.
A momentum indicator RSI has been trading below 60 levels
on hourly chart, which suggest bearishness in the prices.
Momentum indictor MACD has shown negative signs and
trading below single line on daily chart, which gives negative
confirmation to the prices.
For now we expect prices to move lower towards 66.40 lev-
els in few trading sessions.
Currency Highlights
09th
May’2016
USDINR JPYINR
SEBI Certified – Research Analyst Equities I Commodities I Currencies I Mutual Funds
S3 S2 S1 Pivot R1 R2 R3
USDINR 66.64 66.73 66.76 66.82 66.85 66.91 67.00
JPYINR 62.71 62.56 62.42 62.41 62.27 62.26 62.11
3. Pivot levels for the Day
Currency Highlights
09th
May’2016
GBPINR EURINR
Technical View:
The pair has faced strong resistance of its falling trend line at
77 levels. The price has been trading in rising channel for-
mation and facing resistance of upper band of channel
pattern at 77.50 levels. Price has given breakdown its sym-
metrical pattern at 76.60 levels on hourly chart. On the other
hand, Pair has been trading below its 50 hourly exponential
moving average which indicates that trend is remains down.
A momentum oscillator RSI have been trading below 60 lev-
els on daily chart which gives bearishness to the prices.
Moreover, momentum indicator MACD has shown negative
crossover on four hourly chart which support our bearish
view on the pair.
For now we expect prices should move lower towards 75.80
levels in the coming trading sessions.
Technical View:
The price has been trading in falling channel pattern and fac-
ing resistance of upper band of channel pattern at 98 levels
on daily chart. Moreover, price has formed the evening star
candle stick pattern with confirmation on daily chart.
on the other hand, Pair has been trading below its 100 daily
exponential moving average which indicates that trend is
remains down.
On hourly chart, GBPINR has given breakdown of its falling
channel pattern at 96.80 levels . A momentum oscillator RSI
have been trading below 60 levels on daily chart which gives
bearishness to the prices.
Moreover, momentum indicator MACD has shown negative
sign on daily chart which support our bullish view on the
pair.
SEBI Certified – Research Analyst Equities I Commodities I Currencies I Mutual Funds
S3 S2 S1 Pivot R1 R2 R3
GBPINR 96.05 96.44 96.65 96.83 97.04 97.22 97.61
EURINR 75.86 76.08 76.21 76.30 76.43 76.52 76.74
4. Currency Highlights
SEBI Certified – Research Analyst Equities I Commodities I Currencies I Mutual Funds
Economic Indicators
Date Time Data Prior Expected Impact
09.05.16 5:20am Monetary Policy Meeting
Minutes
09.05.16 11:30am German Factory Orders m/m 0.7% -1.2% Actual > Forecast = Good for
currency; EURINR
09.05.16 1:00pm Halifax HPI m/m 0.1% 2.6% Actual > Forecast = Good for
currency; GBPINR
09.05.16 All Day Eurogroup Meetings
09.05.16 9th-12th Mortgage Delinquencies 4.77% Actual > Forecast = Good for
currency; USDINR
09th
May’2016
5. Currency Highlights
09th
May’2016
SEBI Certified – Research Analyst Equities I Commodities I Currencies I Mutual Funds
Amit Pathania
Digitally signed by Amit Pathania
DN: cn=Amit Pathania, o=Choice Equity Broking Pvt. ltd, ou=Research
Department, email=amit.pathania@choiceindia.com, c=IN
Date: 2016.05.09 08:44:20 +05'30'