Call Girls Koregaon Park Call Me 7737669865 Budget Friendly No Advance Booking
Currency high lights 03.08.16
1. Currency Highlights
03rd
Aug’2016
HighLights:
Indian Rupee appreciated marginally to end at 66.73 in Tuesday’s
trade
US Core PCE Price Index dropped marginally to 0.1 percent in June
Spanish Unemployment Change plunged by 84,000 in the month of
July
UK’s Construction PMI fell marginally to 45.9-mark in the last month
Japan’s Consumer Confidence declined by 0.5 points to 41.3-mark in
July
Indian Rupee continued with its appreciation trend and gained marginally
by one paise to end at 66.73 against the US dollar on Tuesday. The curren-
cy appreciated on account of persistent selling of dollars by exporters and
banks. Further, constant inflow of foreign funds in equity and debt mar-
kets led to positive movement in the currency. Additionally, weaker dollar
index and hopes of passing of GST bill on Wednesday continued with up-
side trend in the currency. Indian Rupee moved in the range of 66.69 to
66.78 in Tuesday’s trading session.
In cross-currency trades, the rupee fell against the pound sterling to close at 88.35 from 87.96 on Monday and dropped fur-
ther against the euro to settle at 74.68 from 74.50 previously. The domestic currency also moved down further against the
Japanese yen to 65.55 per 100 yens from 65.27.
US Dollar Index fell around 0.7 percent in Tuesday’s trading session due to unfavourable economic data from the country.
However, sharp downside in the currency was cushioned as a result of rise in risk aversion in global market sentiments which
led to increase in demand for the low yielding currency.
US Core Personal Consumption Expenditures (PCE) Price Index dropped marginally to 0.1 percent in June as against a rise of
0.2 percent in May. Personal Spending unchanged at 0.4 percent in June. Personal Income also remained unchanged at 0.2
percent in June.
Euro against dollar jumped around 0.5 percent on Tuesday on account of weakness in the dollar index. However, weak global
market sentiments coupled with unfavourable economic data from the region capped sharp gains in the currency. Spanish Un-
employment Change plunged by 84,000 in July as against a drop of 1,24,300 in June. Euro Zone Producer Price Index (PPI) grew
by 0.7 percent in June from 0.6 percent a month ago.
The Sterling Pound surged by more than 1 percent in Tuesday’s trade due to weaker dollar. However, weak global market sen-
timents along with unfavourable economic data from the country capped sharp upside in the currency. UK’s Construction Pur-
chasing Managers' Index (PMI) fell marginally to 45.9-mark in July with respect to 46-level in June.
The Japanese Yen against dollar appreciated around 1.5 percent in Tuesday’s trading session due to rise in risk aversion in
global market sentiments which led to increase in demand for the low yielding currency. Japan’s Consumer Confidence de-
clined by 0.5 points to 41.3-mark in July as against a rise of 41.8-level in June.
SEBI Certified – Research Analyst Equities I Commodities I Currencies I Mutual Funds
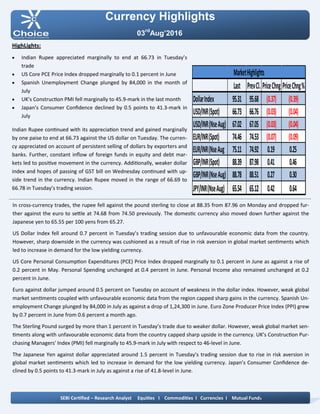
Last PrevCl. PriceChng PriceChng%
DollarIndex 95.31 95.68 (0.37) (0.39)
USD/INR(Spot) 66.73 66.76 (0.03) (0.04)
USD/INR(NseAug) 67.02 67.05 (0.03) (0.04)
EUR/INR(Spot) 74.46 74.53 (0.07) (0.09)
EUR/INR(NseAug 75.11 74.92 0.19 0.25
GBP/INR(Spot) 88.39 87.98 0.41 0.46
GBP/INR(NseAug) 88.78 88.51 0.27 0.30
JPY/INR(NseAug) 65.54 65.12 0.42 0.64
MarketHighlights
2. Technical View:
The price has taken support of its rising trend line at 64.50
levels on daily chart. The pair has been trading in rising chan-
nel pattern and price has taken support of its lower band of
channel pattern at 63.40 levels on daily chart. Price has
formed bullish inverted hammer candle stick pattern with ap-
pealing volumes which is bullish reversal pattern.
In addition, on daily chart prices have been trading above its
21 daily exponential moving average which gives the bullish
confirmation to the prices.
On daily chart, momentum oscillator RSI has moved above
50 levels, which gives positive confirmation to the prices.
A momentum indicator MACD has shown positive sign on 4
hourly chart, which indicates short term trend remains bull-
ish.
For now we expect prices to move higher towards 66.40 lev-
els in few trading sessions.
Pivot levels for the Day
Technical View:
The prices have been trading in rising channel pattern form
past few weeks and price has shown breakdown of its lower
band of channel pattern at 67.40 levels on daily chart. Prices
have been facing resistance of horizontal trend line at 67.50
levels on daily chart.
Moreover, price have been trading below its 21 daily expo-
nential moving average which suggest near term trend is
weak. So any rally in the prices towards 67.10 level, used as
selling opportunity.
A momentum indicator RSI has remained below 60 levels on
daily chart, which suggest bearishness in the prices.
A momentum indictor MACD has given negative sign on 4
hourly chart, which gives negative confirmation to the prices.
For now we expect prices to move lower towards 66.65 lev-
els in few trading sessions.
Currency Highlights
03rd
Aug’2016
USDINR JPYINR
SEBI Certified – Research Analyst Equities I Commodities I Currencies I Mutual Funds
S3 S2 S1 Pivot R1 R2 R3
USDINR 66.84 66.93 66.97 67.02 67.06 67.11 67.20
JPYINR 64.23 64.96 65.39 65.69 66.12 66.42 67.15
3. Pivot levels for the Day
Currency Highlights
03rd
Aug’2016
GBPINR EURINR
Technical View:
The prices have been trading in ascending triangle pattern
from past few weeks and prices has taken support of its low-
er band of triangle pattern at 74 levels in daily chart.
On the other hand, Pair has been trading above its 21 daily
exponential moving average which indicates that trend is
remains up.
A momentum oscillator RSI have been trading above 50 lev-
els on daily chart which gives the signs of bullishness to the
prices.
Moreover, momentum indicator MACD has shown positive
crossover on daily chart which support our bullish view on
the pair.
For now we expect prices should move higher towards 75.70
levels in the coming trading sessions.
Technical View:
The price has shown breakdown of its failing channel
pattern at 89.80 levels. The price has shown breakdown of its
horizontal trend line at 89.60 levels on daily chart. Price has
been facing resistance of its falling trend line at 88.50 levels
on daily 88.70 daily chart.
The price has formed bearish candle on daily with appalling
volumes which indicates further down side movement.
A momentum indicator RSI has moved below at 40 levels
on hourly chart, which suggest bearishness in the prices.
Moreover, momentum indicator MACD has shown negative
sign on hourly chart which support our bearish view on the
pair.
For now we expect prices should move lower towards 87.80
levels in the coming trading sessions.
SEBI Certified – Research Analyst Equities I Commodities I Currencies I Mutual Funds
S3 S2 S1 Pivot R1 R2 R3
GBPINR 87.71 88.19 88.48 88.67 88.96 89.15 89.63
EURINR 74.53 74.79 74.95 75.05 75.21 75.31 75.57
4. Currency Highlights
SEBI Certified – Research Analyst Equities I Commodities I Currencies I Mutual Funds
Economic Indicators
Date Time Data Prior Expected Impact
03.08.16 7:15AM Caixin Services PMI 52.7 52.9 Actual > Forecast = Good for
Yuan
03.08.16 2:00PM Services PMI 47.4 47.4 Actual > Forecast = Good for
currency; GBPINR
03.08.16 5:45PM ADP Non-Farm Employment
Change
172K 171K Actual > Forecast = Good for
currency; USDINR
03.08.16 7:30PM ISM Non-Manufacturing PMI 56.5 56.0 Actual > Forecast = Good for
currency; USDINR
03.08.16 8:00PM Crude Oil Inventories 1.7M 0.3% Actual < Forecast = Good for
Crude Oil
03rd
Aug’2016
5. Currency Highlights
03rd
Aug’2016
SEBI Certified – Research Analyst Equities I Commodities I Currencies I Mutual Funds
Amit Pathania
Digitally signed by Amit Pathania
DN: cn=Amit Pathania, o=Choice Equity Broking Pvt. ltd, ou=Research
Department, email=amit.pathania@choiceindia.com, c=IN
Date: 2016.08.03 08:45:49 +05'30'