
Recommended
More Related Content
What's hot
What's hot (20)
Similar to Currency high lights 05.07.16
Similar to Currency high lights 05.07.16 (20)
Recently uploaded
Recently uploaded (20)
Currency high lights 05.07.16
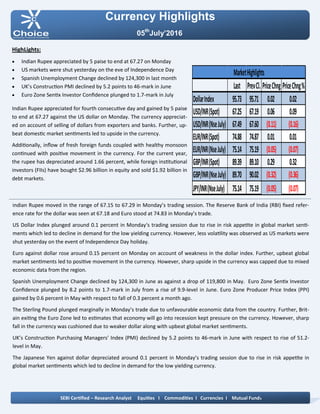
- 1. Currency Highlights 05th July’2016 HighLights: Indian Rupee appreciated by 5 paise to end at 67.27 on Monday US markets were shut yesterday on the eve of Independence Day Spanish Unemployment Change declined by 124,300 in last month UK’s Construction PMI declined by 5.2 points to 46-mark in June Euro Zone Sentix Investor Confidence plunged to 1.7-mark in July Indian Rupee appreciated for fourth consecutive day and gained by 5 paise to end at 67.27 against the US dollar on Monday. The currency appreciat- ed on account of selling of dollars from exporters and banks. Further, up- beat domestic market sentiments led to upside in the currency. Additionally, inflow of fresh foreign funds coupled with healthy monsoon continued with positive movement in the currency. For the current year, the rupee has depreciated around 1.66 percent, while foreign institutional investors (FIIs) have bought $2.96 billion in equity and sold $1.92 billion in debt markets. Indian Rupee moved in the range of 67.15 to 67.29 in Monday’s trading session. The Reserve Bank of India (RBI) fixed refer- ence rate for the dollar was seen at 67.18 and Euro stood at 74.83 in Monday’s trade. US Dollar Index plunged around 0.1 percent in Monday‘s trading session due to rise in risk appetite in global market senti- ments which led to decline in demand for the low yielding currency. However, less volatility was observed as US markets were shut yesterday on the event of Independence Day holiday. Euro against dollar rose around 0.15 percent on Monday on account of weakness in the dollar index. Further, upbeat global market sentiments led to positive movement in the currency. However, sharp upside in the currency was capped due to mixed economic data from the region. Spanish Unemployment Change declined by 124,300 in June as against a drop of 119,800 in May. Euro Zone Sentix Investor Confidence plunged by 8.2 points to 1.7-mark in July from a rise of 9.9-level in June. Euro Zone Producer Price Index (PPI) gained by 0.6 percent in May with respect to fall of 0.3 percent a month ago. The Sterling Pound plunged marginally in Monday’s trade due to unfavourable economic data from the country. Further, Brit- ain exiting the Euro Zone led to estimates that economy will go into recession kept pressure on the currency. However, sharp fall in the currency was cushioned due to weaker dollar along with upbeat global market sentiments. UK’s Construction Purchasing Managers' Index (PMI) declined by 5.2 points to 46-mark in June with respect to rise of 51.2- level in May. The Japanese Yen against dollar depreciated around 0.1 percent in Monday’s trading session due to rise in risk appetite in global market sentiments which led to decline in demand for the low yielding currency. SEBI Certified – Research Analyst Equities I Commodities I Currencies I Mutual Funds Last PrevCl. PriceChng PriceChng% DollarIndex 95.73 95.71 0.02 0.02 USD/INR(Spot) 67.25 67.19 0.06 0.09 USD/INR(NseJuly) 67.49 67.60 (0.11) (0.16) EUR/INR(Spot) 74.88 74.87 0.01 0.01 EUR/INR(NseJuly) 75.14 75.19 (0.05) (0.07) GBP/INR(Spot) 89.39 89.10 0.29 0.32 GBP/INR(NseJuly) 89.70 90.02 (0.32) (0.36) JPY/INR(NseJuly) 75.14 75.19 (0.05) (0.07) MarketHighlights
- 2. Technical View: The pair has shown breakout of its rising wedge pattern at 65.50 levels on daily chart. The price has retested its breakout levels on daily chart, which indicates further upside momen- tum in the prices. In addition, on daily chart prices have been trading above its 21 daily exponential moving average which gives the positive confirmation to the prices. On daily chart, momentum oscillator RSI has remained above 60 levels, which gives positive confirmation to the prices. A momentum indicator MACD has shown positive crossover on daily chart, which indicates short term trend remains bull- ish. For now we expect prices to move higher towards 66.10 lev- els in few trading sessions. Pivot levels for the Day Technical View: The price has been trading in its rising channel formation from past few months and price has faced resistance of its upper band at 68.50 levels on daily chart. Price has faced re- sistance of its horizontal trend line at 68 levels on daily. Moreover, price have been trading below its 21 daily expo- nential moving average which suggest near term remains down. So any rally in the prices towards 67.85 level, used as selling opportunity. A momentum indicator RSI has moved below 60 levels on daily chart, which suggest bearishness in the prices. A momentum indictor MACD has given negative signs on dai- ly chart, which gives negative confirmation to the prices. For now we expect prices to move lower towards 67.10 lev- els in few trading sessions. Currency Highlights 05th July’2016 USDINR JPYINR SEBI Certified – Research Analyst Equities I Commodities I Currencies I Mutual Funds S3 S2 S1 Pivot R1 R2 R3 USDINR 67.11 67.30 67.40 67.49 67.59 67.68 67.87 JPYINR 65.31 65.51 65.63 65.71 65.83 65.91 66.11
- 3. Pivot levels for the Day Currency Highlights 05th July’2016 GBPINR EURINR Technical View: The price has shown breakout of its symmetrical triangle patter at 75.50 levels on daily chart. he price has shown breakdown of its rising channel pattern at 75.50 levels on daily chart. On the other hand, Pair has been trading below its 21 daily exponential moving average which indicates that trend is remains down. A momentum oscillator RSI have been trading below 45 lev- els on daily chart which gives the signs of bearishness to the prices. Moreover, momentum indicator MACD has shown negative crossover on daily chart which support our bearish view on the pair. For now we expect prices should move lower towards 74.30 levels in the coming trading sessions. Technical View: The price has shown breakdown of its horizontal channel pattern at 94 levels on daily chart. So any rally in the prices towards 91.50 level, used as selling opportunity. On the other hand, pair has been trading below its 50 daily exponential moving average which indicates that short term trend is remains bearish. The price has given breakdown of its horizontal trend line at 90.50 levels on daily chart. A momentum indicator RSI has moved below 45 levels on daily chart, which suggest bearishness in the prices. Moreover, momentum indicator MACD has shown negative crossover on daily chart which support our bearish view on the pair. For now we expect prices should move lower towards 89 levels in the coming trading sessions. SEBI Certified – Research Analyst Equities I Commodities I Currencies I Mutual Funds S3 S2 S1 Pivot R1 R2 R3 GBPINR 88.65 89.19 89.45 89.73 89.99 90.27 90.81 EURINR 74.53 74.80 74.97 75.07 75.24 75.34 75.61
- 4. Currency Highlights SEBI Certified – Research Analyst Equities I Commodities I Currencies I Mutual Funds Economic Indicators Date Time Data Prior Expected Impact 05.07.16 7:15am Caixin Services PMI 51.2 52.3 Actual > Forecast = Good for Yuan 05.07.16 2:00pm Services PMI 53.5 53.1 Actual > Forecast = Good for currency; GBPINR 05.07.16 3:00pm BOE Financial Stability Report 05.07.16 3:30pm BOE Gov Carney Speaks 05.07.16 7:30pm Factory Orders m/m 1.9% -0.7% Actual > Forecast = Good for currency; USDINR 05th July’2016
- 5. Currency Highlights 05th July’2016 SEBI Certified – Research Analyst Equities I Commodities I Currencies I Mutual Funds Amit Pathania Digitally signed by Amit Pathania DN: cn=Amit Pathania, o=Choice Equity Broking Pvt. ltd, ou=Research Department, email=amit.pathania@choiceindia.com, c=IN Date: 2016.07.05 08:48:38 +05'30'