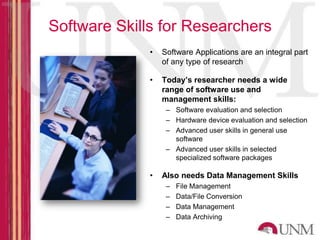
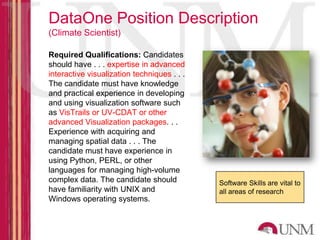
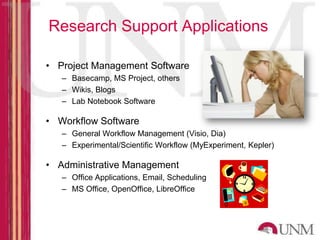
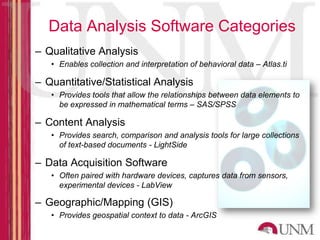
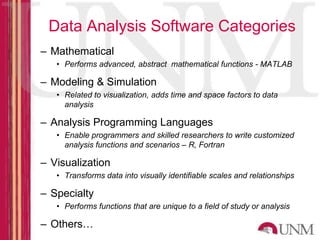
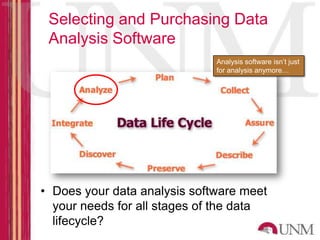
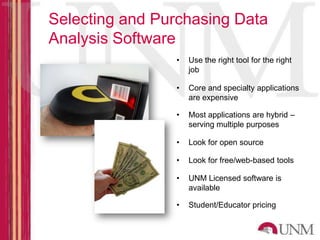
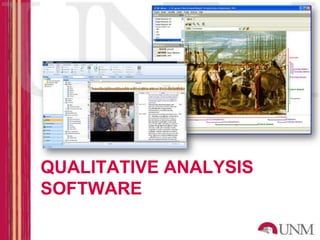
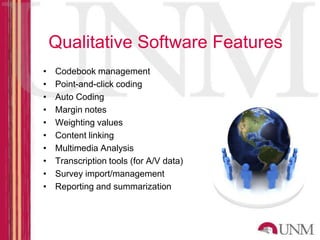
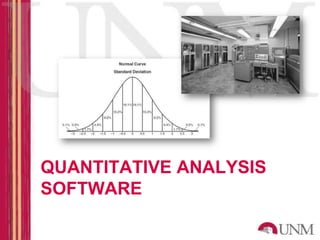
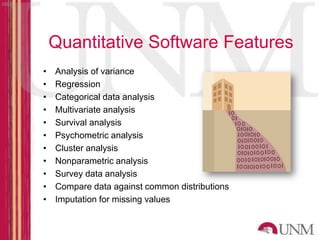
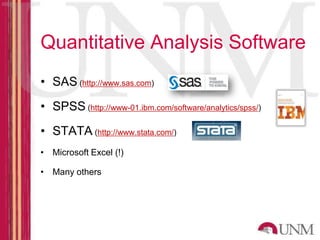
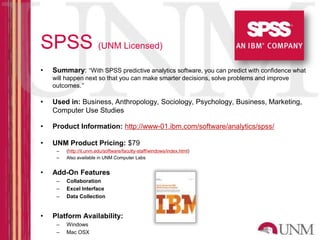
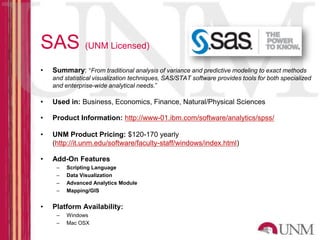
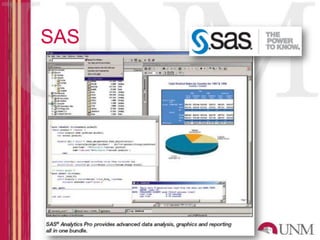
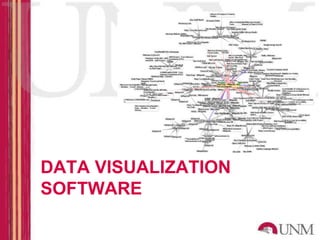
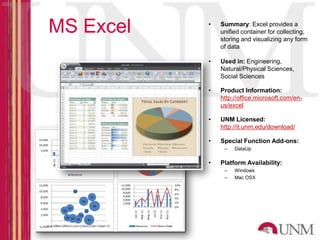
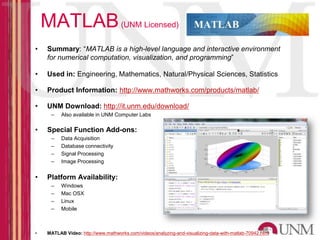
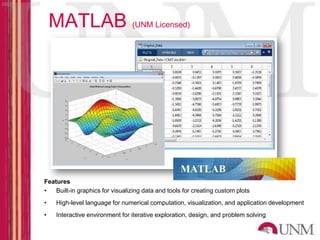
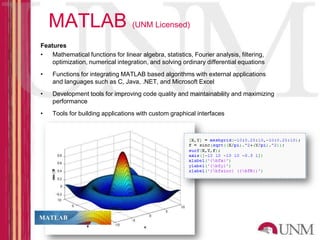
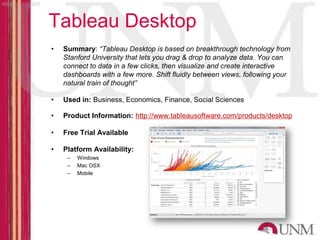
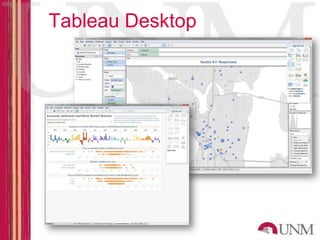
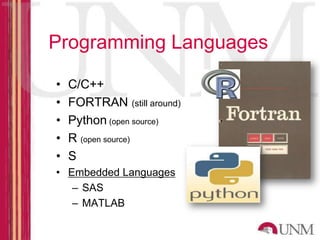
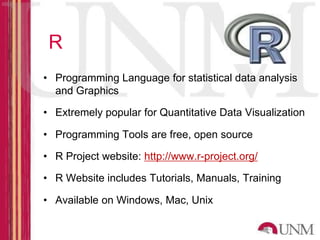
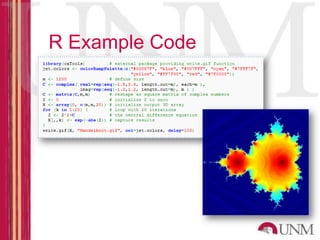
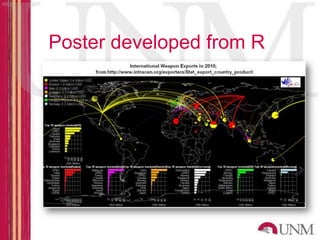
Software for Data Analysis
                    October 30 & 31, 2012


        Kevin J. Comerford, MS, MFA
        Assistant Professor / Digital Initiatives Librarian
INTRODUCTION
Software Skills for Researchers
              •   Software Applications are an integral part
                  of any type of research

              •   Today’s researcher needs a wide
                  range of software use and
                  management skills:
                   – Software evaluation and selection
                   – Hardware device evaluation and selection
                   – Advanced user skills in general use
                     software
                   – Advanced user skills in selected
                     specialized software packages

              •   Also needs Data Management Skills
                   –   File Management
                   –   Data/File Conversion
                   –   Data Management
                   –   Data Archiving
DataOne Position Description
(Climate Scientist)

Required Qualifications: Candidates
should have . . . expertise in advanced
interactive visualization techniques . . .
The candidate must have knowledge
and practical experience in developing
and using visualization software such
as VisTrails or UV-CDAT or other
advanced Visualization packages. . .
Experience with acquiring and
managing spatial data . . . The
candidate must have experience in
using Python, PERL, or other
languages for managing high-volume
complex data. The candidate should           Software Skills are vital to
have familiarity with UNIX and               all areas of research
Windows operating systems.
US Government Position Description
(Social Scientist)
For GS-11 Grade Level:
A. One year of specialized experience
equivalent to the GS-9 grade level in
Federal service, providing analytic
support for policy analysis and social
science research related to evaluating
legislative, regulatory and/or the
delivery of public health or human
services programs; performing
quantitative analyses related to health
and human services programs and
policy utilizing statistical software such
as STATA, SPSS, SAS or equivalent
statistical software.                        Software Skills are vital to
                                             all areas of research
Research Support Applications

• Project Management Software
   – Basecamp, MS Project, others
   – Wikis, Blogs
   – Lab Notebook Software

• Workflow Software
   – General Workflow Management (Visio, Dia)
   – Experimental/Scientific Workflow (MyExperiment, Kepler)

• Administrative Management
   – Office Applications, Email, Scheduling
   – MS Office, OpenOffice, LibreOffice
Data Analysis Software Categories
– Qualitative Analysis
   • Enables collection and interpretation of behavioral data – Atlas.ti

– Quantitative/Statistical Analysis
   • Provides tools that allow the relationships between data elements to
     be expressed in mathematical terms – SAS/SPSS

– Content Analysis
   • Provides search, comparison and analysis tools for large collections
     of text-based documents - LightSide

– Data Acquisition Software
   • Often paired with hardware devices, captures data from sensors,
     experimental devices - LabView

– Geographic/Mapping (GIS)
   • Provides geospatial context to data - ArcGIS
Data Analysis Software Categories
– Mathematical
   • Performs advanced, abstract mathematical functions - MATLAB

– Modeling & Simulation
   • Related to visualization, adds time and space factors to data
     analysis

– Analysis Programming Languages
   • Enable programmers and skilled researchers to write customized
     analysis functions and scenarios – R, Fortran

– Visualization
   • Transforms data into visually identifiable scales and relationships

– Specialty
   • Performs functions that are unique to a field of study or analysis

– Others…
Selecting and Purchasing Data
 Analysis Software
                              Analysis software isn’t just
                              for analysis anymore…


• Does your data analysis software meet
  your needs for all stages of the data
  lifecycle?
Selecting and Purchasing Data
Analysis Software
                •   Use the right tool for the right
                    job

                •   Core and specialty applications
                    are expensive

                •   Most applications are hybrid –
                    serving multiple purposes

                •   Look for open source

                •   Look for free/web-based tools

                •   UNM Licensed software is
                    available

                •   Student/Educator pricing
QUALITATIVE ANALYSIS
SOFTWARE
Qualitative Software Features
•   Codebook management
•   Point-and-click coding
•   Auto Coding
•   Margin notes
•   Weighting values
•   Content linking
•   Multimedia Analysis
•   Transcription tools (for A/V data)
•   Survey import/management
•   Reporting and summarization
Qualitative Analysis Software
• Atlas.ti (http://www.atlasti.com)

• NVIVO (http://www.qsrinternational.com)

• QDA Miner (http://provalisresearch.com)

• Content Analysis
    – LightSide (http://www.cs.cmu.edu/~emayfiel/side.html)
Atlas.ti
•   Summary: “The purpose of ATLAS.ti is to help researchers uncover and systematically
    analyze complex phenomena hidden in text and multimedia data. The program provides tools
    that let the user locate, code, and annotate findings in primary data material, to weigh and
    evaluate their importance, and to visualize complex relations between them.”

•   Used in: Anthropology, Sociology, Psychology, Business, Marketing, Computer
    Use Studies

•   Product Information: http://www.atlasti.com

•   Product Pricing: $99 student rate with ID

•   Special Function Add-ons:
     –   Geospatial Data Plotting
     –   Online Survey Management
     –   Data Visualization


•   Platform Availability:
     –   Windows
     –   Mac OSX
Atlas.ti
Atlas.ti
QUANTITATIVE ANALYSIS
SOFTWARE
Quantitative Software Features
•   Analysis of variance
•   Regression
•   Categorical data analysis
•   Multivariate analysis
•   Survival analysis
•   Psychometric analysis
•   Cluster analysis
•   Nonparametric analysis
•   Survey data analysis
•   Compare data against common distributions
•   Imputation for missing values
Quantitative Analysis Software
• SAS (http://www.sas.com)
• SPSS (http://www-01.ibm.com/software/analytics/spss/)
• STATA (http://www.stata.com/)
• Microsoft Excel (!)

• Many others
SPSS (UNM Licensed)
•   Summary: “With SPSS predictive analytics software, you can predict with confidence what
    will happen next so that you can make smarter decisions, solve problems and improve
    outcomes.”

•   Used in: Business, Anthropology, Sociology, Psychology, Business, Marketing,
    Computer Use Studies

•   Product Information: http://www-01.ibm.com/software/analytics/spss/

•   UNM Product Pricing: $79
     –   (http://it.unm.edu/software/faculty-staff/windows/index.html)
     –   Also available in UNM Computer Labs


•   Add-On Features
     –   Collaboration
     –   Excel Interface
     –   Data Collection


•   Platform Availability:
     –   Windows
     –   Mac OSX
SPSS
SAS (UNM Licensed)
•   Summary: “From traditional analysis of variance and predictive modeling to exact methods
    and statistical visualization techniques, SAS/STAT software provides tools for both specialized
    and enterprise-wide analytical needs.”

•   Used in: Business, Economics, Finance, Natural/Physical Sciences

•   Product Information: http://www-01.ibm.com/software/analytics/spss/

•   UNM Product Pricing: $120-170 yearly
    (http://it.unm.edu/software/faculty-staff/windows/index.html)

•   Add-On Features
     –   Scripting Language
     –   Data Visualization
     –   Advanced Analytics Module
     –   Mapping/GIS


•   Platform Availability:
     –   Windows
     –   Mac OSX
SAS
SAS
DATA VISUALIZATION
SOFTWARE
Visualization Feature Sets
•   Mapping data sets (down to level of US states and
    counties).
•   Broad range of charts and plots:
•   Scatter, line, area, bubble, multiple axis, overlay.
•   Bar, pie, donut, star, block.
•   Customized colors, line styles, symbols.
•   2-D and 3-D plots with tilting and rotation.
•   Generate static or dynamic interactive (Java or
    ActiveX) charts and graphs with drill-down
    capabilities.
•   Link graphs to Web pages.
•   Embed interactive graphics in Web pages or Microsoft
    documents.
•   Support for common types of printers and plotters.
Data Visualization
•   Wikipedia Lists 45 applications
    (http://en.wikipedia.org/wiki/Data_visualization#Data_visualization_software)


•   Microsoft Excel (!)
•   MATLAB (UNM Licensed)
•   Tableau Desktop
•   TrendAnalyzer
•   VisTrails
•   Visual.ly (http://visual.ly)

• Many Specialized Applications
     – Climate Visualization
            • UV-CDAT
            • NCAR
MS Excel   •   Summary: Excel provides a
               unified container for collecting,
               storing and visualizing any form
               of data

           •   Used in: Engineering,
               Natural/Physical Sciences,
               Social Sciences

           •   Product Information:
               http://office.microsoft.com/en-
               us/excel

           •   UNM Licensed:
               http://it.unm.edu/download/

           •   Special Function Add-ons:
                –   DataUp

           •   Platform Availability:
                –   Windows
                –   Mac OSX
MATLAB (UNM Licensed)
•    Summary: “MATLAB is a high-level language and interactive environment
     for numerical computation, visualization, and programming”

•    Used in: Engineering, Mathematics, Natural/Physical Sciences, Statistics

•    Product Information: http://www.mathworks.com/products/matlab/

•    UNM Download: http://it.unm.edu/download/
      –    Also available in UNM Computer Labs

•    Special Function Add-ons:
      –    Data Acquisition
      –    Database connectivity
      –    Signal Processing
      –    Image Processing


•    Platform Availability:
      –    Windows
      –    Mac OSX
      –    Linux
      –    Mobile


•    MATLAB Video: http://www.mathworks.com/videos/analyzing-and-visualizing-data-with-matlab-70942.html
MATLAB (UNM Licensed)


Features
•   Built-in graphics for visualizing data and tools for creating custom plots
•    High-level language for numerical computation, visualization, and application development
•    Interactive environment for iterative exploration, design, and problem solving
MATLAB (UNM Licensed)
Features
•   Mathematical functions for linear algebra, statistics, Fourier analysis, filtering,
    optimization, numerical integration, and solving ordinary differential equations
•   Functions for integrating MATLAB based algorithms with external applications
    and languages such as C, Java, .NET, and Microsoft Excel
•   Development tools for improving code quality and maintainability and maximizing
    performance
•   Tools for building applications with custom graphical interfaces
Tableau Desktop
•   Summary: “Tableau Desktop is based on breakthrough technology from
    Stanford University that lets you drag & drop to analyze data. You can
    connect to data in a few clicks, then visualize and create interactive
    dashboards with a few more. Shift fluidly between views, following your
    natural train of thought”

•   Used in: Business, Economics, Finance, Social Sciences

•   Product Information: http://www.tableausoftware.com/products/desktop

•   Free Trial Available

•   Platform Availability:
     –   Windows
     –   Mac OSX
     –   Mobile
Tableau Desktop
DATA ANALYSIS
PROGRAMMING
LANGUAGES
Programming Languages

•   C/C++
•   FORTRAN (still around)
•   Python (open source)
•   R (open source)
•   S
• Embedded Languages
   – SAS
   – MATLAB
R
• Programming Language for statistical data analysis
  and Graphics

• Extremely popular for Quantitative Data Visualization

• Programming Tools are free, open source

• R Project website: http://www.r-project.org/

• R Website includes Tutorials, Manuals, Training

• Available on Windows, Mac, Unix
R Example Code
Poster developed from R

Software Programs for Data Analysis

  • 1.
    Software for DataAnalysis October 30 & 31, 2012 Kevin J. Comerford, MS, MFA Assistant Professor / Digital Initiatives Librarian
  • 2.
  • 3.
    Software Skills forResearchers • Software Applications are an integral part of any type of research • Today’s researcher needs a wide range of software use and management skills: – Software evaluation and selection – Hardware device evaluation and selection – Advanced user skills in general use software – Advanced user skills in selected specialized software packages • Also needs Data Management Skills – File Management – Data/File Conversion – Data Management – Data Archiving
  • 4.
    DataOne Position Description (ClimateScientist) Required Qualifications: Candidates should have . . . expertise in advanced interactive visualization techniques . . . The candidate must have knowledge and practical experience in developing and using visualization software such as VisTrails or UV-CDAT or other advanced Visualization packages. . . Experience with acquiring and managing spatial data . . . The candidate must have experience in using Python, PERL, or other languages for managing high-volume complex data. The candidate should Software Skills are vital to have familiarity with UNIX and all areas of research Windows operating systems.
  • 5.
    US Government PositionDescription (Social Scientist) For GS-11 Grade Level: A. One year of specialized experience equivalent to the GS-9 grade level in Federal service, providing analytic support for policy analysis and social science research related to evaluating legislative, regulatory and/or the delivery of public health or human services programs; performing quantitative analyses related to health and human services programs and policy utilizing statistical software such as STATA, SPSS, SAS or equivalent statistical software. Software Skills are vital to all areas of research
  • 6.
    Research Support Applications •Project Management Software – Basecamp, MS Project, others – Wikis, Blogs – Lab Notebook Software • Workflow Software – General Workflow Management (Visio, Dia) – Experimental/Scientific Workflow (MyExperiment, Kepler) • Administrative Management – Office Applications, Email, Scheduling – MS Office, OpenOffice, LibreOffice
  • 7.
    Data Analysis SoftwareCategories – Qualitative Analysis • Enables collection and interpretation of behavioral data – Atlas.ti – Quantitative/Statistical Analysis • Provides tools that allow the relationships between data elements to be expressed in mathematical terms – SAS/SPSS – Content Analysis • Provides search, comparison and analysis tools for large collections of text-based documents - LightSide – Data Acquisition Software • Often paired with hardware devices, captures data from sensors, experimental devices - LabView – Geographic/Mapping (GIS) • Provides geospatial context to data - ArcGIS
  • 8.
    Data Analysis SoftwareCategories – Mathematical • Performs advanced, abstract mathematical functions - MATLAB – Modeling & Simulation • Related to visualization, adds time and space factors to data analysis – Analysis Programming Languages • Enable programmers and skilled researchers to write customized analysis functions and scenarios – R, Fortran – Visualization • Transforms data into visually identifiable scales and relationships – Specialty • Performs functions that are unique to a field of study or analysis – Others…
  • 9.
    Selecting and PurchasingData Analysis Software Analysis software isn’t just for analysis anymore… • Does your data analysis software meet your needs for all stages of the data lifecycle?
  • 10.
    Selecting and PurchasingData Analysis Software • Use the right tool for the right job • Core and specialty applications are expensive • Most applications are hybrid – serving multiple purposes • Look for open source • Look for free/web-based tools • UNM Licensed software is available • Student/Educator pricing
  • 11.
  • 12.
    Qualitative Software Features • Codebook management • Point-and-click coding • Auto Coding • Margin notes • Weighting values • Content linking • Multimedia Analysis • Transcription tools (for A/V data) • Survey import/management • Reporting and summarization
  • 13.
    Qualitative Analysis Software •Atlas.ti (http://www.atlasti.com) • NVIVO (http://www.qsrinternational.com) • QDA Miner (http://provalisresearch.com) • Content Analysis – LightSide (http://www.cs.cmu.edu/~emayfiel/side.html)
  • 14.
    Atlas.ti • Summary: “The purpose of ATLAS.ti is to help researchers uncover and systematically analyze complex phenomena hidden in text and multimedia data. The program provides tools that let the user locate, code, and annotate findings in primary data material, to weigh and evaluate their importance, and to visualize complex relations between them.” • Used in: Anthropology, Sociology, Psychology, Business, Marketing, Computer Use Studies • Product Information: http://www.atlasti.com • Product Pricing: $99 student rate with ID • Special Function Add-ons: – Geospatial Data Plotting – Online Survey Management – Data Visualization • Platform Availability: – Windows – Mac OSX
  • 15.
  • 16.
  • 17.
  • 18.
    Quantitative Software Features • Analysis of variance • Regression • Categorical data analysis • Multivariate analysis • Survival analysis • Psychometric analysis • Cluster analysis • Nonparametric analysis • Survey data analysis • Compare data against common distributions • Imputation for missing values
  • 19.
    Quantitative Analysis Software •SAS (http://www.sas.com) • SPSS (http://www-01.ibm.com/software/analytics/spss/) • STATA (http://www.stata.com/) • Microsoft Excel (!) • Many others
  • 20.
    SPSS (UNM Licensed) • Summary: “With SPSS predictive analytics software, you can predict with confidence what will happen next so that you can make smarter decisions, solve problems and improve outcomes.” • Used in: Business, Anthropology, Sociology, Psychology, Business, Marketing, Computer Use Studies • Product Information: http://www-01.ibm.com/software/analytics/spss/ • UNM Product Pricing: $79 – (http://it.unm.edu/software/faculty-staff/windows/index.html) – Also available in UNM Computer Labs • Add-On Features – Collaboration – Excel Interface – Data Collection • Platform Availability: – Windows – Mac OSX
  • 21.
  • 22.
    SAS (UNM Licensed) • Summary: “From traditional analysis of variance and predictive modeling to exact methods and statistical visualization techniques, SAS/STAT software provides tools for both specialized and enterprise-wide analytical needs.” • Used in: Business, Economics, Finance, Natural/Physical Sciences • Product Information: http://www-01.ibm.com/software/analytics/spss/ • UNM Product Pricing: $120-170 yearly (http://it.unm.edu/software/faculty-staff/windows/index.html) • Add-On Features – Scripting Language – Data Visualization – Advanced Analytics Module – Mapping/GIS • Platform Availability: – Windows – Mac OSX
  • 23.
  • 24.
  • 25.
  • 26.
    Visualization Feature Sets • Mapping data sets (down to level of US states and counties). • Broad range of charts and plots: • Scatter, line, area, bubble, multiple axis, overlay. • Bar, pie, donut, star, block. • Customized colors, line styles, symbols. • 2-D and 3-D plots with tilting and rotation. • Generate static or dynamic interactive (Java or ActiveX) charts and graphs with drill-down capabilities. • Link graphs to Web pages. • Embed interactive graphics in Web pages or Microsoft documents. • Support for common types of printers and plotters.
  • 27.
    Data Visualization • Wikipedia Lists 45 applications (http://en.wikipedia.org/wiki/Data_visualization#Data_visualization_software) • Microsoft Excel (!) • MATLAB (UNM Licensed) • Tableau Desktop • TrendAnalyzer • VisTrails • Visual.ly (http://visual.ly) • Many Specialized Applications – Climate Visualization • UV-CDAT • NCAR
  • 28.
    MS Excel • Summary: Excel provides a unified container for collecting, storing and visualizing any form of data • Used in: Engineering, Natural/Physical Sciences, Social Sciences • Product Information: http://office.microsoft.com/en- us/excel • UNM Licensed: http://it.unm.edu/download/ • Special Function Add-ons: – DataUp • Platform Availability: – Windows – Mac OSX
  • 29.
    MATLAB (UNM Licensed) • Summary: “MATLAB is a high-level language and interactive environment for numerical computation, visualization, and programming” • Used in: Engineering, Mathematics, Natural/Physical Sciences, Statistics • Product Information: http://www.mathworks.com/products/matlab/ • UNM Download: http://it.unm.edu/download/ – Also available in UNM Computer Labs • Special Function Add-ons: – Data Acquisition – Database connectivity – Signal Processing – Image Processing • Platform Availability: – Windows – Mac OSX – Linux – Mobile • MATLAB Video: http://www.mathworks.com/videos/analyzing-and-visualizing-data-with-matlab-70942.html
  • 30.
    MATLAB (UNM Licensed) Features • Built-in graphics for visualizing data and tools for creating custom plots • High-level language for numerical computation, visualization, and application development • Interactive environment for iterative exploration, design, and problem solving
  • 31.
    MATLAB (UNM Licensed) Features • Mathematical functions for linear algebra, statistics, Fourier analysis, filtering, optimization, numerical integration, and solving ordinary differential equations • Functions for integrating MATLAB based algorithms with external applications and languages such as C, Java, .NET, and Microsoft Excel • Development tools for improving code quality and maintainability and maximizing performance • Tools for building applications with custom graphical interfaces
  • 32.
    Tableau Desktop • Summary: “Tableau Desktop is based on breakthrough technology from Stanford University that lets you drag & drop to analyze data. You can connect to data in a few clicks, then visualize and create interactive dashboards with a few more. Shift fluidly between views, following your natural train of thought” • Used in: Business, Economics, Finance, Social Sciences • Product Information: http://www.tableausoftware.com/products/desktop • Free Trial Available • Platform Availability: – Windows – Mac OSX – Mobile
  • 33.
  • 34.
  • 35.
    Programming Languages • C/C++ • FORTRAN (still around) • Python (open source) • R (open source) • S • Embedded Languages – SAS – MATLAB
  • 36.
    R • Programming Languagefor statistical data analysis and Graphics • Extremely popular for Quantitative Data Visualization • Programming Tools are free, open source • R Project website: http://www.r-project.org/ • R Website includes Tutorials, Manuals, Training • Available on Windows, Mac, Unix
  • 37.
  • 38.