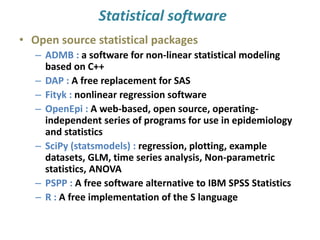
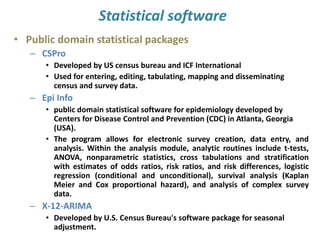
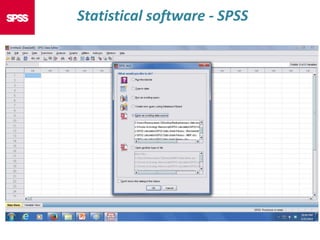
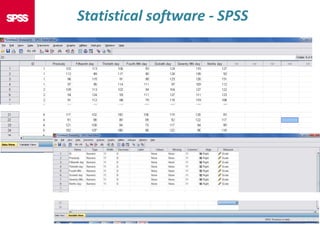
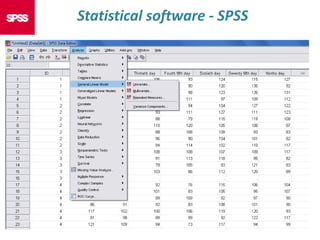
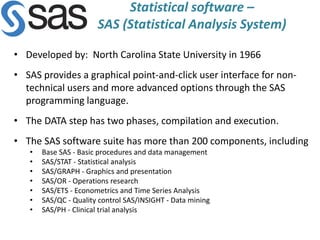
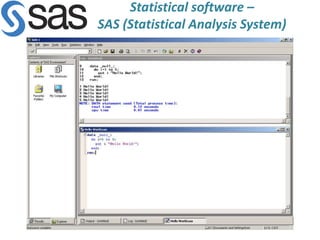
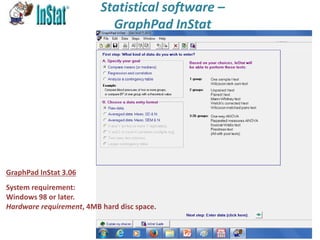
This document discusses various statistical software packages. It provides information on:
- Open source packages like R and SciPy which are free to use.
- Public domain packages such as CSPro and Epi Info which are developed by government organizations for use in fields like epidemiology.
- Freeware packages like WinBUGS and Winpepi that can be downloaded and used at no cost.
- Proprietary packages including SAS, SPSS, and MATLAB that usually require purchasing a license but provide comprehensive statistical functionality.
Commonly used statistical software in pharmacy include SAS, SPSS, GraphPad InStat, and GraphPad Prism. SPSS allows for a range of descriptive, bivariate
Statistical Package for Social Science (SPSS)sspink
This presentation includes the introduction of SPSS is basic features of Spss, how to input data manually, descriptive statistics and how to perform t-test, Anova and Chi-Square.
Parametric and non parametric test in biostatistics Mero Eye
This ppt will helpful for optometrist where and when to use biostatistic formula along with different examples
- it contains all test on parametric or non-parametric test
01 parametric and non parametric statisticsVasant Kothari
Definition of Parametric and Non-parametric Statistics
Assumptions of Parametric and Non-parametric Statistics
Assumptions of Parametric Statistics
Assumptions of Non-parametric Statistics
Advantages of Non-parametric Statistics
Disadvantages of Non-parametric Statistical Tests
Parametric Statistical Tests for Different Samples
Parametric Statistical Measures for Calculating the Difference Between Means
Significance of Difference Between the Means of Two Independent Large and
Small Samples
Significance of the Difference Between the Means of Two Dependent Samples
Significance of the Difference Between the Means of Three or More Samples
Parametric Statistics Measures Related to Pearson’s ‘r’
Non-parametric Tests Used for Inference
Today’s overwhelming number of techniques applicable to data analysis makes it extremely difficult to define the most beneficial approach while considering all the significant variables.
The analysis of variance has been studied from several approaches, the most common of which uses a linear model that relates the response to the treatments and blocks. Note that the model is linear in parameters but may be nonlinear across factor levels. Interpretation is easy when data is balanced across factors but much deeper understanding is needed for unbalanced data.
Analysis of variance (ANOVA) is a collection of statistical models and their associated estimation procedures (such as the "variation" among and between groups) used to analyze the differences among means. ANOVA was developed by the statistician Ronald Fisher. ANOVA is based on the law of total variance, where the observed variance in a particular variable is partitioned into components attributable to different sources of variation. In its simplest form, ANOVA provides a statistical test of whether two or more population means are equal, and therefore generalizes the t-test beyond two means. In other words, the ANOVA is used to test the difference between two or more means.Analysis of variance (ANOVA) is an analysis tool used in statistics that splits an observed aggregate variability found inside a data set into two parts: systematic factors and random factors. The systematic factors have a statistical influence on the given data set, while the random factors do not. Analysts use the ANOVA test to determine the influence that independent variables have on the dependent variable in a regression study.
Sir Ronald Fisher pioneered the development of ANOVA for analyzing results of agricultural experiments.1 Today, ANOVA is included in almost every statistical package, which makes it accessible to investigators in all experimental sciences. It is easy to input a data set and run a simple ANOVA, but it is challenging to choose the appropriate ANOVA for different experimental designs, to examine whether data adhere to the modeling assumptions, and to interpret the results correctly. The purpose of this report, together with the next 2 articles in the Statistical Primer for Cardiovascular Research series, is to enhance understanding of ANVOA and to promote its successful use in experimental cardiovascular research. My colleagues and I attempt to accomplish those goals through examples and explanation, while keeping within reason the burden of notation, technical jargon, and mathematical equations.
This ppt includes basic concepts about data types, levels of measurements. It also explains which descriptive measure, graph and tests should be used for different types of data. A brief of Pivot tables and charts is also included.
This is a very basic guide to SPSS. It is aimed at total novices wishing to understand the basic layout of the package and how to generate some simple tables and graphs
SoftwareforDataAnalysisinSPSSOnoverview1.docxAyyanar k
This study deals with the most important aspects of software in SPSS stands for "Statistical Package for the Social Sciences". It's a very powerful program that can do all of the statistics that you are ever likely to want to use. When it comes to giving you statistical results, it will give you what you want - as well as a lot of extra stuff that you may not need! The secret to using SPSS is to take it one small step at a time. This paper discusses the objectives of SPSS,Statistics included in the base software, How to use of SPSS, Feature of SPSS and Statistics Application for Software and IBM SPSSstatistics.
What is The Importance of SPSS How Will I Get SPSS help online in Australia.pdfWilliamJhons
SPSS is commonly used by survey companies, market researchers, education researchers, government agencies, marketing corporations, and data miners to
handle and comprehensively analyze survey data.
This program can be used to collect and analyze survey data from a variety of
sources.
To get the most out of their research endeavors, the greatest research
organizations use SPSS for data analysis and data mining.
If you are a student who is experiencing problems using SPSS to perform
statistical analysis, you can always seek SPSS help online.
Visit to the website for more information
https://www.myassignmentservices.com/spss-assignment-help.html
SPSS Statistics 17 completes the core programmability building blocks begun in SPSS 14. This presentation reviews the benefits and technology of programmability and shows four examples.
Introduction to AI for Nonprofits with Tapp NetworkTechSoup
Dive into the world of AI! Experts Jon Hill and Tareq Monaur will guide you through AI's role in enhancing nonprofit websites and basic marketing strategies, making it easy to understand and apply.
Exploiting Artificial Intelligence for Empowering Researchers and Faculty, In...Dr. Vinod Kumar Kanvaria
Exploiting Artificial Intelligence for Empowering Researchers and Faculty,
International FDP on Fundamentals of Research in Social Sciences
at Integral University, Lucknow, 06.06.2024
By Dr. Vinod Kumar Kanvaria
How to Make a Field invisible in Odoo 17Celine George
It is possible to hide or invisible some fields in odoo. Commonly using “invisible” attribute in the field definition to invisible the fields. This slide will show how to make a field invisible in odoo 17.
Francesca Gottschalk - How can education support child empowerment.pptxEduSkills OECD
Francesca Gottschalk from the OECD’s Centre for Educational Research and Innovation presents at the Ask an Expert Webinar: How can education support child empowerment?
Normal Labour/ Stages of Labour/ Mechanism of LabourWasim Ak
Normal labor is also termed spontaneous labor, defined as the natural physiological process through which the fetus, placenta, and membranes are expelled from the uterus through the birth canal at term (37 to 42 weeks
June 3, 2024 Anti-Semitism Letter Sent to MIT President Kornbluth and MIT Cor...Levi Shapiro
Letter from the Congress of the United States regarding Anti-Semitism sent June 3rd to MIT President Sally Kornbluth, MIT Corp Chair, Mark Gorenberg
Dear Dr. Kornbluth and Mr. Gorenberg,
The US House of Representatives is deeply concerned by ongoing and pervasive acts of antisemitic
harassment and intimidation at the Massachusetts Institute of Technology (MIT). Failing to act decisively to ensure a safe learning environment for all students would be a grave dereliction of your responsibilities as President of MIT and Chair of the MIT Corporation.
This Congress will not stand idly by and allow an environment hostile to Jewish students to persist. The House believes that your institution is in violation of Title VI of the Civil Rights Act, and the inability or
unwillingness to rectify this violation through action requires accountability.
Postsecondary education is a unique opportunity for students to learn and have their ideas and beliefs challenged. However, universities receiving hundreds of millions of federal funds annually have denied
students that opportunity and have been hijacked to become venues for the promotion of terrorism, antisemitic harassment and intimidation, unlawful encampments, and in some cases, assaults and riots.
The House of Representatives will not countenance the use of federal funds to indoctrinate students into hateful, antisemitic, anti-American supporters of terrorism. Investigations into campus antisemitism by the Committee on Education and the Workforce and the Committee on Ways and Means have been expanded into a Congress-wide probe across all relevant jurisdictions to address this national crisis. The undersigned Committees will conduct oversight into the use of federal funds at MIT and its learning environment under authorities granted to each Committee.
• The Committee on Education and the Workforce has been investigating your institution since December 7, 2023. The Committee has broad jurisdiction over postsecondary education, including its compliance with Title VI of the Civil Rights Act, campus safety concerns over disruptions to the learning environment, and the awarding of federal student aid under the Higher Education Act.
• The Committee on Oversight and Accountability is investigating the sources of funding and other support flowing to groups espousing pro-Hamas propaganda and engaged in antisemitic harassment and intimidation of students. The Committee on Oversight and Accountability is the principal oversight committee of the US House of Representatives and has broad authority to investigate “any matter” at “any time” under House Rule X.
• The Committee on Ways and Means has been investigating several universities since November 15, 2023, when the Committee held a hearing entitled From Ivory Towers to Dark Corners: Investigating the Nexus Between Antisemitism, Tax-Exempt Universities, and Terror Financing. The Committee followed the hearing with letters to those institutions on January 10, 202
Safalta Digital marketing institute in Noida, provide complete applications that encompass a huge range of virtual advertising and marketing additives, which includes search engine optimization, virtual communication advertising, pay-per-click on marketing, content material advertising, internet analytics, and greater. These university courses are designed for students who possess a comprehensive understanding of virtual marketing strategies and attributes.Safalta Digital Marketing Institute in Noida is a first choice for young individuals or students who are looking to start their careers in the field of digital advertising. The institute gives specialized courses designed and certification.
for beginners, providing thorough training in areas such as SEO, digital communication marketing, and PPC training in Noida. After finishing the program, students receive the certifications recognised by top different universitie, setting a strong foundation for a successful career in digital marketing.
Synthetic Fiber Construction in lab .pptxPavel ( NSTU)
Synthetic fiber production is a fascinating and complex field that blends chemistry, engineering, and environmental science. By understanding these aspects, students can gain a comprehensive view of synthetic fiber production, its impact on society and the environment, and the potential for future innovations. Synthetic fibers play a crucial role in modern society, impacting various aspects of daily life, industry, and the environment. ynthetic fibers are integral to modern life, offering a range of benefits from cost-effectiveness and versatility to innovative applications and performance characteristics. While they pose environmental challenges, ongoing research and development aim to create more sustainable and eco-friendly alternatives. Understanding the importance of synthetic fibers helps in appreciating their role in the economy, industry, and daily life, while also emphasizing the need for sustainable practices and innovation.
The French Revolution, which began in 1789, was a period of radical social and political upheaval in France. It marked the decline of absolute monarchies, the rise of secular and democratic republics, and the eventual rise of Napoleon Bonaparte. This revolutionary period is crucial in understanding the transition from feudalism to modernity in Europe.
For more information, visit-www.vavaclasses.com
Digital Tools and AI for Teaching Learning and Research
Statistical software
1. Statistical software
Dr. S. Parasuraman M.Pharm., Ph.D.,
Senior Lecturer, Faculty of Pharmacy,
AIMST University,
Bedong 08100, Malaysia.
2. Statistical software
• Statistical software are specialized computer
programs for statistical analysis.
– Open source statistical packages
– Public domain statistical packages
– Freeware statistical packages
– Proprietary statistical packages
3. Statistical software
• Open source statistical packages
– ADMB : a software for non-linear statistical modeling
based on C++
– DAP : A free replacement for SAS
– Fityk : nonlinear regression software
– OpenEpi : A web-based, open source, operating-
independent series of programs for use in epidemiology
and statistics
– SciPy (statsmodels) : regression, plotting, example
datasets, GLM, time series analysis, Non-parametric
statistics, ANOVA
– PSPP : A free software alternative to IBM SPSS Statistics
– R : A free implementation of the S language
4. Statistical software
• Public domain statistical packages
– CSPro
• Developed by US census bureau and ICF International
• Used for entering, editing, tabulating, mapping and disseminating
census and survey data.
– Epi Info
• public domain statistical software for epidemiology developed by
Centers for Disease Control and Prevention (CDC) in Atlanta, Georgia
(USA).
• The program allows for electronic survey creation, data entry, and
analysis. Within the analysis module, analytic routines include t-tests,
ANOVA, nonparametric statistics, cross tabulations and stratification
with estimates of odds ratios, risk ratios, and risk differences, logistic
regression (conditional and unconditional), survival analysis (Kaplan
Meier and Cox proportional hazard), and analysis of complex survey
data.
– X-12-ARIMA
• Developed by U.S. Census Bureau's software package for seasonal
adjustment.
5. Statistical software
• Freeware statistical packages
– WinBUGS : Bayesian analysis using Markov chain Monte
Carlo methods
– Winpepi : package of statistical programs for
epidemiologists
6. Statistical software
• Proprietary statistical packages
– GraphPad InStat : Very simple with lots of guidance and
explanations
– GraphPad Prism : Biostatistics and nonlinear regression
with clear explanations
– IBM SPSS Statistics : comprehensive statistics package
– IBM SPSS Modeler : comprehensive data mining and text
analytics workbench
– MATLAB : programming language with statistical features
– SAS : comprehensive statistical package
– SPSS -: Statistical Package for the Social Sciences
– StatsDirect : statistics package designed for biomedical,
public health and general health science uses
7. Statistical software
Microsoft Excel add-ons
• Analyse-it : add-on to Microsoft Excel for statistical
analysis
• NumXL : add-on to Microsoft Excel for general statistics
and Econometrics
• RegressIt : add-on to Microsoft Excel for multivariate
data analysis and linear regression (freeware)
• SigmaXL : add-on to Microsoft Excel for statistical and
graphical analysis
• SPC XL : add-on to Microsoft Excel for general statistics
• Stats Helper : add-on to Microsoft Excel for descriptive
statistics and Six Sigma
8. Statistical software
• Most commonly used software in the field of
Pharmacy
– SAS
– SPSS
– GraphPad InStat
– GraphPad Prism
9. Statistical software - SPSS
• SPSS: Statistical Package for the Social Sciences
• Current version: IBM SPSS statistics (2016); latest version 24
• Methods:
– Descriptive statistics: Cross tabulation, Frequencies,
Descriptives, Explore, Descriptive Ratio Statistics
– Bivariate statistics: Means, t-test, ANOVA, Correlation
(bivariate, partial, distances), Nonparametric tests
– Prediction for numerical outcomes: Linear regression
– Prediction for identifying groups: Factor analysis, cluster
analysis (two-step, K-means, hierarchical), Discriminant
• SPSS statistics desktop platforms:
– Linux, Mac OS, Windows
13. Statistical software –
SAS (Statistical Analysis System)
• Developed by: North Carolina State University in 1966
• SAS provides a graphical point-and-click user interface for non-
technical users and more advanced options through the SAS
programming language.
• The DATA step has two phases, compilation and execution.
• The SAS software suite has more than 200 components, including
• Base SAS - Basic procedures and data management
• SAS/STAT - Statistical analysis
• SAS/GRAPH - Graphics and presentation
• SAS/OR - Operations research
• SAS/ETS - Econometrics and Time Series Analysis
• SAS/QC - Quality control SAS/INSIGHT - Data mining
• SAS/PH - Clinical trial analysis
21. Parametric vs. non-parametric tests
Parametric Non-parametric
Assumed distribution Normal Any
Assumed variance Homogeneous Any
Typical data Ratio or Interval Ordinal or Nominal
Data set relationships Independent Any
Usual central measure Mean Median
Benefits Can draw more conclusions Simplicity; Less affected by outliers
Tests
Choosing Choosing parametric test Choosing a non-parametric test
Correlation test Pearson Spearman
Independent measures, 2 groups Independent-measures t-test Mann-Whitney test
Independent measures, >2 groups
One-way, independent-
measures ANOVA
Kruskal-Wallis test
Repeated measures, 2 conditions Matched-pair t-test Wilcoxon test
Repeated measures, >2 conditions
One-way, repeated measures
ANOVA
Friedman's test
Source: http://changingminds.org/explanations/research/analysis/parametric_non-parametric.htm
22. software for parametric analysis
• GraphPad InStat (not having analytical futures for
analysis of Two-way ANOVA)
• GraphPad Prism
• IBM SPSS Statistics
• SAS
• StatsDirect
• MATLAB
23. software for non-parametric analysis
• GraphPad InStat
• GraphPad Prism
• IBM SPSS Statistics
• SAS
• StatXact
• SURVSOFT
• R Software
24. software for non-parametric analysis
• Models: descriptive statistics, statistical models,
inference and statistical tests.
• Methods:
– Kruskal-Wallis one-way analysis of variance
– Mann–Whitney U
– Siegel–Tukey test
– Spearman's rank correlation coefficient
– Wilcoxon signed-rank test
– Kaplan–Meier
– Friedman two-way analysis of variance
– McNemar's test
– sign test
25. Kruskal-Wallis one-way analysis of variance
• It is used when data have a ranking but no clear numerical
interpretation, such as when assessing preferences. In terms of
levels of measurement, non-parametric methods result in "ordinal"
data.
• The Kruskal–Wallis one-way analysis of variance by ranks is a non-
parametric method for testing whether samples originate from the
same distribution.
• It is an extension of the Mann–Whitney U test to 3 or more
groups.
• The Kruskal–Wallis test does not assume a normal distribution of
the residuals, unlike the analogous one-way analysis of variance.
• Kruskal–Wallis is also used when the examined groups are of
unequal size (different number of participants).