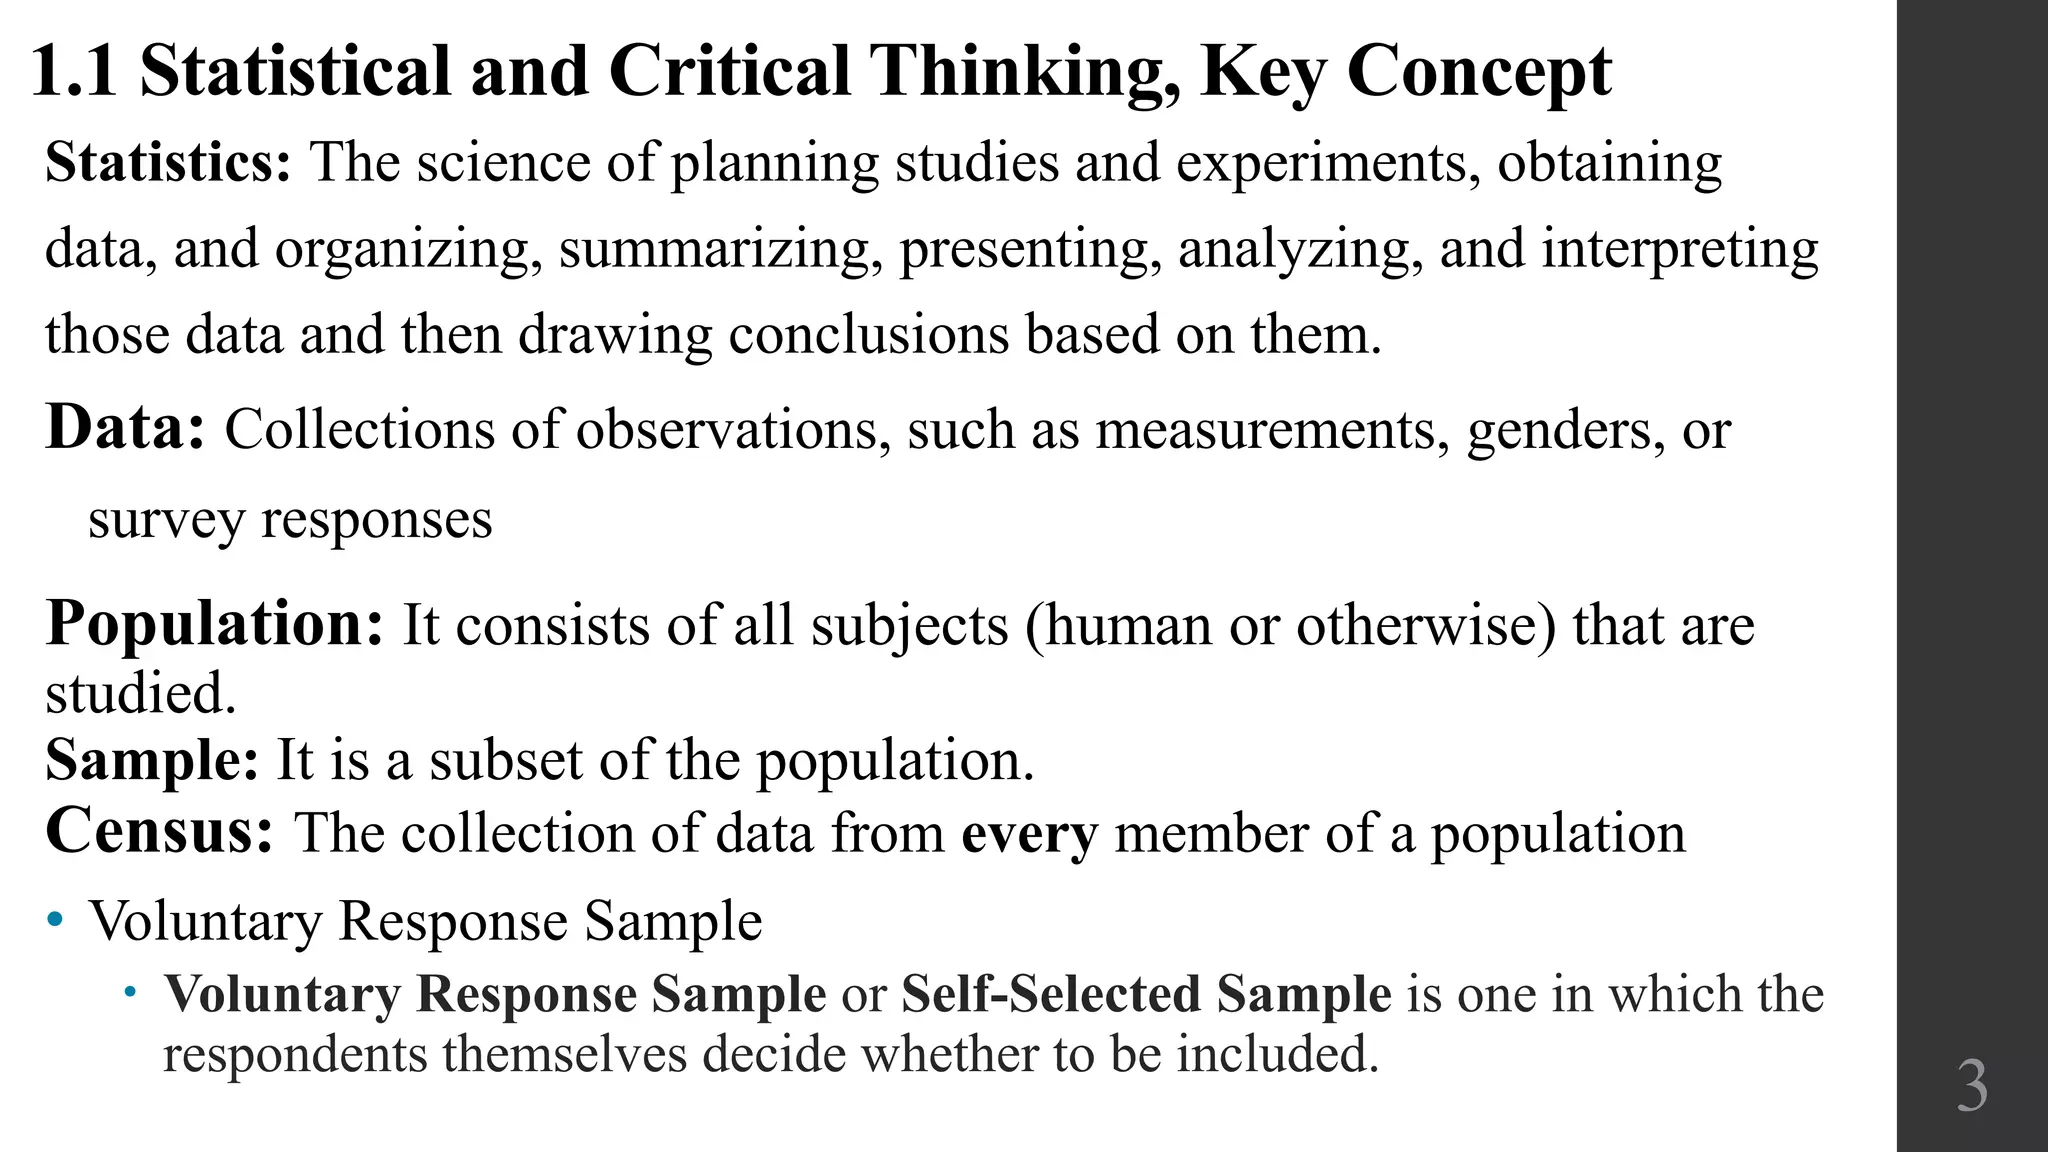
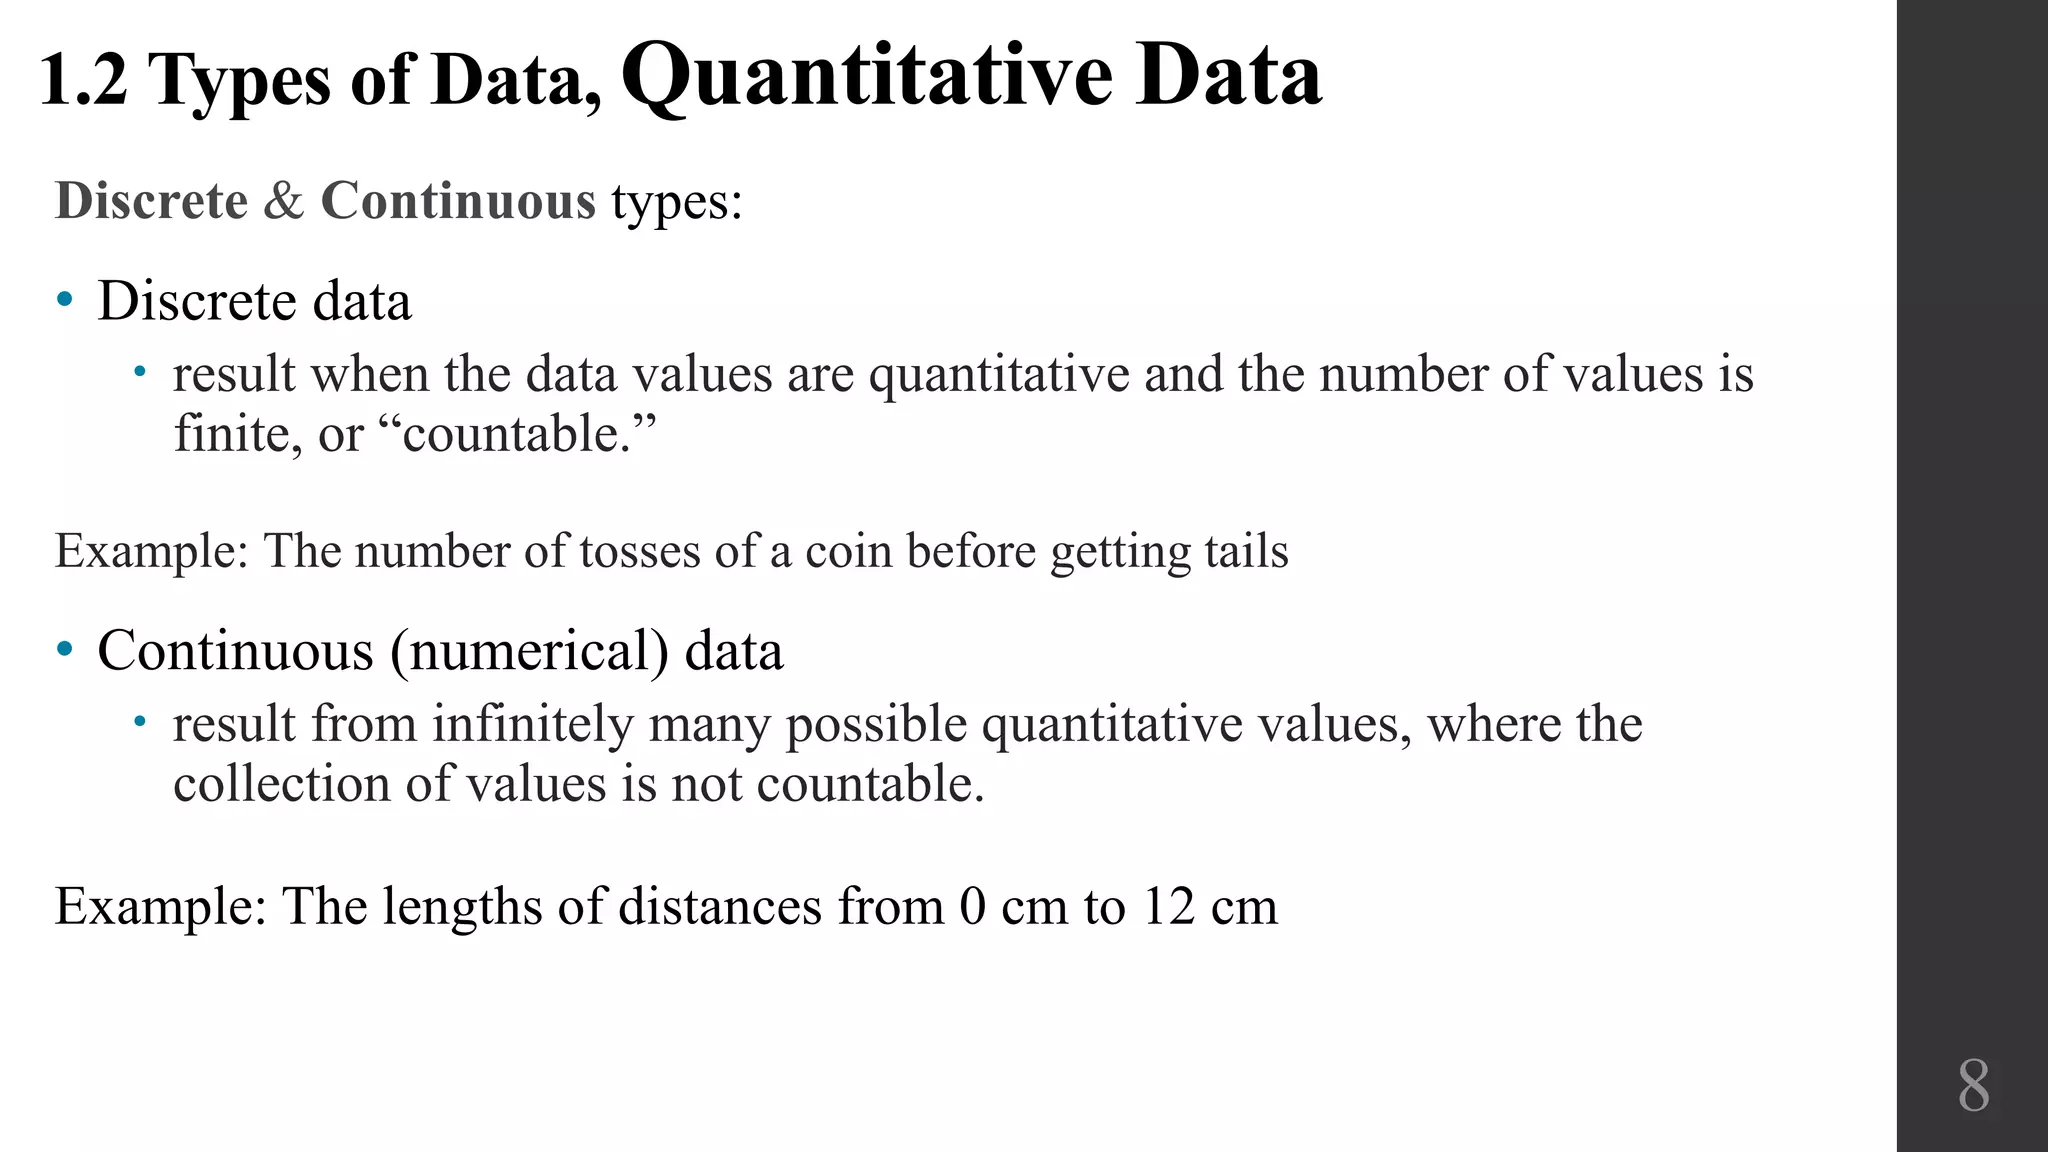
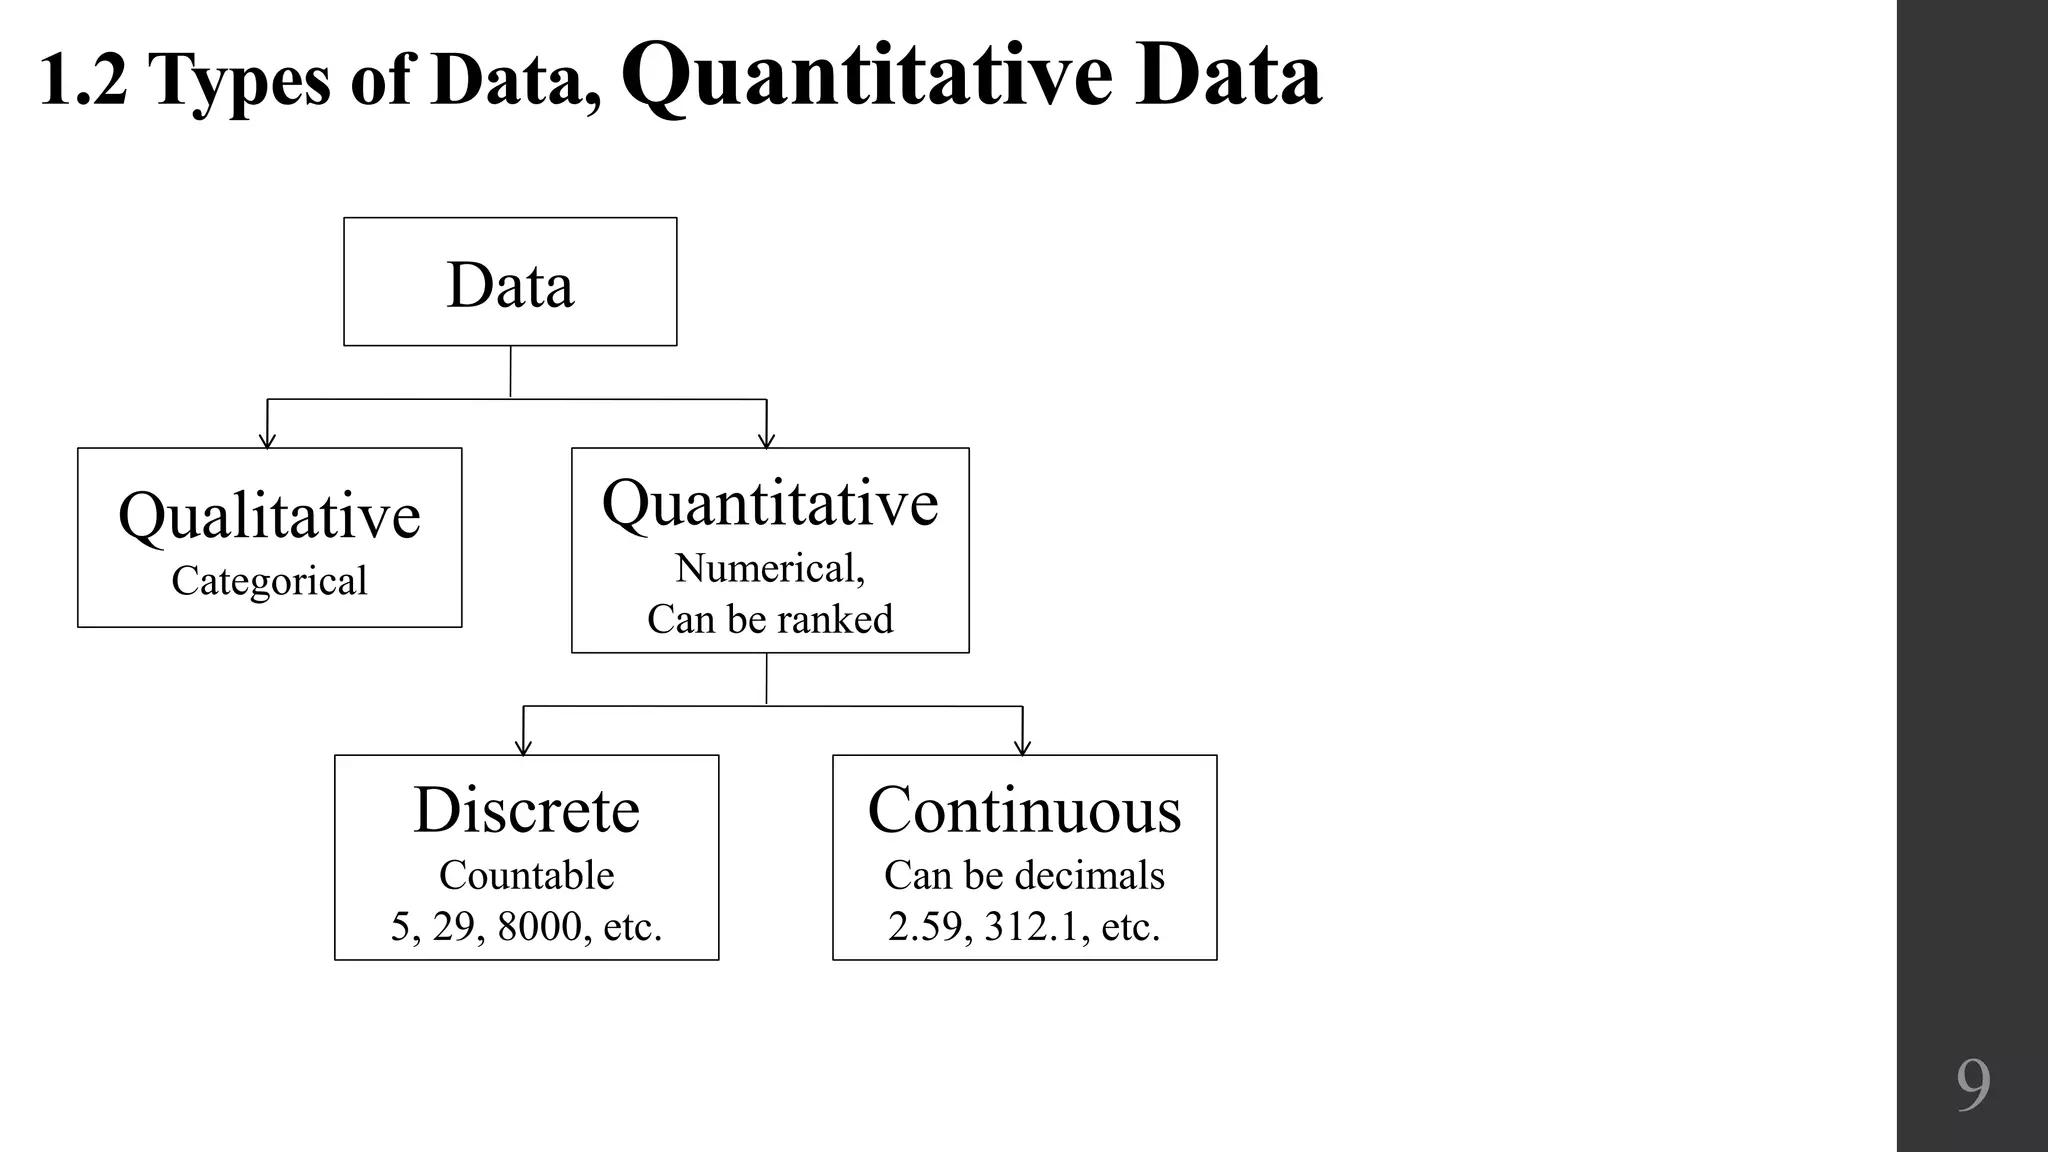
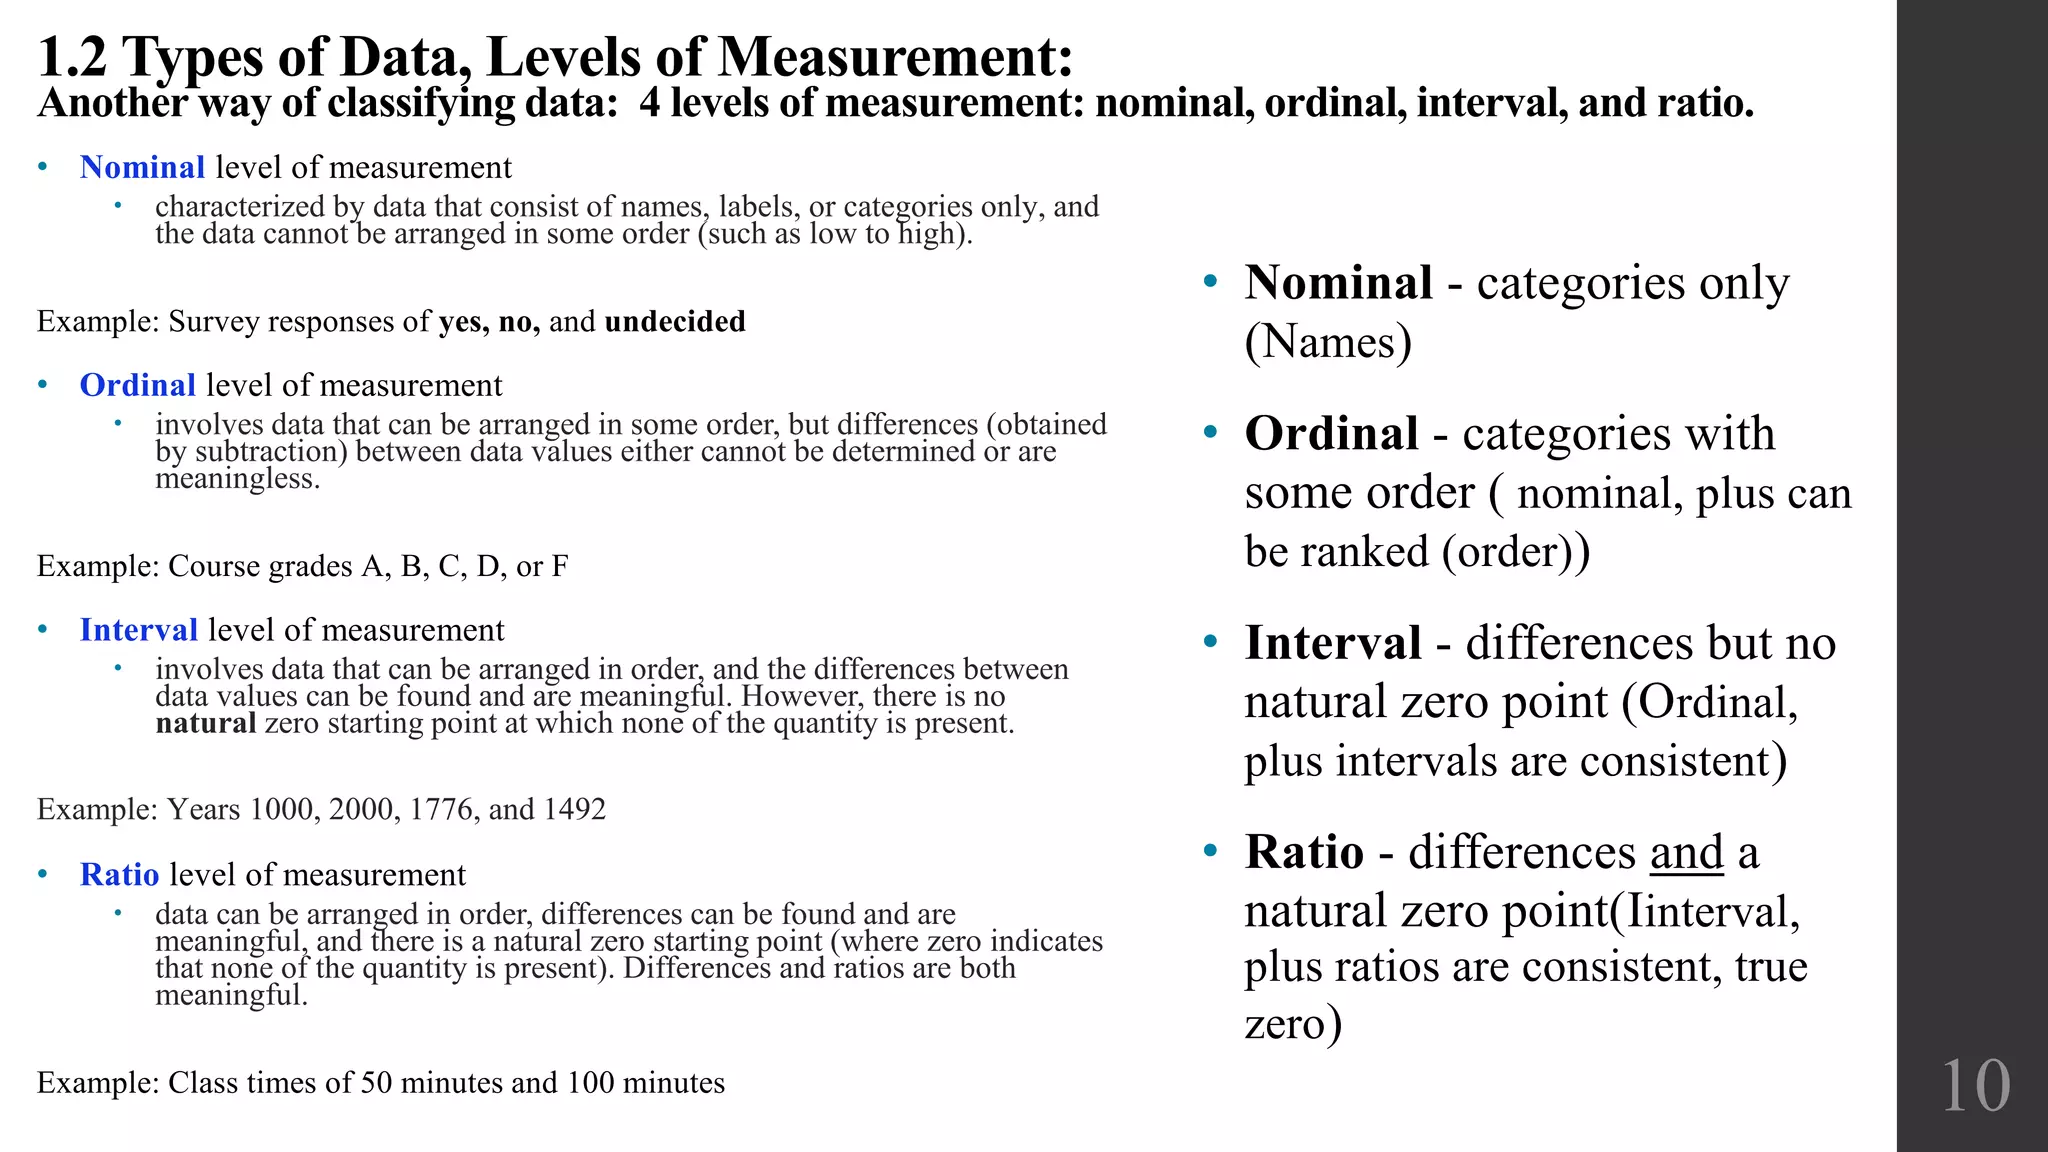
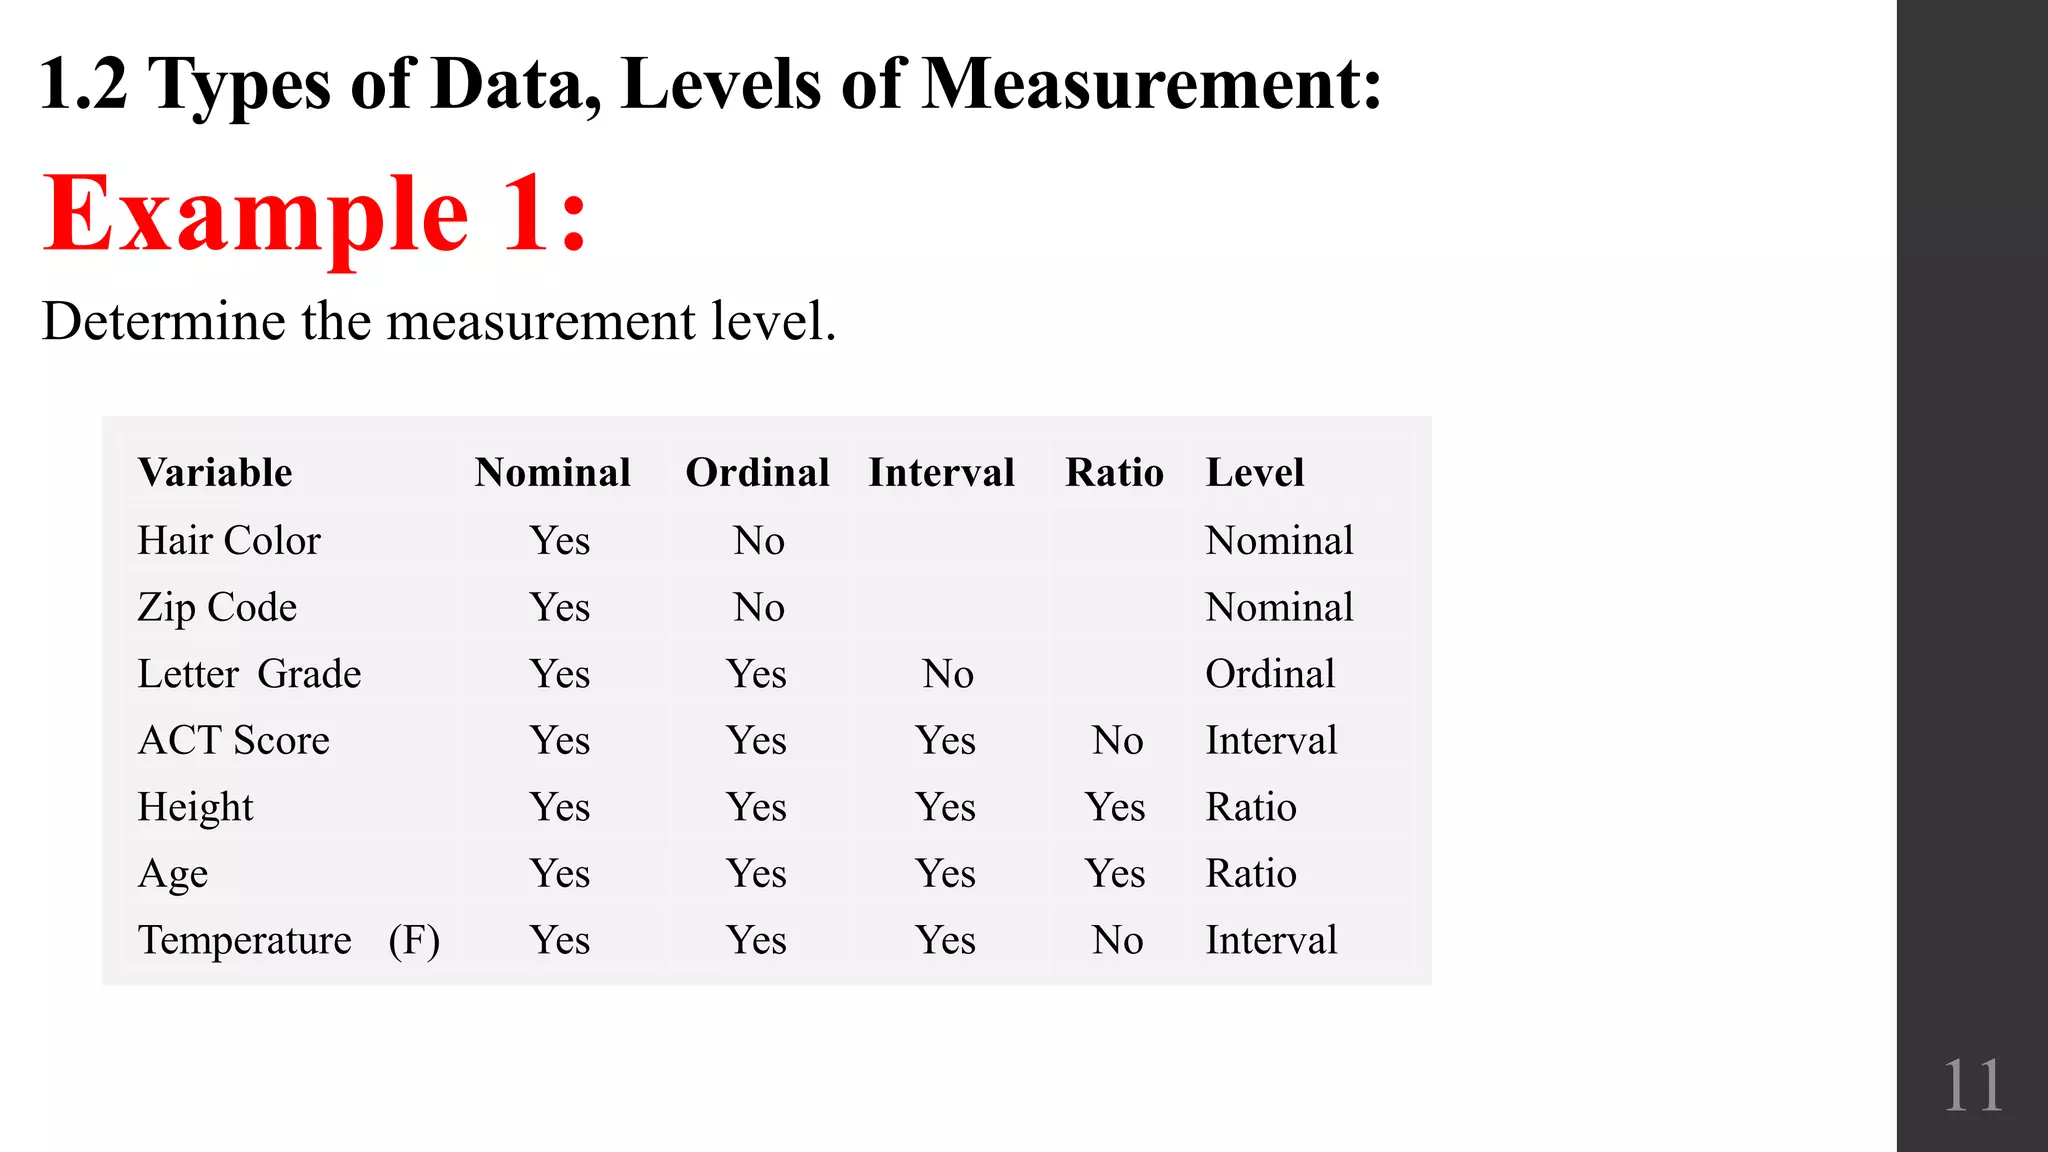
Elementary Statistics
Chapter 1:
Introduction to
Statistics
1.2 Types of Data
1
Chapter 1:
Introduction to Statistics
1.1 Statistical and Critical Thinking
1.2 Types of Data
1.3 Collecting Sample Data
2
Population: It consists of all subjects (human or otherwise) that are
studied.
Sample: It is a subset of the population.
Census: The collection of data from every member of a population
3
1.1 Statistical and Critical Thinking, Key Concept
• Voluntary Response Sample
 Voluntary Response Sample or Self-Selected Sample is one in which the
respondents themselves decide whether to be included.
Statistics: The science of planning studies and experiments, obtaining
data, and organizing, summarizing, presenting, analyzing, and interpreting
those data and then drawing conclusions based on them.
Data: Collections of observations, such as measurements, genders, or
survey responses
The final step in our statistical process involves conclusions, and we should develop an
ability to distinguish between statistical significance and practical significance.
• Statistical Significance
 Statistical significance is achieved in a study if the likelihood of an event occurring
by chance is 5% or less.
 Getting 98 girls in 100 random births is statistically significant because such an
extreme outcome is not likely to result from random chance.
 Getting 52 girls in 100 births is not statistically significant because that event could
easily occur with random chance.
4
1.1 Statistical and Critical Thinking, Conclude
• Practical Significance
 It is possible that some treatment or finding is effective, but common sense might
suggest that the treatment or finding does not make enough of a difference to justify
its use or to be practical.
• Misleading Conclusions
 When forming a conclusion based on a statistical analysis, we should make statements that are clear
even to those who have no understanding of statistics and its terminology.
• Sample Data Reported Instead of Measured
 When collecting data from people, it is better to take measurements yourself instead of asking
subjects to report results.
• Loaded Questions
 If survey results are not worded carefully, the results of a study can be misleading.
• Order of Questions
 Sometimes survey questions are unintentionally loaded by the order of the items being considered.
• Nonresponse
 A nonresponse occurs when someone either refuses to respond or is unavailable.
• Percentages
 Some studies cite misleading percentages. Note that 100% of some quantity is all of it, but if there
are references made to percentages that exceed 100%, such references are often not justified.
5
1.1 Statistical and Critical Thinking
Analyzing Data: Potential Pitfalls
A major use of statistics is to collect and use sample data to make conclusions
about populations.
1.2 Types of Data, Key Concept
Parameter & Statistic
• Parameter
 a numerical measurement describing some
characteristic of a population
• Statistic
 a numerical measurement describing some
characteristic of a sample
6
Quantitative Data & Categorical Data
• Quantitative (or numerical) data
 consists of numbers representing counts or measurements.
Example: The weights of supermodels
Example: The ages of respondents
• Categorical (or qualitative or attribute) data
 consists of names or labels (not numbers that represent counts or measurements).
Example: The gender (male/female) of professional athletes
Example: Shirt numbers on professional athletes uniforms - substitutes for names
1.2 Types of Data
7
Discrete & Continuous types:
• Discrete data
 result when the data values are quantitative and the number of values is
finite, or “countable.”
Example: The number of tosses of a coin before getting tails
• Continuous (numerical) data
 result from infinitely many possible quantitative values, where the
collection of values is not countable.
Example: The lengths of distances from 0 cm to 12 cm
1.2 Types of Data, Quantitative Data
8
1.2 Types of Data, Quantitative Data
Data
Qualitative
Categorical
Quantitative
Numerical,
Can be ranked
Discrete
Countable
5, 29, 8000, etc.
Continuous
Can be decimals
2.59, 312.1, etc.
9
• Nominal level of measurement
 characterized by data that consist of names, labels, or categories only, and
the data cannot be arranged in some order (such as low to high).
Example: Survey responses of yes, no, and undecided
• Ordinal level of measurement
 involves data that can be arranged in some order, but differences (obtained
by subtraction) between data values either cannot be determined or are
meaningless.
Example: Course grades A, B, C, D, or F
• Interval level of measurement
 involves data that can be arranged in order, and the differences between
data values can be found and are meaningful. However, there is no
natural zero starting point at which none of the quantity is present.
Example: Years 1000, 2000, 1776, and 1492
• Ratio level of measurement
 data can be arranged in order, differences can be found and are
meaningful, and there is a natural zero starting point (where zero indicates
that none of the quantity is present). Differences and ratios are both
meaningful.
Example: Class times of 50 minutes and 100 minutes
1.2 Types of Data, Levels of Measurement:
Another way of classifying data: 4 levels of measurement: nominal, ordinal, interval, and ratio.
10
• Nominal - categories only
(Names)
• Ordinal - categories with
some order ( nominal, plus can
be ranked (order))
• Interval - differences but no
natural zero point (Ordinal,
plus intervals are consistent)
• Ratio - differences and a
natural zero point(Iinterval,
plus ratios are consistent, true
zero)
1.2 Types of Data, Levels of Measurement:
11
Example 1:
Determine the measurement level.
Variable Nominal Ordinal Interval Ratio Level
Hair Color Yes No Nominal
Zip Code Yes No Nominal
Letter Grade Yes Yes No Ordinal
ACT Score Yes Yes Yes No Interval
Height Yes Yes Yes Yes Ratio
Age Yes Yes Yes Yes Ratio
Temperature (F) Yes Yes Yes No Interval
12
Example 2:
13
Example 3:
Parameter or Statistic?
Statistic
Parameter
14
Example 4:
Discrete or Continuous?
Continuous
Discrete
15
Example 5:
Determine the measurement level.
Nominal
Ordinal
Interval
Ratio
16
Example 6:
Determine the measurement level & what’s wrong with the conclusion?

1.2 types of data

  • 1.
    Elementary Statistics Chapter 1: Introductionto Statistics 1.2 Types of Data 1
  • 2.
    Chapter 1: Introduction toStatistics 1.1 Statistical and Critical Thinking 1.2 Types of Data 1.3 Collecting Sample Data 2
  • 3.
    Population: It consistsof all subjects (human or otherwise) that are studied. Sample: It is a subset of the population. Census: The collection of data from every member of a population 3 1.1 Statistical and Critical Thinking, Key Concept • Voluntary Response Sample  Voluntary Response Sample or Self-Selected Sample is one in which the respondents themselves decide whether to be included. Statistics: The science of planning studies and experiments, obtaining data, and organizing, summarizing, presenting, analyzing, and interpreting those data and then drawing conclusions based on them. Data: Collections of observations, such as measurements, genders, or survey responses
  • 4.
    The final stepin our statistical process involves conclusions, and we should develop an ability to distinguish between statistical significance and practical significance. • Statistical Significance  Statistical significance is achieved in a study if the likelihood of an event occurring by chance is 5% or less.  Getting 98 girls in 100 random births is statistically significant because such an extreme outcome is not likely to result from random chance.  Getting 52 girls in 100 births is not statistically significant because that event could easily occur with random chance. 4 1.1 Statistical and Critical Thinking, Conclude • Practical Significance  It is possible that some treatment or finding is effective, but common sense might suggest that the treatment or finding does not make enough of a difference to justify its use or to be practical.
  • 5.
    • Misleading Conclusions When forming a conclusion based on a statistical analysis, we should make statements that are clear even to those who have no understanding of statistics and its terminology. • Sample Data Reported Instead of Measured  When collecting data from people, it is better to take measurements yourself instead of asking subjects to report results. • Loaded Questions  If survey results are not worded carefully, the results of a study can be misleading. • Order of Questions  Sometimes survey questions are unintentionally loaded by the order of the items being considered. • Nonresponse  A nonresponse occurs when someone either refuses to respond or is unavailable. • Percentages  Some studies cite misleading percentages. Note that 100% of some quantity is all of it, but if there are references made to percentages that exceed 100%, such references are often not justified. 5 1.1 Statistical and Critical Thinking Analyzing Data: Potential Pitfalls
  • 6.
    A major useof statistics is to collect and use sample data to make conclusions about populations. 1.2 Types of Data, Key Concept Parameter & Statistic • Parameter  a numerical measurement describing some characteristic of a population • Statistic  a numerical measurement describing some characteristic of a sample 6
  • 7.
    Quantitative Data &Categorical Data • Quantitative (or numerical) data  consists of numbers representing counts or measurements. Example: The weights of supermodels Example: The ages of respondents • Categorical (or qualitative or attribute) data  consists of names or labels (not numbers that represent counts or measurements). Example: The gender (male/female) of professional athletes Example: Shirt numbers on professional athletes uniforms - substitutes for names 1.2 Types of Data 7
  • 8.
    Discrete & Continuoustypes: • Discrete data  result when the data values are quantitative and the number of values is finite, or “countable.” Example: The number of tosses of a coin before getting tails • Continuous (numerical) data  result from infinitely many possible quantitative values, where the collection of values is not countable. Example: The lengths of distances from 0 cm to 12 cm 1.2 Types of Data, Quantitative Data 8
  • 9.
    1.2 Types ofData, Quantitative Data Data Qualitative Categorical Quantitative Numerical, Can be ranked Discrete Countable 5, 29, 8000, etc. Continuous Can be decimals 2.59, 312.1, etc. 9
  • 10.
    • Nominal levelof measurement  characterized by data that consist of names, labels, or categories only, and the data cannot be arranged in some order (such as low to high). Example: Survey responses of yes, no, and undecided • Ordinal level of measurement  involves data that can be arranged in some order, but differences (obtained by subtraction) between data values either cannot be determined or are meaningless. Example: Course grades A, B, C, D, or F • Interval level of measurement  involves data that can be arranged in order, and the differences between data values can be found and are meaningful. However, there is no natural zero starting point at which none of the quantity is present. Example: Years 1000, 2000, 1776, and 1492 • Ratio level of measurement  data can be arranged in order, differences can be found and are meaningful, and there is a natural zero starting point (where zero indicates that none of the quantity is present). Differences and ratios are both meaningful. Example: Class times of 50 minutes and 100 minutes 1.2 Types of Data, Levels of Measurement: Another way of classifying data: 4 levels of measurement: nominal, ordinal, interval, and ratio. 10 • Nominal - categories only (Names) • Ordinal - categories with some order ( nominal, plus can be ranked (order)) • Interval - differences but no natural zero point (Ordinal, plus intervals are consistent) • Ratio - differences and a natural zero point(Iinterval, plus ratios are consistent, true zero)
  • 11.
    1.2 Types ofData, Levels of Measurement: 11 Example 1: Determine the measurement level. Variable Nominal Ordinal Interval Ratio Level Hair Color Yes No Nominal Zip Code Yes No Nominal Letter Grade Yes Yes No Ordinal ACT Score Yes Yes Yes No Interval Height Yes Yes Yes Yes Ratio Age Yes Yes Yes Yes Ratio Temperature (F) Yes Yes Yes No Interval
  • 12.
  • 13.
    13 Example 3: Parameter orStatistic? Statistic Parameter
  • 14.
    14 Example 4: Discrete orContinuous? Continuous Discrete
  • 15.
    15 Example 5: Determine themeasurement level. Nominal Ordinal Interval Ratio
  • 16.
    16 Example 6: Determine themeasurement level & what’s wrong with the conclusion?