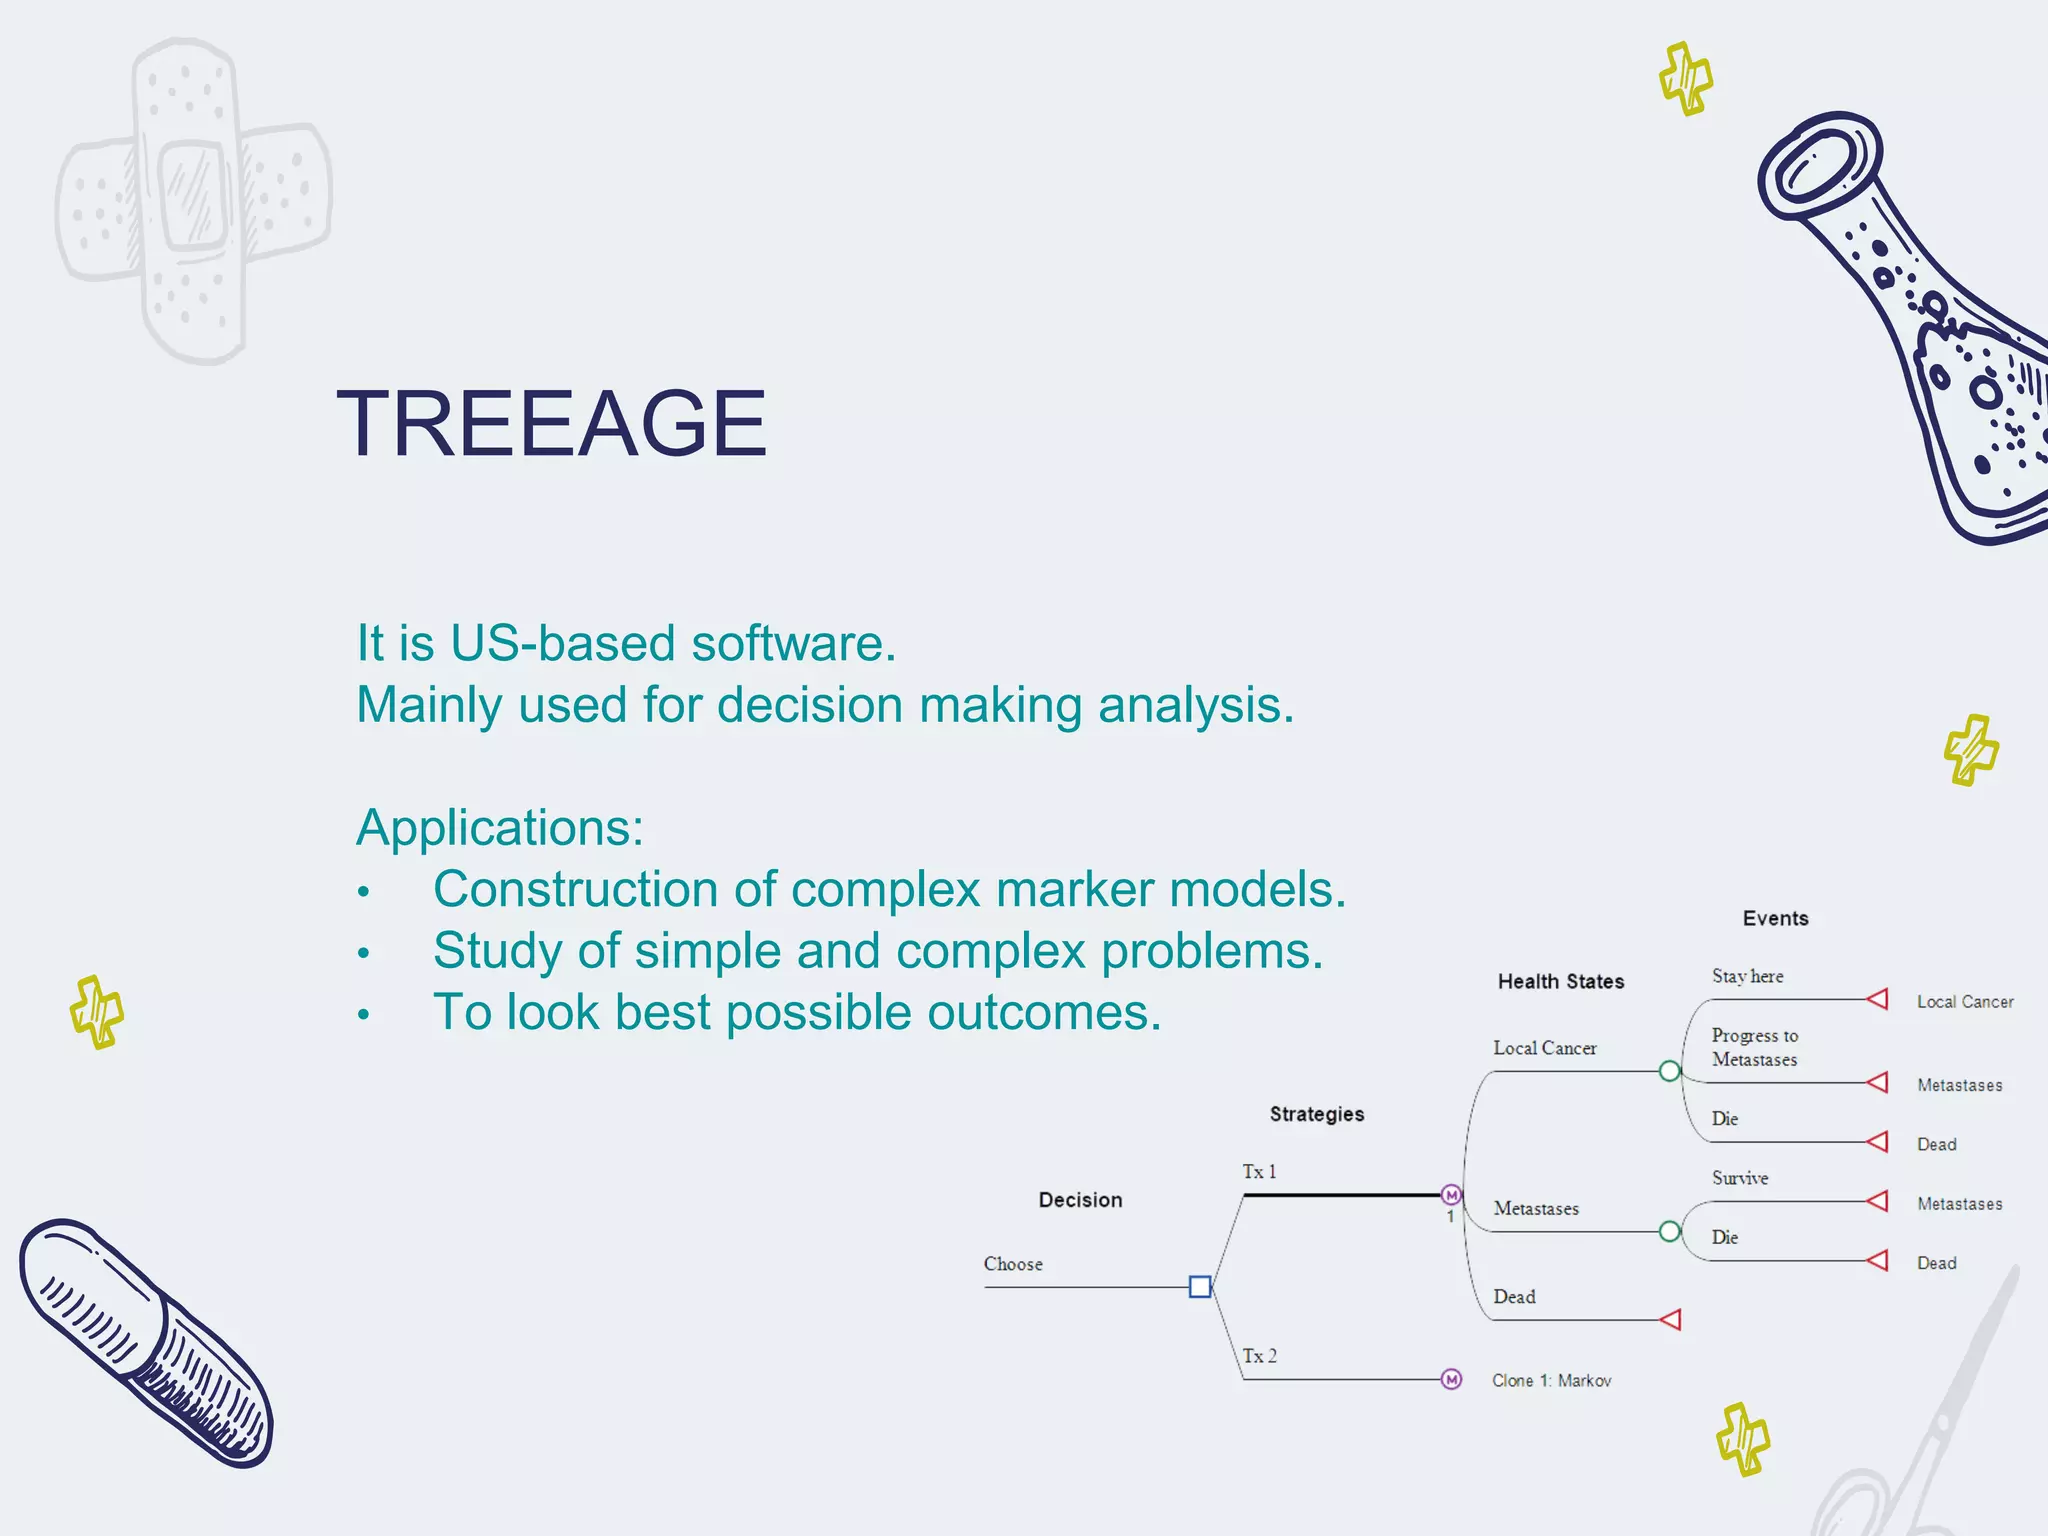
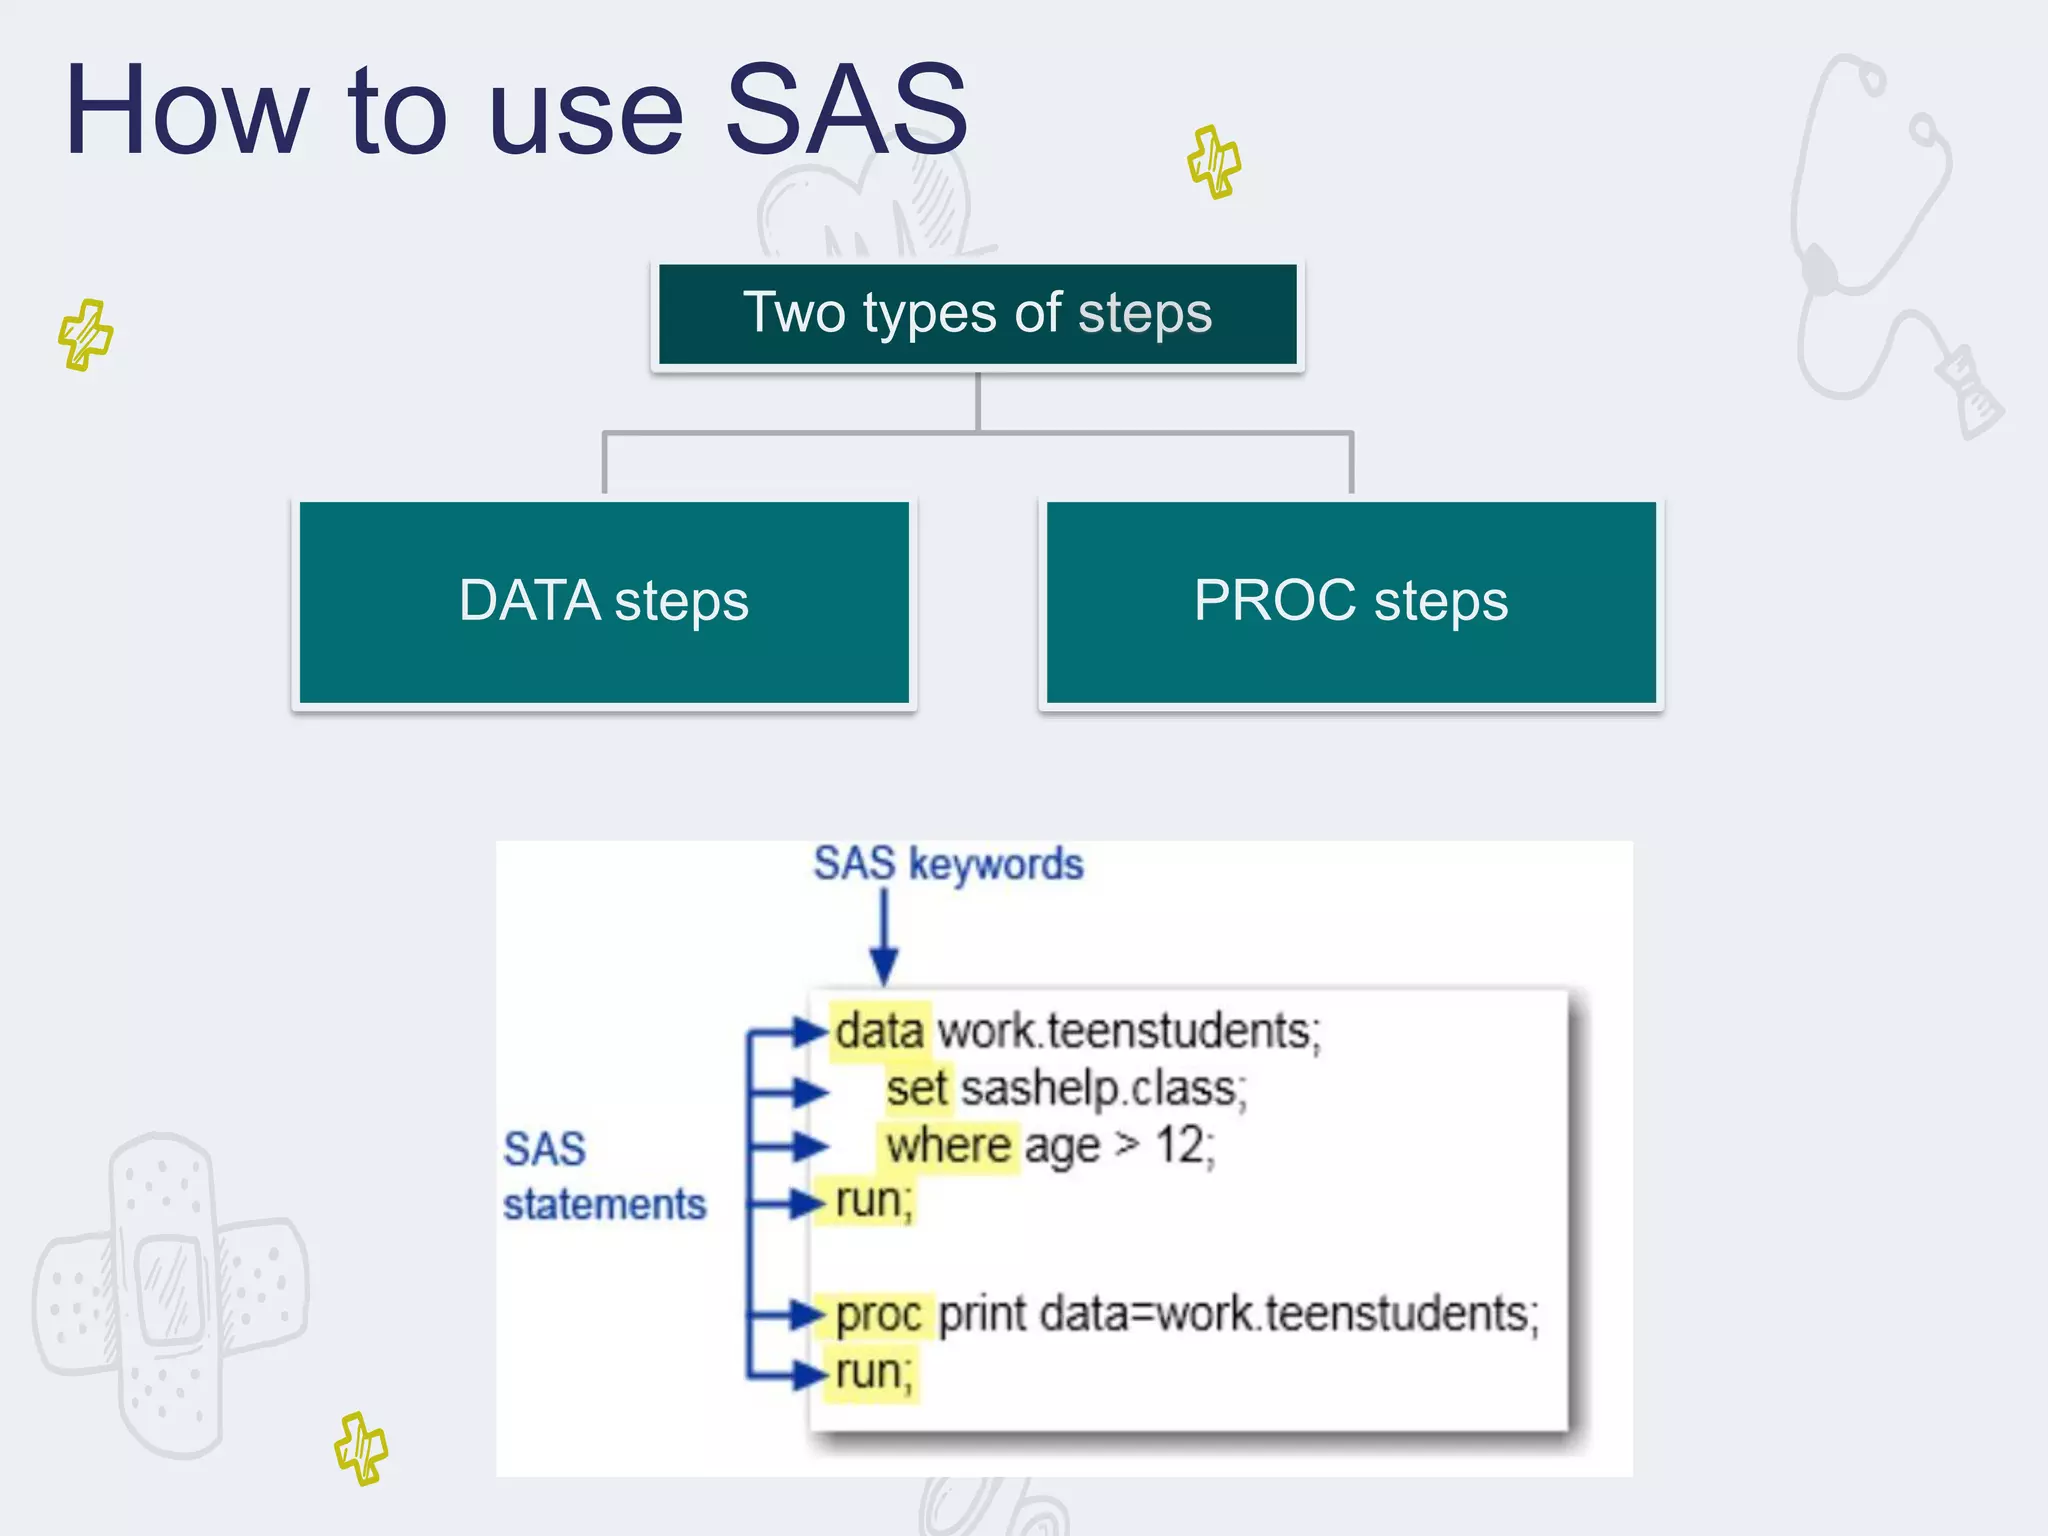
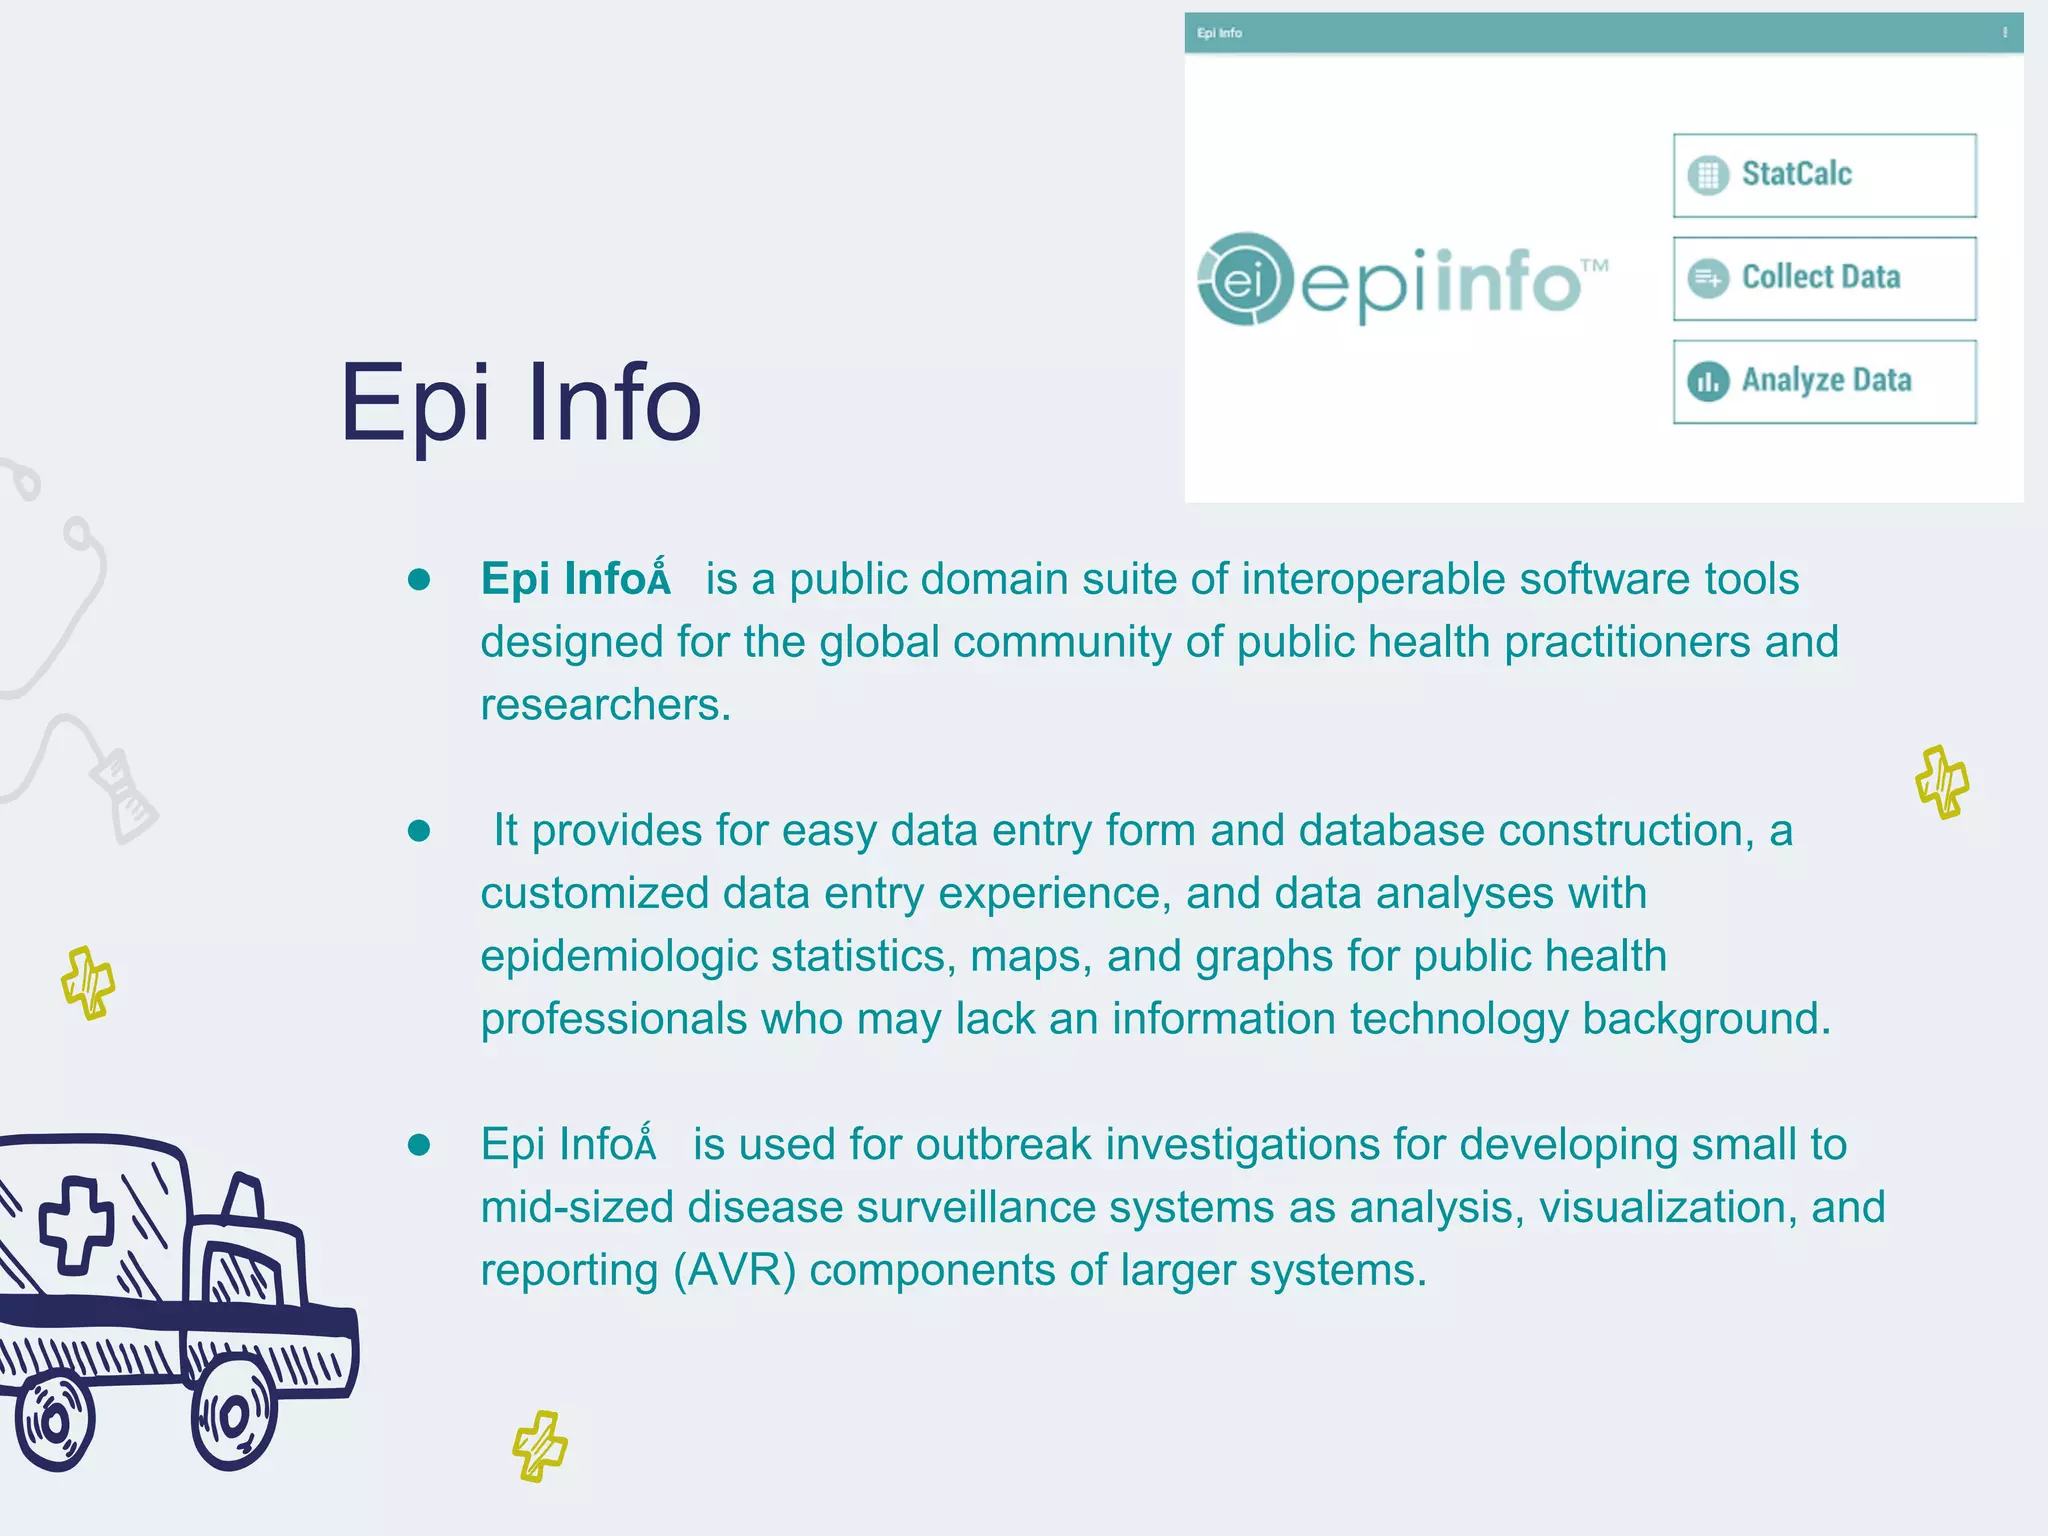
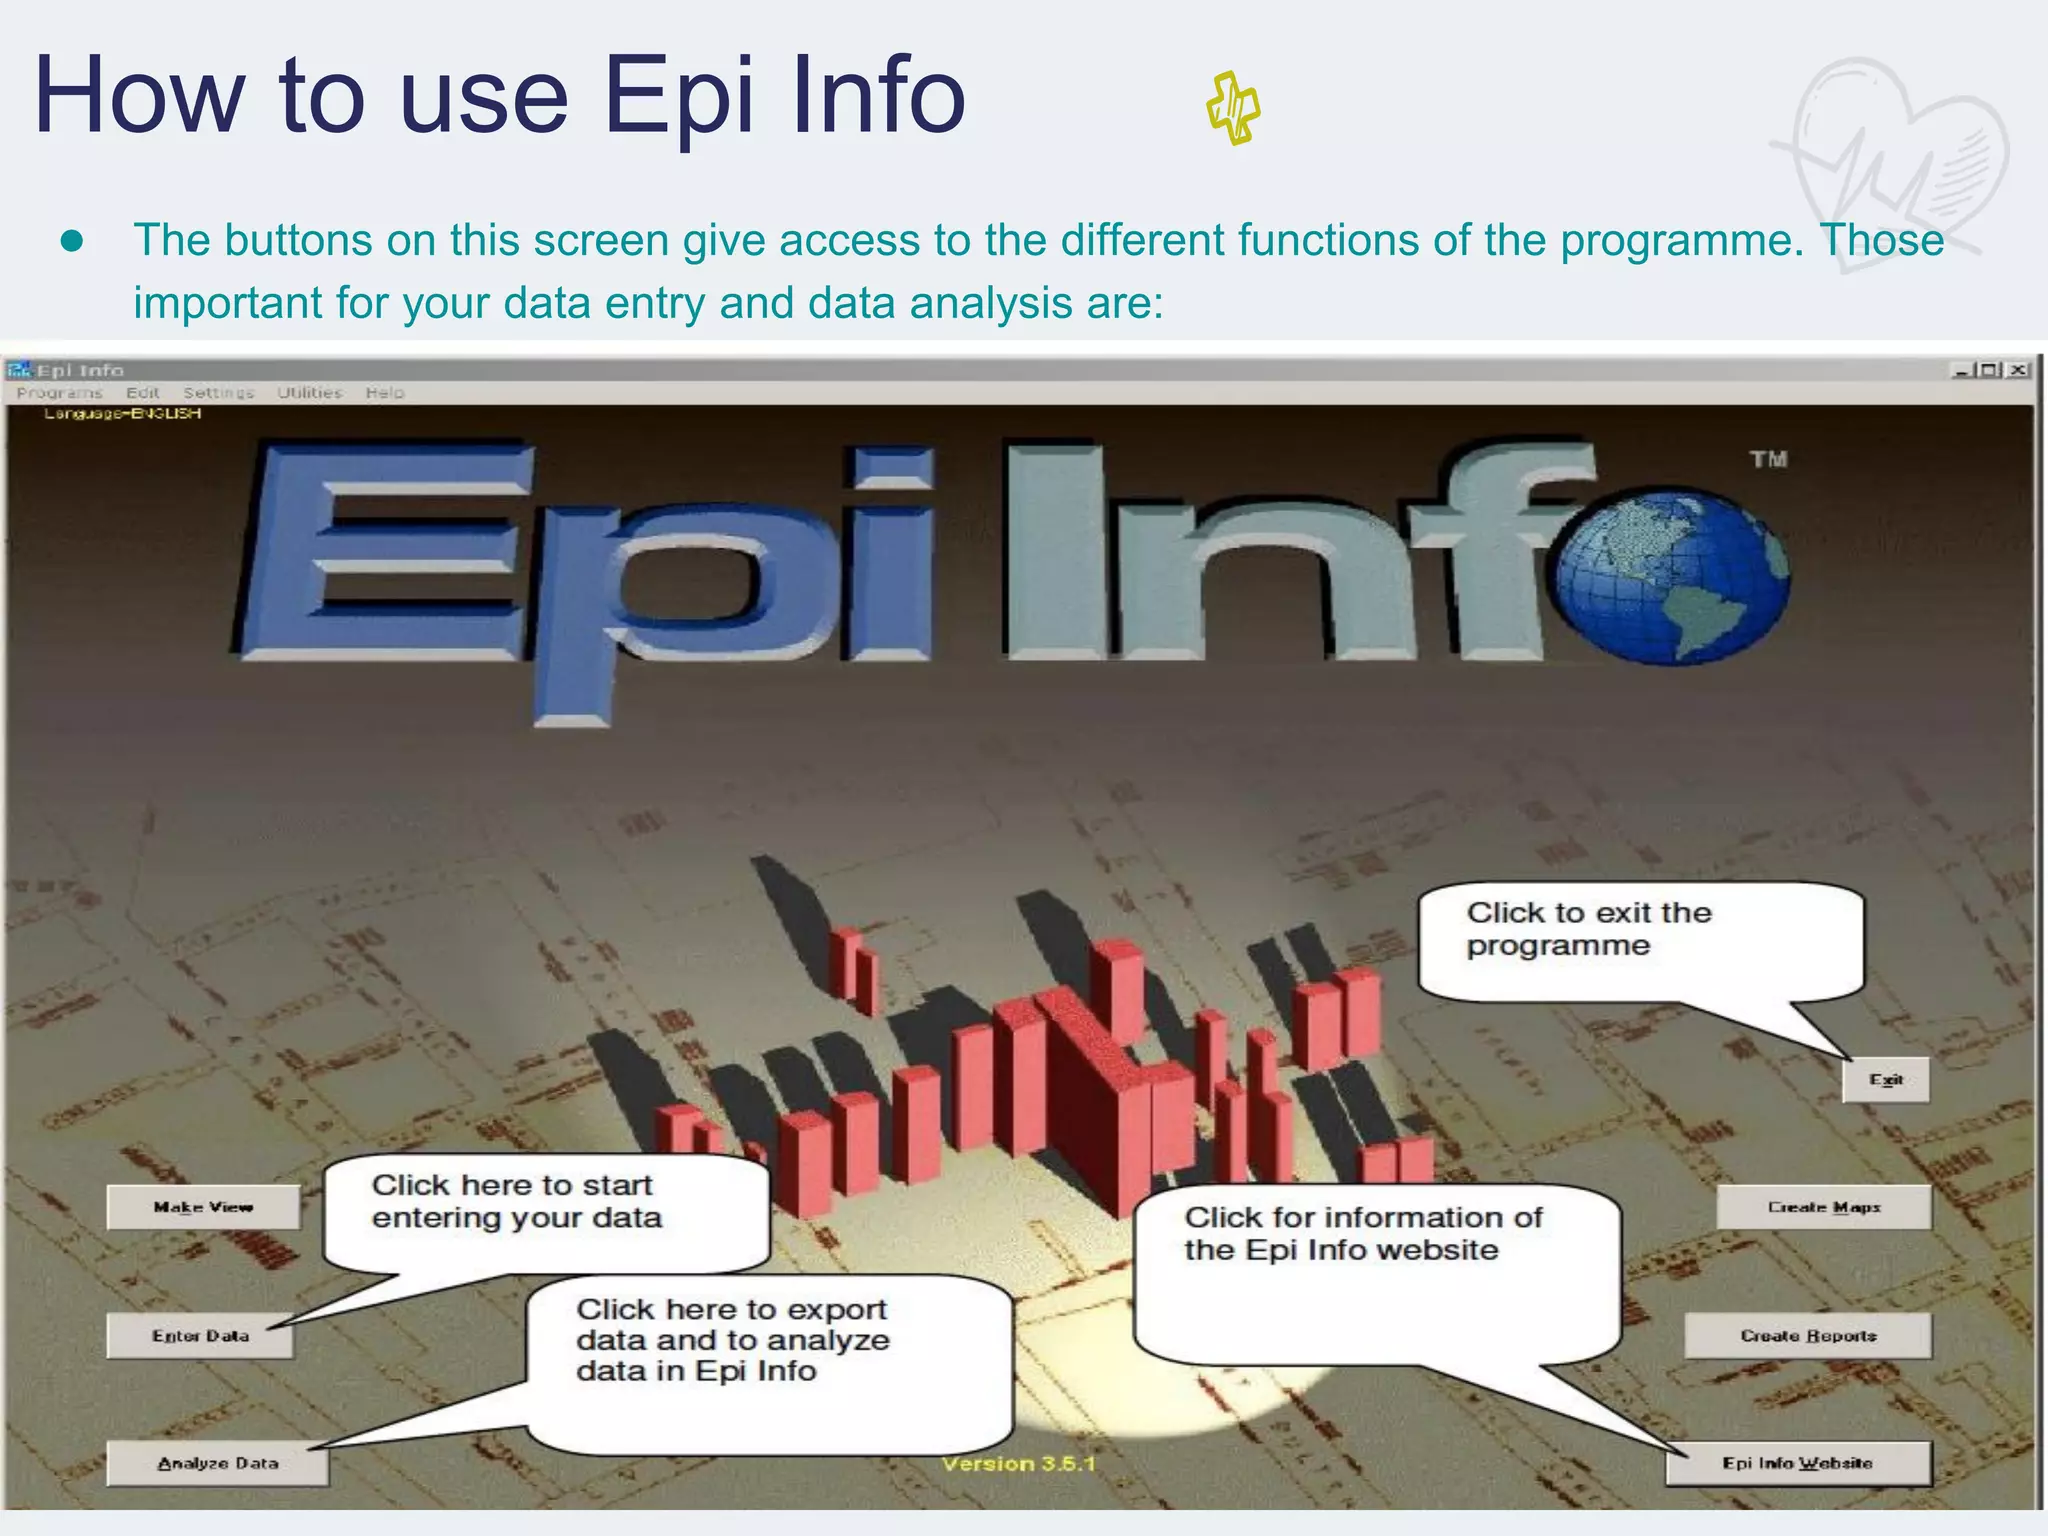
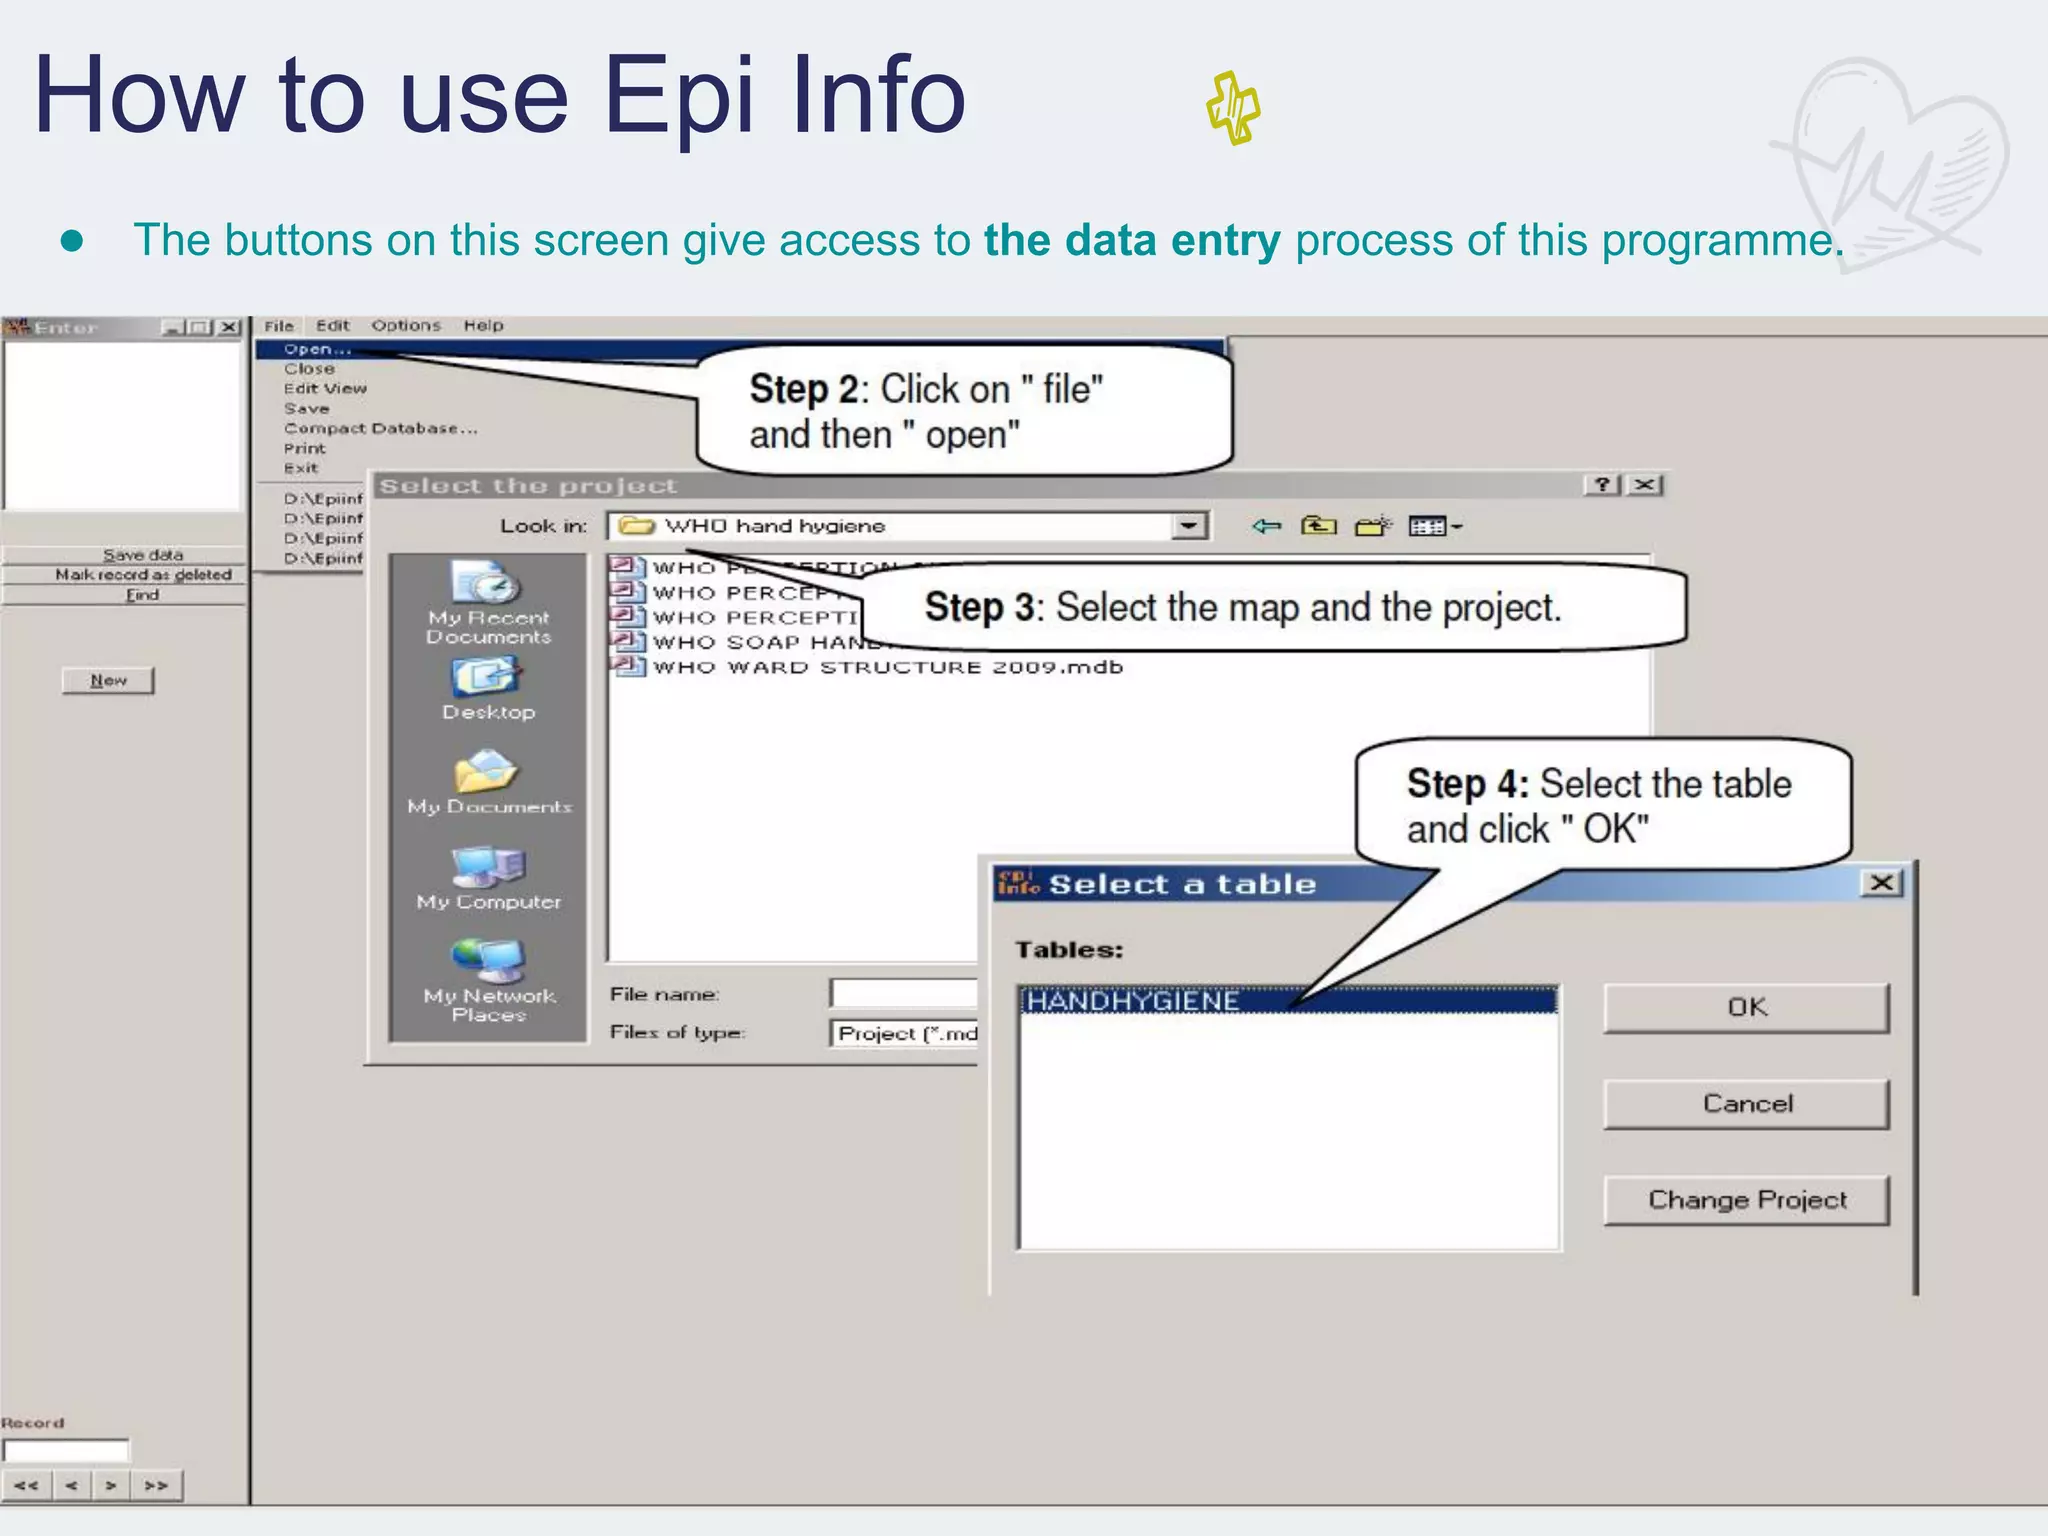
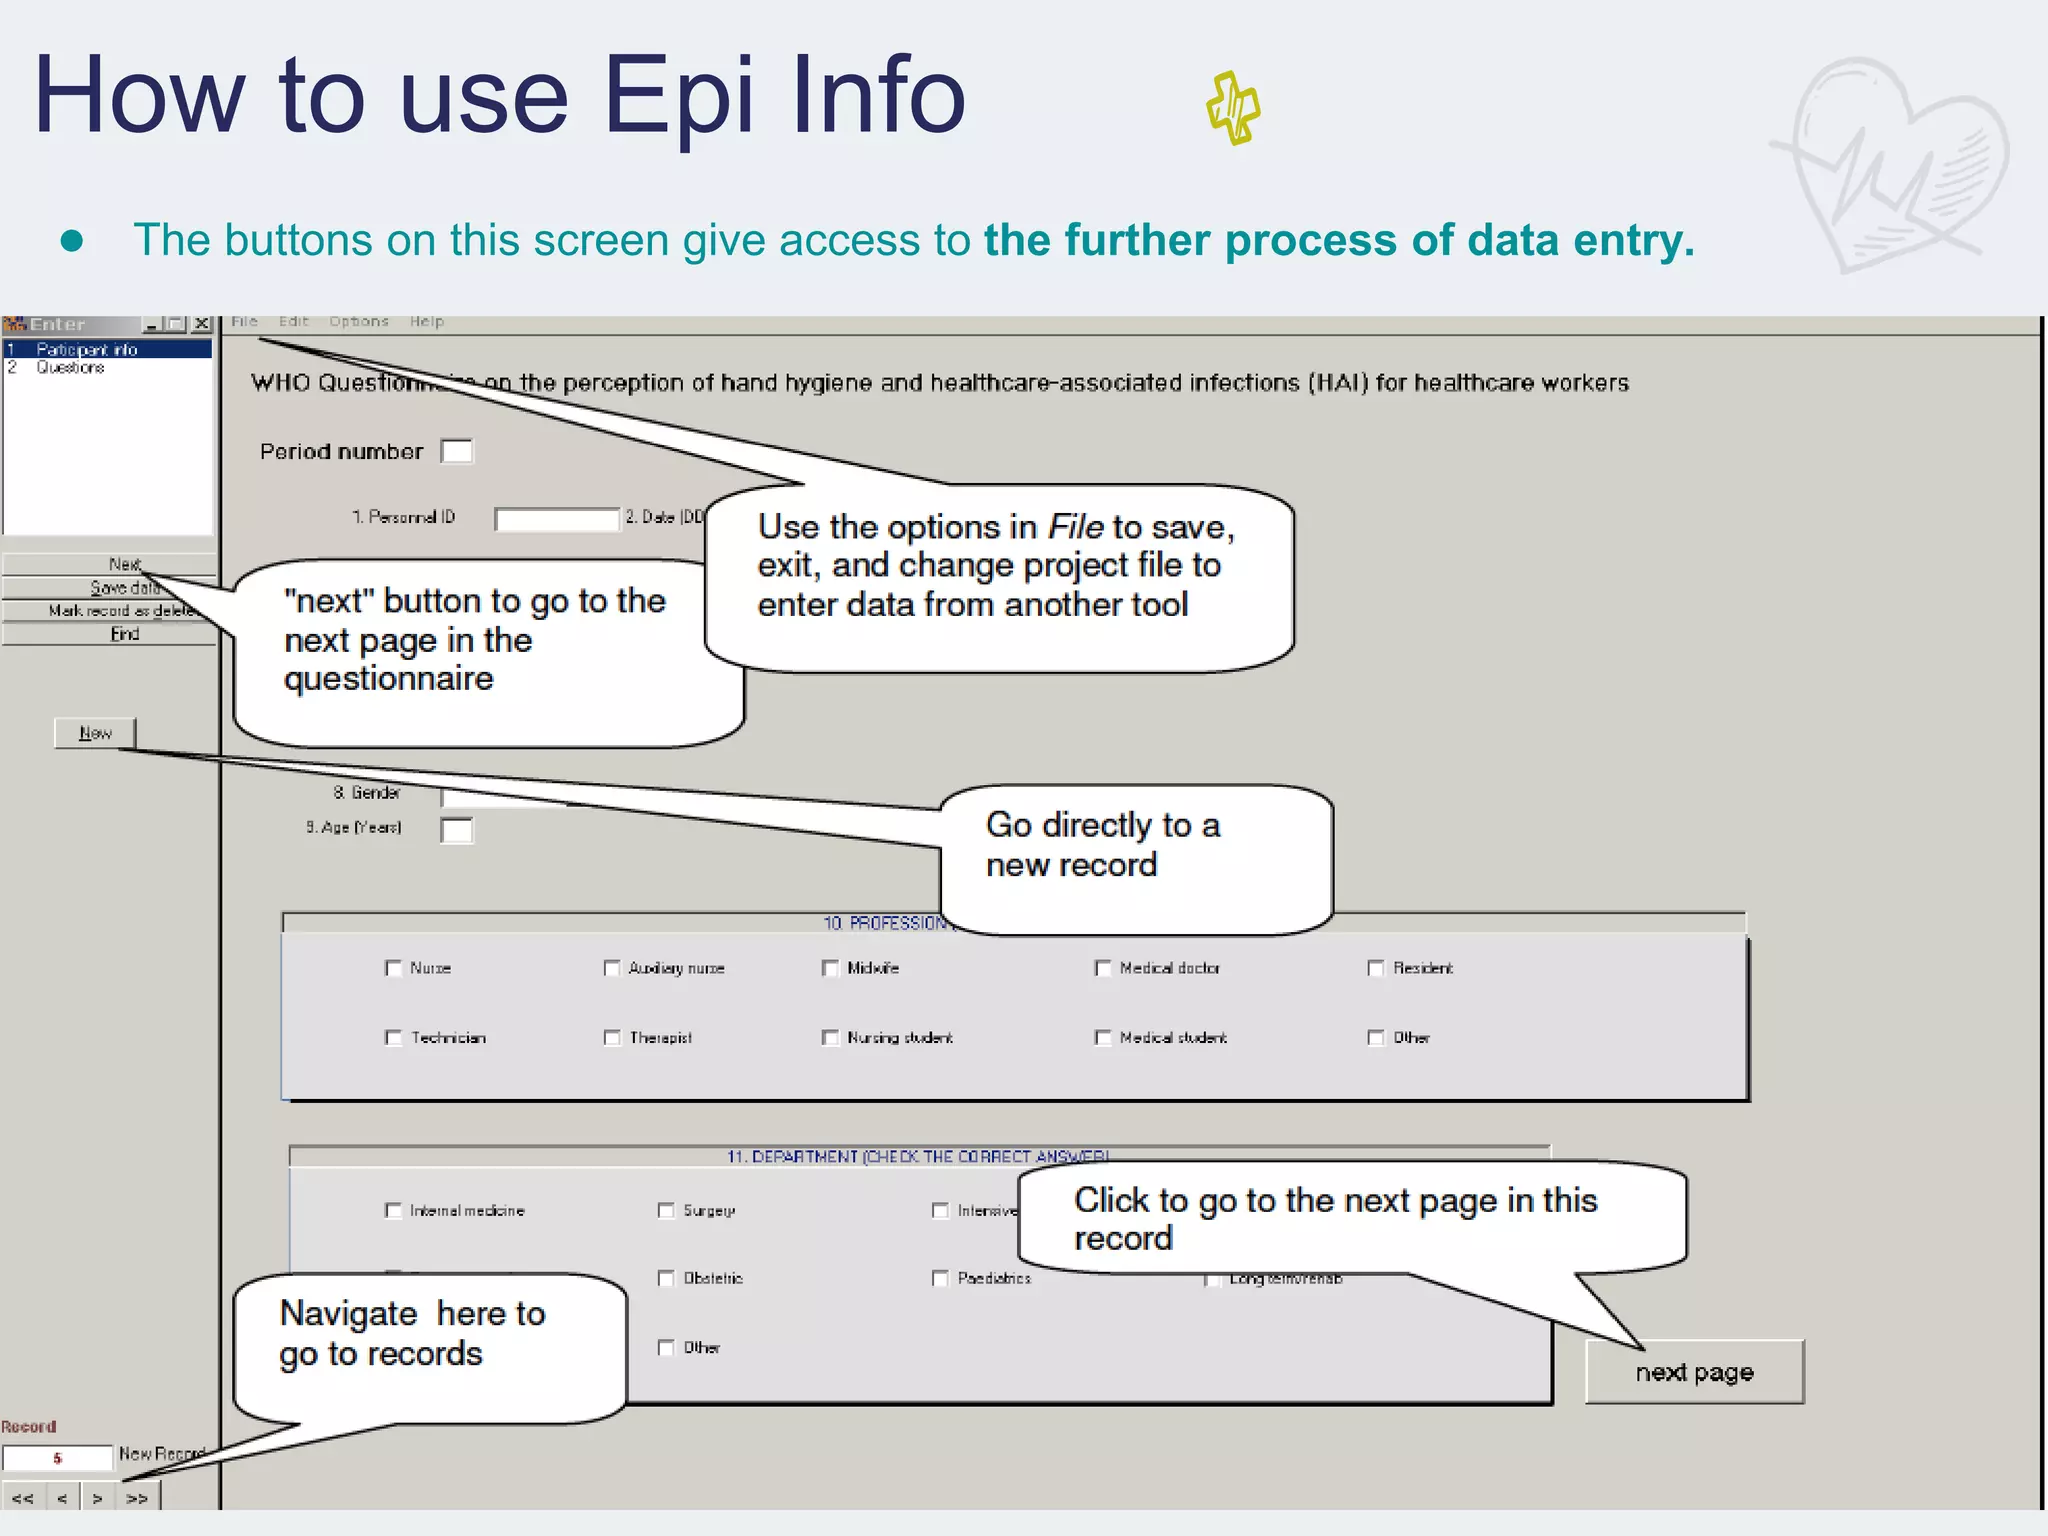
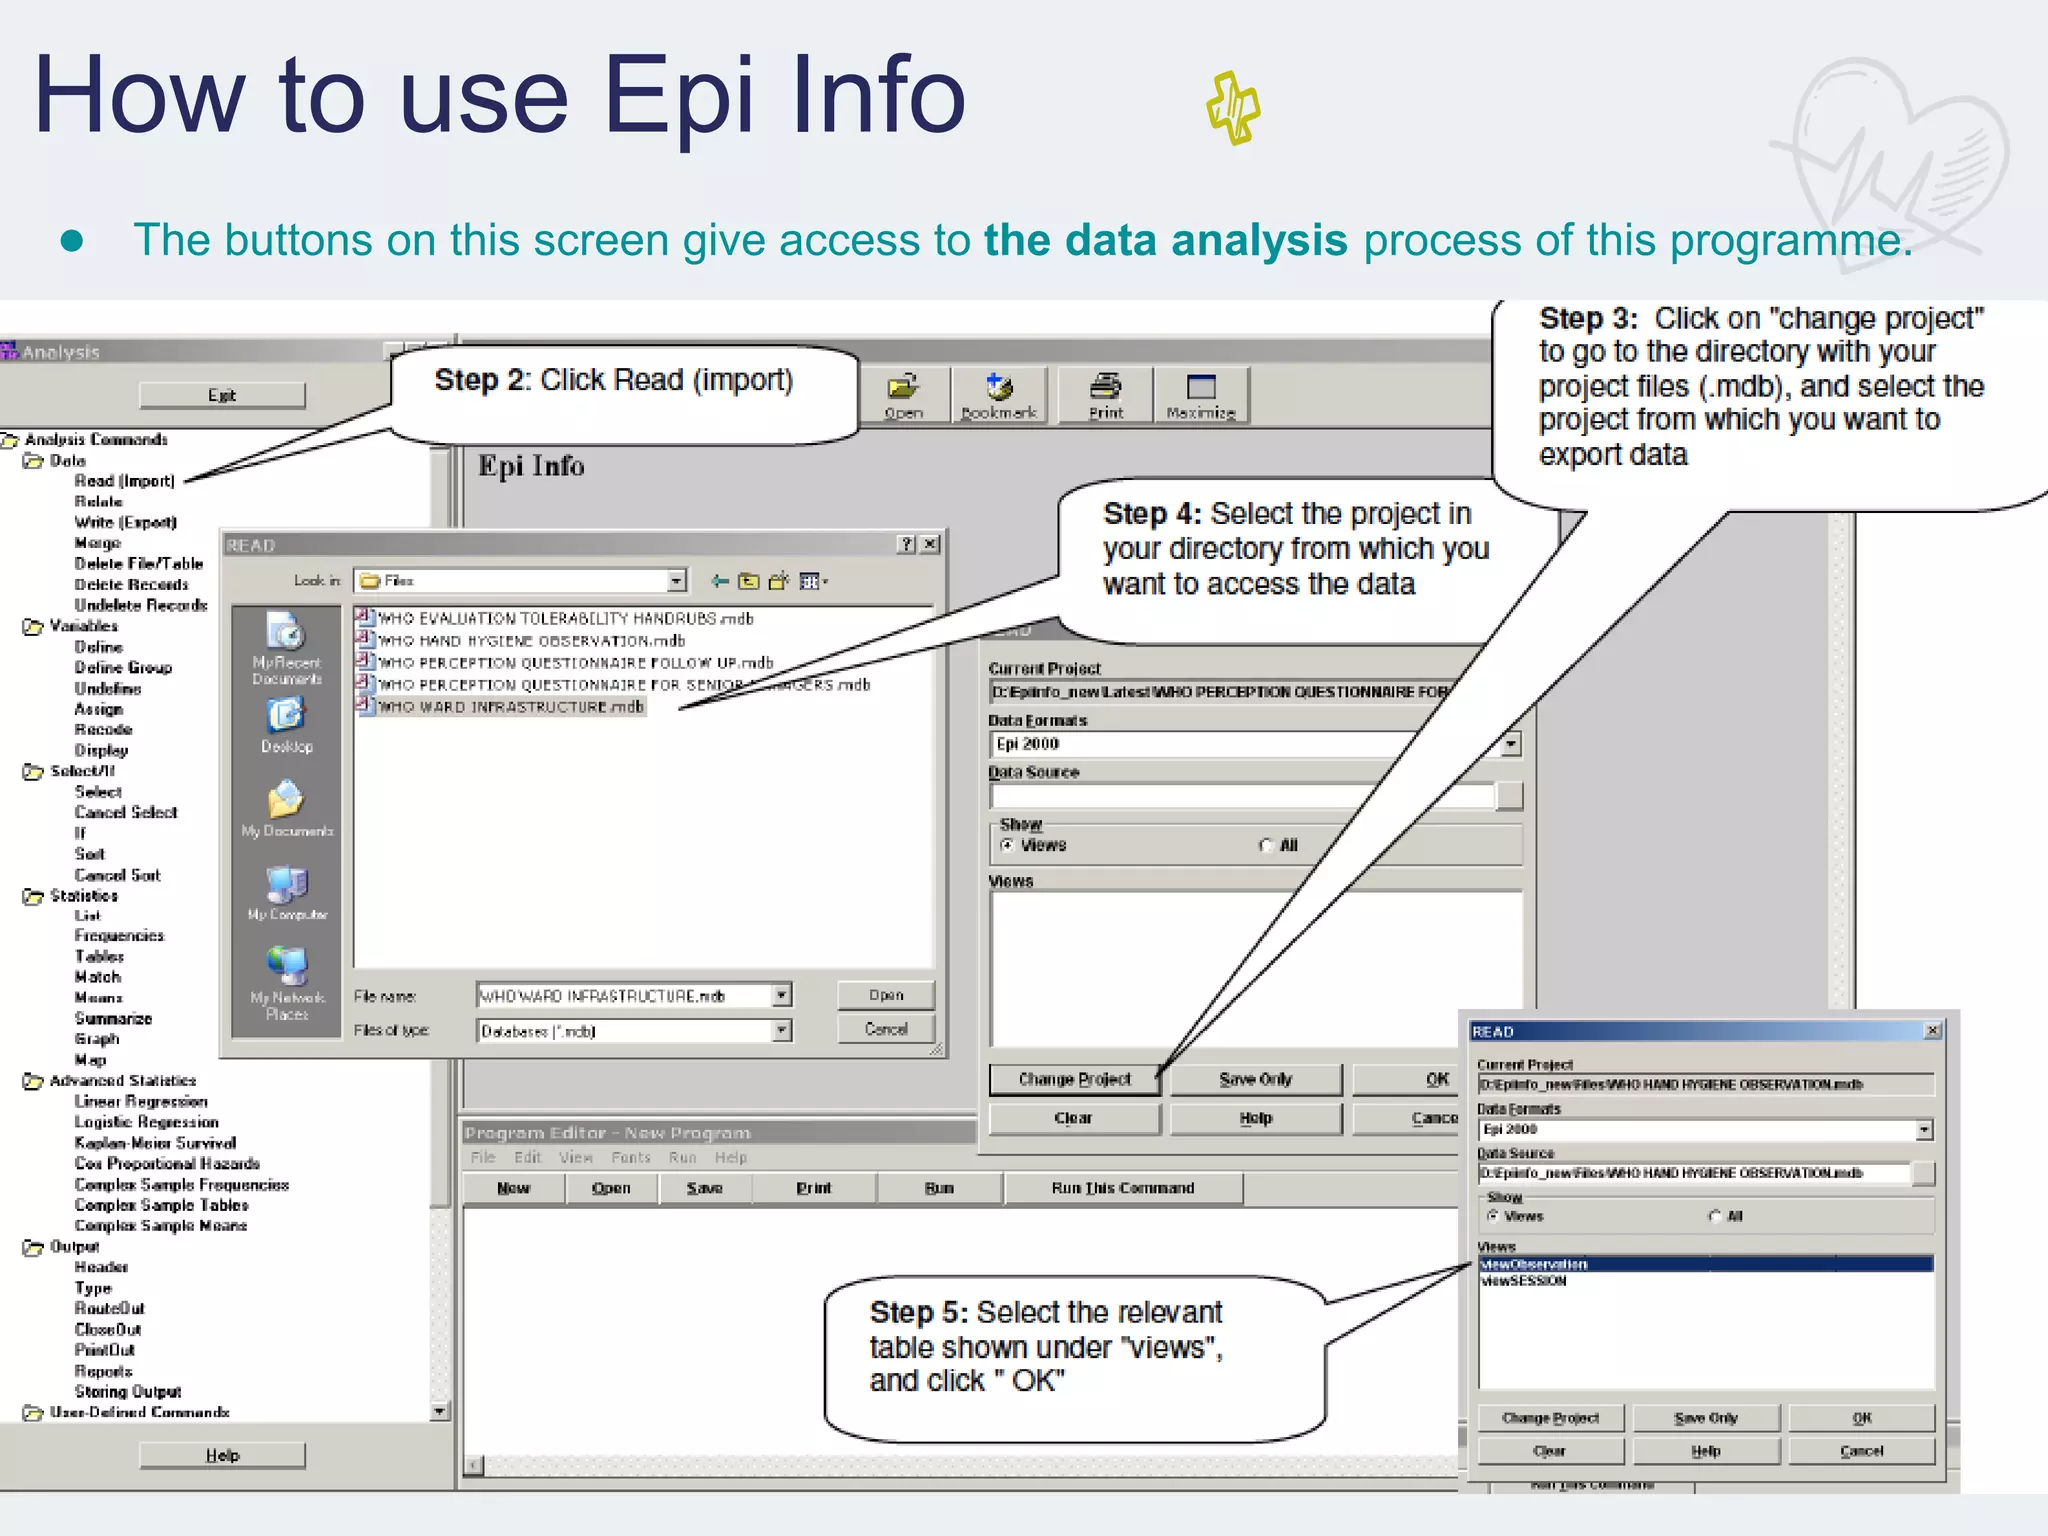
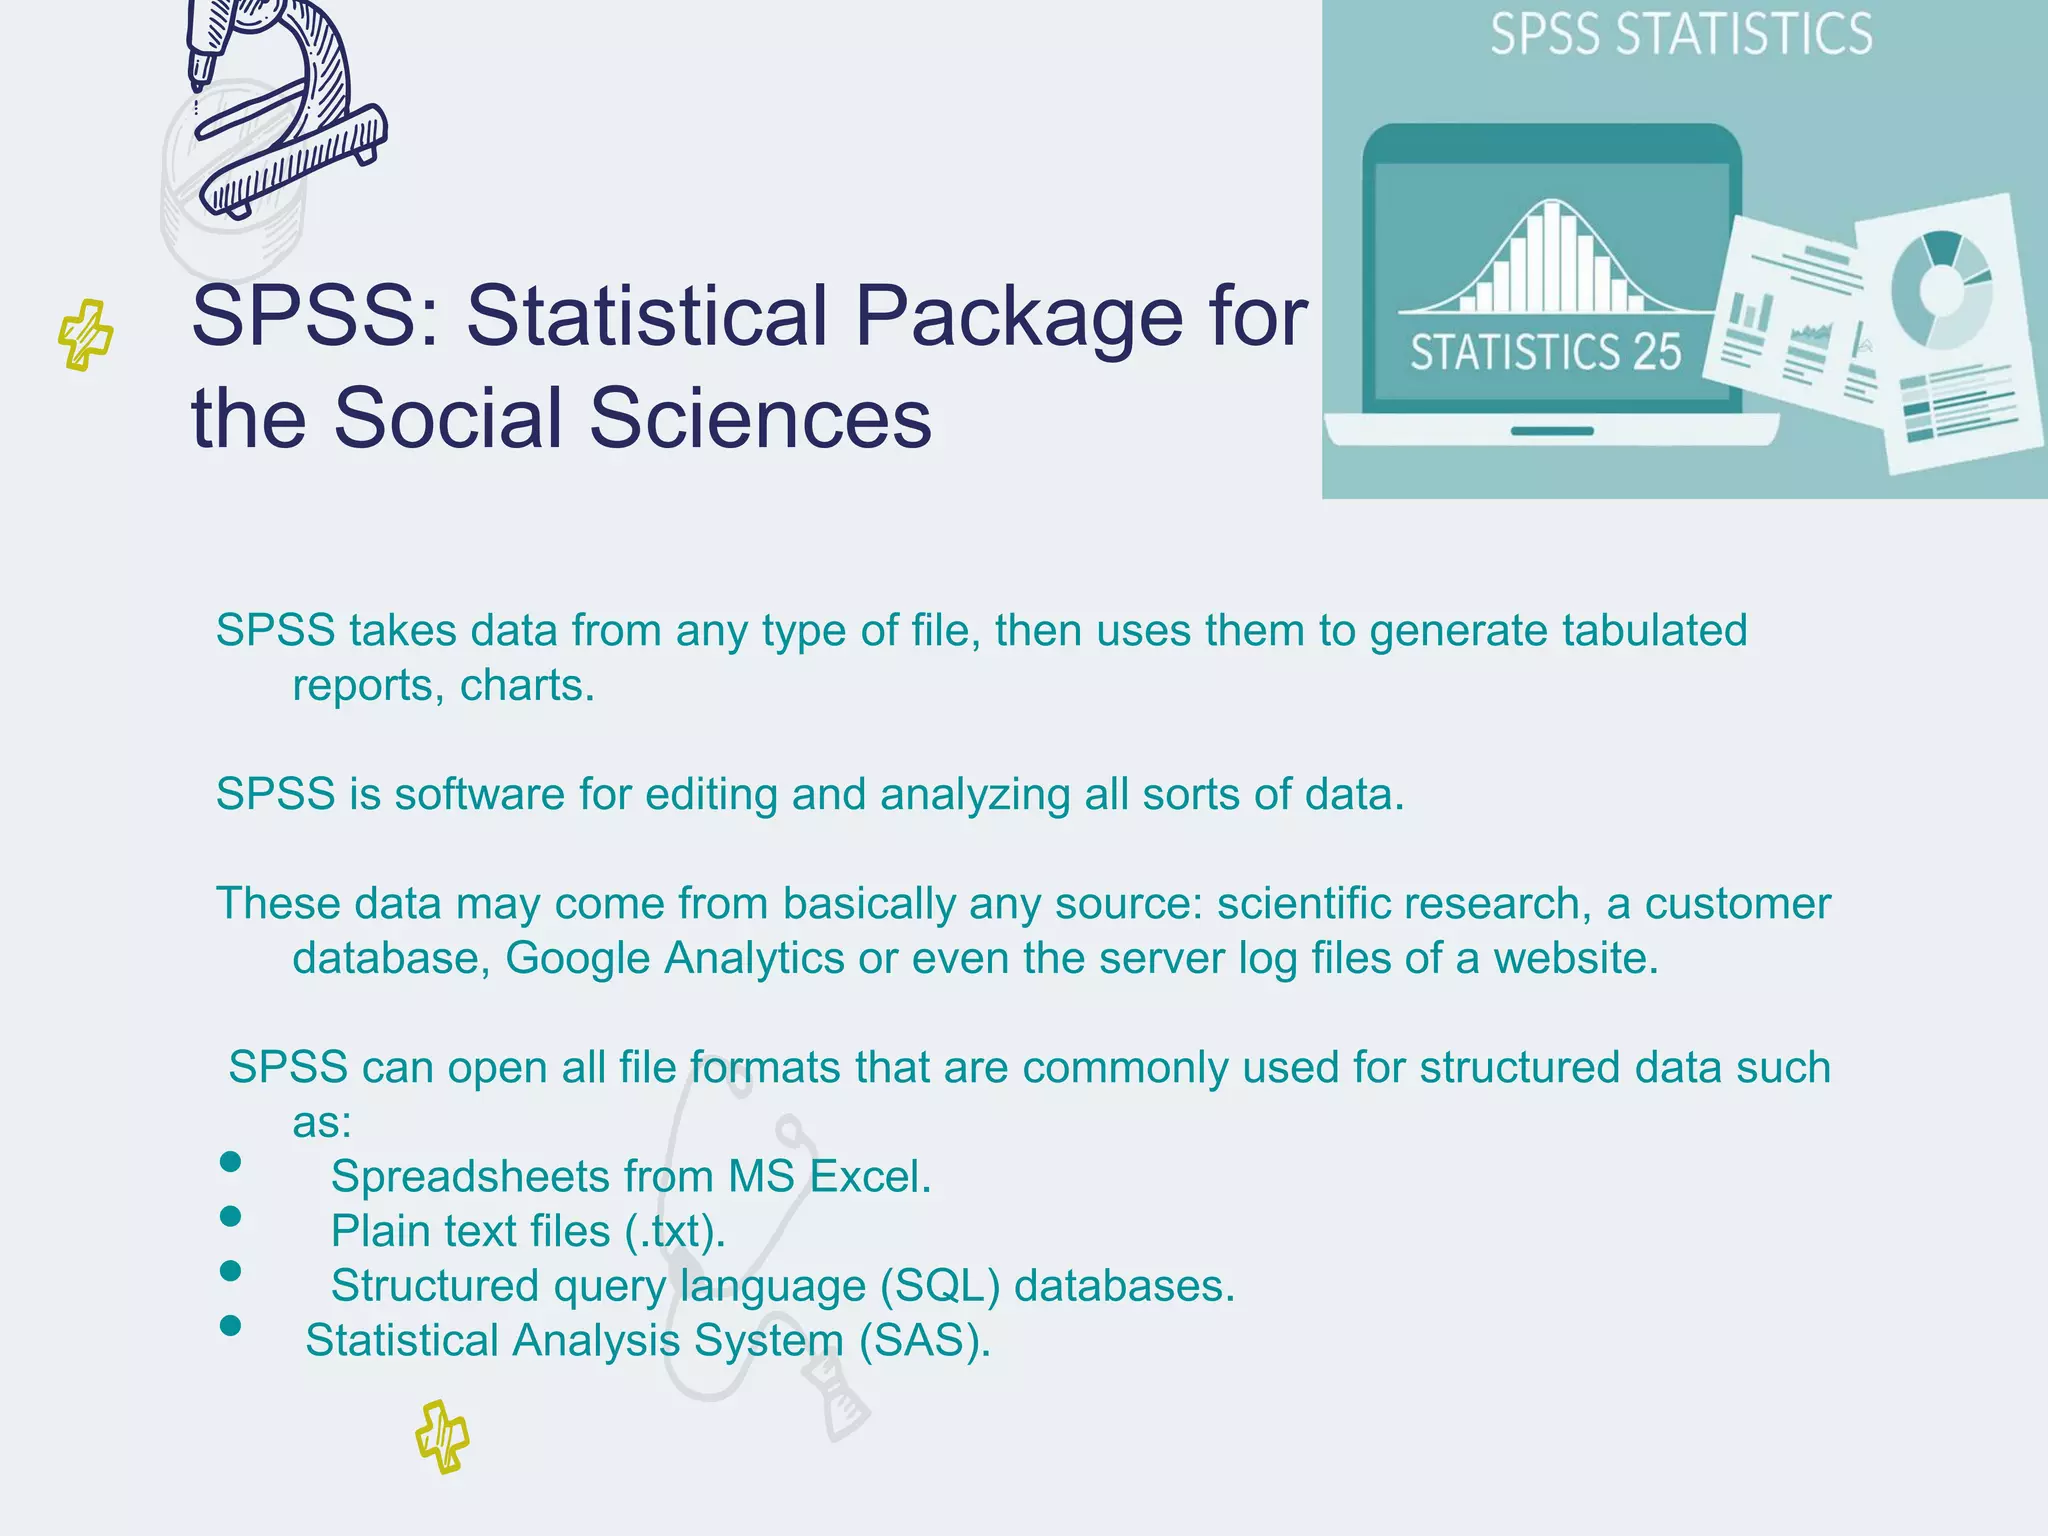
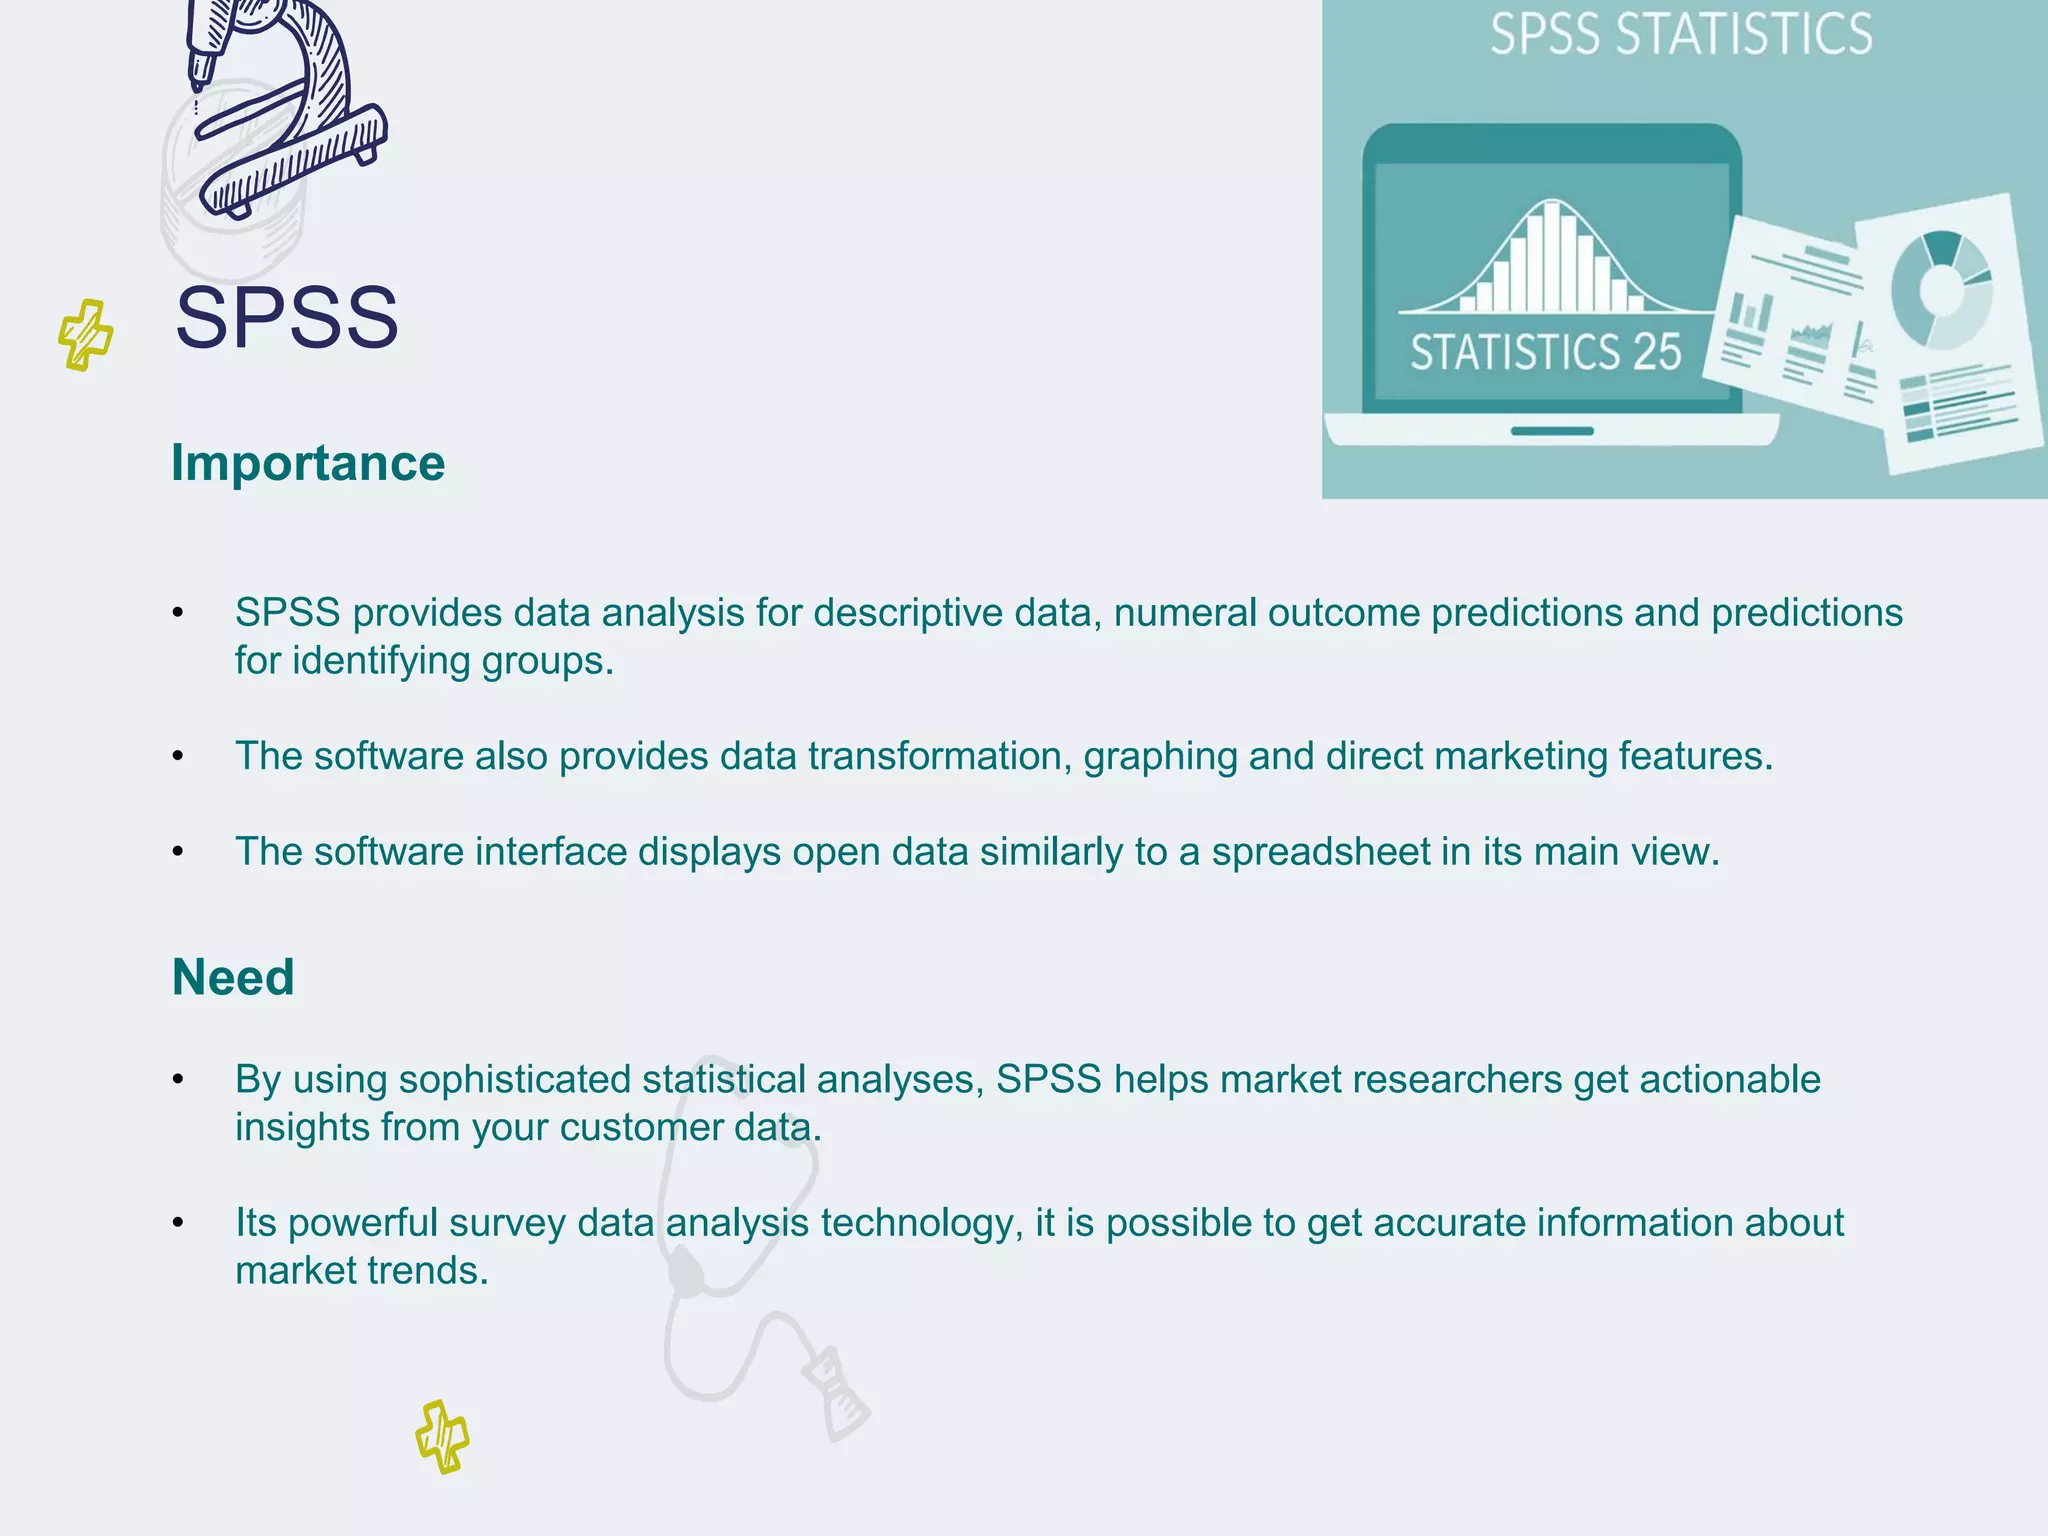
SOFTWARE USED IN
PHARMACOEPIDEMIOLOGY
OVERVIEW :
● Introduction to Softwares used in
Pharmacoepidemiology.
● Types of Software used in
Pharmacoepidemiology.
● Benefits of Software used in
Pharmacoepidemiology.
● Issues with Software used in
Pharmacoepidemiology.
● Conclusion.
Introduction to Softwares used in
Pharmacoepidemiology
● Pharmacoepidemiology is the study of the use and effects of
drugs in large populations. This field of research requires the
use of software to analyze the data collected and to draw
meaningful conclusions.
● Software used in pharmacoepidemiology can range from basic
statistical analysis packages to more complex software
packages specifically designed for pharmacoepidemiology
research.
Types of Software used in
Pharmacoepidemiology
● The most commonly used software in pharmacoepidemiology are
statistical analysis packages such as SAS and SPSS. These
packages are used to analyze the data collected and to draw
meaningful conclusions from it.
● More specialized software packages such as Win BUGS , EPIINFO,
and STATA are also used in pharmacoepidemiology . These
packages are designed to facilitate the analysis of large datasets and
to draw more accurate conclusions from the data.
CLEO
● CLEO is Clinical and Economic Outcomes. It evaluates
health care, projects, interventions, by using formulas
like-.
Cost-effectiveness analysis.
➢ Cost-benefit analysis.
➢ Cost-utility analysis.
➢ Cost effectiveness analysis.
➢ Cost of illness.
● Results of above analysis displayed automatically and
graphically. It helps in better understanding of costs or
benefits of health care severity, drugs, devices and
technologies
CLEO
Importance
• Integration ensures that all systems work together and in harmony to increase productivity
and data consistency.
• In addition, it aims to resolve the complexity associated with increased communication
between systems,
• since they provide a reduction in the impacts of changes that these systems may have.
Need
• Provides standard tools and functions to convert data values from the data format of
a source system into the data format of a destination system
• Allows new version of integration or integrating to new software versions to be
tested and deployed when scheduled
• System provide sufficient customization to meet business requirements
• Integrates data from disparate sources, without physical data movement
TREEAGE
It is US-based software.
Mainly used for decision making analysis.
Applications:
• Construction of complex marker models.
• Study of simple and complex problems.
• To look best possible outcomes.
TREEAGE
Importance
• Start fast and quickly advance to achieve outcomes with efficiency.
• Create powerful models of unlimited complexity.
• Easily analyze your model and share outputs with others.
• Validate your model for greater accuracy and confidence.
Need
• In Healthcare, Compare treatment strategies based on cost, effectiveness and other
outcomes.
• Compare legal strategies and assess risk by creating a decision tree model to analyze
your case.
• Business Professionals, Examine complex business problems qualitatively and
quantitatively through decision analysis.
MS Excel
● MS-EXCEL It is also US based software.
● Microsoft Excel is a spreadsheet developed by
Microsoft for Windows, MacOS (apple), Android and Ios
.
● It features calculation, graphing tools, pivot tables, and
a macro programming language called Visual Basic for
Applications.
● It helps in filtering the data, storing and producing data.
MS Excel
Importance
• MS Excel is a spreadsheet program developed by Microsoft in 1985, with the sole purpose
of helping businesses compile all their financial data, yearly credit, and yearly debit
sheets.
• Fast forward to the future after 31 years, it is now the most commonly used program for
creating graphs and pivot tables.
Need
• Microsoft Excel enables users to format, organize and calculate data in a spreadsheet.
• By organizing data using software like Excel, data analysts and other users can make
information easier to view as data is added or changed.
• Excel contains a large number of boxes called cells that are ordered in rows and columns
• SAS programs consist of Data step-
Creates, manipulates and edits the
data.
• Proc step- Analyzes the data.
• ADVANTAGES: SAS business
intelligence tool presents a report on
past businesses.
• Examines the present scenarios as
well as predicts the future outcomes.
SAS (Statistical Analysis
System)
Need
• Statistical analysis can provide valuable information needed to make decisions when introducing
new products in the market.
• Analysis can be done to establish the reliable markets for the product, and also to predict demand
and sales.
• It can also help in identifying the perfect launch timing.
SAS
Importance
• With SAS software, you can complete these tasks:
• access data in almost any format, including SAS tables, Microsoft Excel tables, and database files.
• manage and manipulate your existing data to get the data that you need.
• For example, you can subset your data, combine it with other data, and create new columns.
How to use SAS
Two types of steps
DATA steps PROC steps
Epi Info
● Epi Info™ is a public domain suite of interoperable software tools
designed for the global community of public health practitioners and
researchers.
● It provides for easy data entry form and database construction, a
customized data entry experience, and data analyses with
epidemiologic statistics, maps, and graphs for public health
professionals who may lack an information technology background.
● Epi Info™ is used for outbreak investigations for developing small to
mid-sized disease surveillance systems as analysis, visualization, and
reporting (AVR) components of larger systems.
Epi Info
Importance
• Epi Info™ is used for outbreak investigations;
• for developing small to mid-sized disease surveillance systems; as analysis, visualization,
and reporting (AVR) components of larger systems;
• and in the continuing education in the science of epidemiology and public health analytic
methods at schools of public health around the world.
Need
• It provides for easy data entry form and database construction,
• customized data entry experience and data analyses with epidemiologic statistics, maps, and
graphs for public health professionals who may lack an information technology background.
How to use Epi Info
● The buttons on this screen give access to the different functions of the programme. Those
important for your data entry and data analysis are:
How to use Epi Info
● The buttons on this screen give access to the data entry process of this programme.
How to use Epi Info
● The buttons on this screen give access to the further process of data entry.
How to use Epi Info
● The buttons on this screen give access to the data analysis process of this programme.
SPSS: Statistical Package for
the Social Sciences
SPSS takes data from any type of file, then uses them to generate tabulated
reports, charts.
SPSS is software for editing and analyzing all sorts of data.
These data may come from basically any source: scientific research, a customer
database, Google Analytics or even the server log files of a website.
SPSS can open all file formats that are commonly used for structured data such
as:
• Spreadsheets from MS Excel.
• Plain text files (.txt).
• Structured query language (SQL) databases.
• Statistical Analysis System (SAS).
SPSS
Importance
• SPSS provides data analysis for descriptive data, numeral outcome predictions and predictions
for identifying groups.
• The software also provides data transformation, graphing and direct marketing features.
• The software interface displays open data similarly to a spreadsheet in its main view.
Need
• By using sophisticated statistical analyses, SPSS helps market researchers get actionable
insights from your customer data.
• Its powerful survey data analysis technology, it is possible to get accurate information about
market trends.
How to use SPSS
When you use SPSS, you work in one of several windows: the data view, the variable view, the
output view, the draft output view.
The data view The variable view
How to use SPSS
The output view
Benefits of Software used in
Pharmacoepidemiology
● Using software in pharmacoepidemiology research
has several advantages. Software can reduce the time
required to analyze large datasets and can help draw
more accurate conclusions from the data.
● Software can also be used to identify patterns in the
data that may not be visible to the naked eye. This
can help researchers draw more meaningful
conclusions from the data.
• Despite the advantages of using software in
pharmacoepidemiology research, there are also some issues
that need to be taken into consideration.
• Software can be expensive and may not be accessible to all
researchers.
• Software can also be complex and difficult to use, which can
lead to errors in the data analysis. It is important that
researchers are aware of the potential issues with using
software in pharmacoepidemiology research.
Issues with Software used in
Pharmacoepidemiology
Conclusion
● Software can be a powerful tool for
pharmacoepidemiology research. It can reduce the
time required to analyze large datasets and can help
draw more accurate conclusions from the data.
● However, it is important to be aware of the potential
issues with using software in pharmacoepidemiology
research. It is also important to ensure that
researchers have access to the necessary software
and that they are trained in its use.
THANK YOU

SOFTWARE USED IN P'epidemiology.pdf

  • 1.
  • 2.
    OVERVIEW : ● Introductionto Softwares used in Pharmacoepidemiology. ● Types of Software used in Pharmacoepidemiology. ● Benefits of Software used in Pharmacoepidemiology. ● Issues with Software used in Pharmacoepidemiology. ● Conclusion.
  • 3.
    Introduction to Softwaresused in Pharmacoepidemiology ● Pharmacoepidemiology is the study of the use and effects of drugs in large populations. This field of research requires the use of software to analyze the data collected and to draw meaningful conclusions. ● Software used in pharmacoepidemiology can range from basic statistical analysis packages to more complex software packages specifically designed for pharmacoepidemiology research.
  • 4.
    Types of Softwareused in Pharmacoepidemiology ● The most commonly used software in pharmacoepidemiology are statistical analysis packages such as SAS and SPSS. These packages are used to analyze the data collected and to draw meaningful conclusions from it. ● More specialized software packages such as Win BUGS , EPIINFO, and STATA are also used in pharmacoepidemiology . These packages are designed to facilitate the analysis of large datasets and to draw more accurate conclusions from the data.
  • 5.
    CLEO ● CLEO isClinical and Economic Outcomes. It evaluates health care, projects, interventions, by using formulas like-. Cost-effectiveness analysis. ➢ Cost-benefit analysis. ➢ Cost-utility analysis. ➢ Cost effectiveness analysis. ➢ Cost of illness. ● Results of above analysis displayed automatically and graphically. It helps in better understanding of costs or benefits of health care severity, drugs, devices and technologies
  • 6.
    CLEO Importance • Integration ensuresthat all systems work together and in harmony to increase productivity and data consistency. • In addition, it aims to resolve the complexity associated with increased communication between systems, • since they provide a reduction in the impacts of changes that these systems may have. Need • Provides standard tools and functions to convert data values from the data format of a source system into the data format of a destination system • Allows new version of integration or integrating to new software versions to be tested and deployed when scheduled • System provide sufficient customization to meet business requirements • Integrates data from disparate sources, without physical data movement
  • 7.
    TREEAGE It is US-basedsoftware. Mainly used for decision making analysis. Applications: • Construction of complex marker models. • Study of simple and complex problems. • To look best possible outcomes.
  • 8.
    TREEAGE Importance • Start fastand quickly advance to achieve outcomes with efficiency. • Create powerful models of unlimited complexity. • Easily analyze your model and share outputs with others. • Validate your model for greater accuracy and confidence. Need • In Healthcare, Compare treatment strategies based on cost, effectiveness and other outcomes. • Compare legal strategies and assess risk by creating a decision tree model to analyze your case. • Business Professionals, Examine complex business problems qualitatively and quantitatively through decision analysis.
  • 9.
    MS Excel ● MS-EXCELIt is also US based software. ● Microsoft Excel is a spreadsheet developed by Microsoft for Windows, MacOS (apple), Android and Ios . ● It features calculation, graphing tools, pivot tables, and a macro programming language called Visual Basic for Applications. ● It helps in filtering the data, storing and producing data.
  • 10.
    MS Excel Importance • MSExcel is a spreadsheet program developed by Microsoft in 1985, with the sole purpose of helping businesses compile all their financial data, yearly credit, and yearly debit sheets. • Fast forward to the future after 31 years, it is now the most commonly used program for creating graphs and pivot tables. Need • Microsoft Excel enables users to format, organize and calculate data in a spreadsheet. • By organizing data using software like Excel, data analysts and other users can make information easier to view as data is added or changed. • Excel contains a large number of boxes called cells that are ordered in rows and columns
  • 11.
    • SAS programsconsist of Data step- Creates, manipulates and edits the data. • Proc step- Analyzes the data. • ADVANTAGES: SAS business intelligence tool presents a report on past businesses. • Examines the present scenarios as well as predicts the future outcomes. SAS (Statistical Analysis System)
  • 12.
    Need • Statistical analysiscan provide valuable information needed to make decisions when introducing new products in the market. • Analysis can be done to establish the reliable markets for the product, and also to predict demand and sales. • It can also help in identifying the perfect launch timing. SAS Importance • With SAS software, you can complete these tasks: • access data in almost any format, including SAS tables, Microsoft Excel tables, and database files. • manage and manipulate your existing data to get the data that you need. • For example, you can subset your data, combine it with other data, and create new columns.
  • 13.
    How to useSAS Two types of steps DATA steps PROC steps
  • 14.
    Epi Info ● EpiInfo™ is a public domain suite of interoperable software tools designed for the global community of public health practitioners and researchers. ● It provides for easy data entry form and database construction, a customized data entry experience, and data analyses with epidemiologic statistics, maps, and graphs for public health professionals who may lack an information technology background. ● Epi Info™ is used for outbreak investigations for developing small to mid-sized disease surveillance systems as analysis, visualization, and reporting (AVR) components of larger systems.
  • 15.
    Epi Info Importance • EpiInfo™ is used for outbreak investigations; • for developing small to mid-sized disease surveillance systems; as analysis, visualization, and reporting (AVR) components of larger systems; • and in the continuing education in the science of epidemiology and public health analytic methods at schools of public health around the world. Need • It provides for easy data entry form and database construction, • customized data entry experience and data analyses with epidemiologic statistics, maps, and graphs for public health professionals who may lack an information technology background.
  • 16.
    How to useEpi Info ● The buttons on this screen give access to the different functions of the programme. Those important for your data entry and data analysis are:
  • 17.
    How to useEpi Info ● The buttons on this screen give access to the data entry process of this programme.
  • 18.
    How to useEpi Info ● The buttons on this screen give access to the further process of data entry.
  • 19.
    How to useEpi Info ● The buttons on this screen give access to the data analysis process of this programme.
  • 20.
    SPSS: Statistical Packagefor the Social Sciences SPSS takes data from any type of file, then uses them to generate tabulated reports, charts. SPSS is software for editing and analyzing all sorts of data. These data may come from basically any source: scientific research, a customer database, Google Analytics or even the server log files of a website. SPSS can open all file formats that are commonly used for structured data such as: • Spreadsheets from MS Excel. • Plain text files (.txt). • Structured query language (SQL) databases. • Statistical Analysis System (SAS).
  • 21.
    SPSS Importance • SPSS providesdata analysis for descriptive data, numeral outcome predictions and predictions for identifying groups. • The software also provides data transformation, graphing and direct marketing features. • The software interface displays open data similarly to a spreadsheet in its main view. Need • By using sophisticated statistical analyses, SPSS helps market researchers get actionable insights from your customer data. • Its powerful survey data analysis technology, it is possible to get accurate information about market trends.
  • 22.
    How to useSPSS When you use SPSS, you work in one of several windows: the data view, the variable view, the output view, the draft output view. The data view The variable view
  • 23.
    How to useSPSS The output view
  • 24.
    Benefits of Softwareused in Pharmacoepidemiology ● Using software in pharmacoepidemiology research has several advantages. Software can reduce the time required to analyze large datasets and can help draw more accurate conclusions from the data. ● Software can also be used to identify patterns in the data that may not be visible to the naked eye. This can help researchers draw more meaningful conclusions from the data.
  • 25.
    • Despite theadvantages of using software in pharmacoepidemiology research, there are also some issues that need to be taken into consideration. • Software can be expensive and may not be accessible to all researchers. • Software can also be complex and difficult to use, which can lead to errors in the data analysis. It is important that researchers are aware of the potential issues with using software in pharmacoepidemiology research. Issues with Software used in Pharmacoepidemiology
  • 26.
    Conclusion ● Software canbe a powerful tool for pharmacoepidemiology research. It can reduce the time required to analyze large datasets and can help draw more accurate conclusions from the data. ● However, it is important to be aware of the potential issues with using software in pharmacoepidemiology research. It is also important to ensure that researchers have access to the necessary software and that they are trained in its use.
  • 27.