M. PHARM 1ST SEM
SEMINAR
Sub - Biostatistics
Topic - Standard Error and Predictability limits
Date – 08.10.15
Presented by - Satyaki Aparajit Mishra
Regd No - 1561611001
School of Pharmaceutical Sciences,
S‘O’A University
Standard error[1] :-
 The standard error (SE) is the standard
deviation of the sampling distribution of
a statistical mean.
 It is used to refer to an estimate of the
standard deviation, derived from a
particular sample to compute the
estimate.
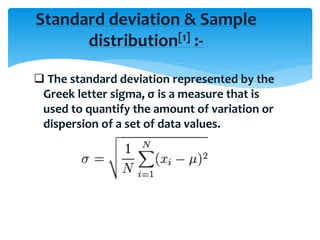
 The standard deviation represented by the
Greek letter sigma, σ is a measure that is
used to quantify the amount of variation or
dispersion of a set of data values.
Standard deviation & Sample
distribution[1] :-
Sampling distribution is the probability
distribution of a given statistic based on a
random sample.
It provides major statistical inference for
which it is important
It is the standard deviation divided by
the square root of it’s sample size (n)
 Used as an instrument in testing a given
hypothesis
 It provides an idea about the unreliability of a
sample
 S.E helps in determining the limits within
which the values are expected to lie
Need of Standard Error :-

 Estimating Standard Error [1]:-
In actual research, we rarely have the resources
to draw multiple samples from a population to
estimate standard error.
Instead, we typically draw just one sample and
estimate the standard error from this sample.
We estimate the standard error by dividing the
standard deviation (i.e., the distribution of
observations) by the square root of the sample
size.
 If we have a large standard deviation and
we select a small sample, then we have a
large chance of incorrectly estimating the
mean.
 In this case, standard error (i.e., the extent
to which our estimate can vary around its
true value) will be large.
… continued
 If we have a large standard deviation and we
select a large sample, then we greatly reduce
our chance of incorrectly estimating the mean.
In this case, standard error (i.e., the extent to
which our estimate can vary around its true
value) will be small.
 If we have a small standard deviation, then
even if we have a small sample size, our
standard error will be small.
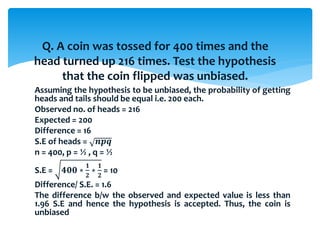
Assuming the hypothesis to be unbiased, the probability of getting
heads and tails should be equal i.e. 200 each.
Observed no. of heads = 216
Expected = 200
Difference = 16
S.E of heads = 𝒏𝒑𝒒
n = 400, p = ½ , q = ½
S.E = 𝟒𝟎𝟎 ∗
𝟏
𝟐
∗
𝟏
𝟐
= 10
Difference/ S.E. = 1.6
The difference b/w the observed and expected value is less than
1.96 S.E and hence the hypothesis is accepted. Thus, the coin is
unbiased
Q. A coin was tossed for 400 times and the
head turned up 216 times. Test the hypothesis
that the coin flipped was unbiased.
JOURNAL REVIEWS :-
Inappropriate use of standard error of the mean when reporting
variability of study samples: A critical evaluation of four selected
journals of obstetrics and gynaecology[3]
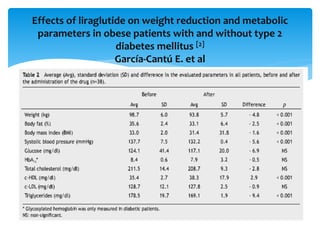
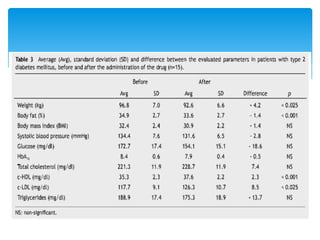
Effects of liraglutide on weight reduction and metabolic
parameters in obese patients with and without type 2
diabetes mellitus [2]
García-Cantú E. et al
 It helps to detect and reduce sampling
errors and measurement errors as much
as possible.
 Standard error of the mean tells us how
accurate our estimate of the mean is
likely to be.
Advantages :-
1. Gupta S.P. ; Statistical Methods ; 42nd Revised Edition, 2012
(Reprint 2013) Page 889-910[1]
2. García-Cantú E. A. , Alvarado-Saldaña H. H. , Támez-Pérez H.
E. , G. Rubio-Aguilar ; Medicina Universitaria; Effects of
liraglutide on weight reduction and metabolic parameters
in obese patients with and without type - 2 diabetes
mellitus ; Vol. 16 ; Núm. 63 ; June 2014 [2]
3. Wen-Ru Ko, Wei-Te Hung, Hui-Chin Chang, Long-Yau Lin ;
Inappropriate use of standard error of the mean when
reporting variability of study samples: A critical evaluation
of four selected journals of obstetrics and gynaecology ;
Taiwanese Journal of Obstetrics & Gynaecology 53 (2014)
26e29 [3]
References :-
Standard error