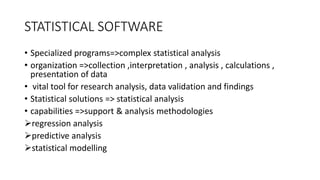
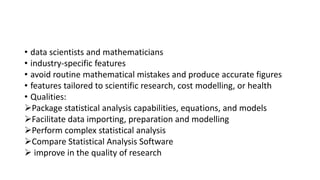
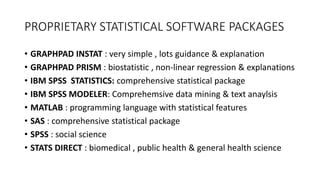
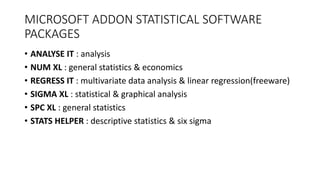
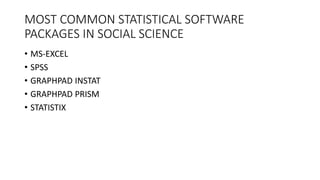
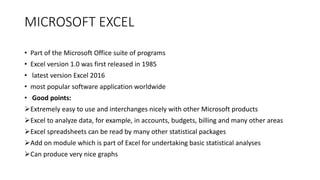
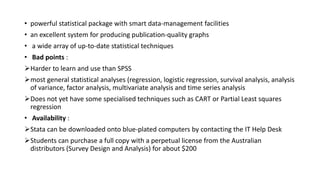
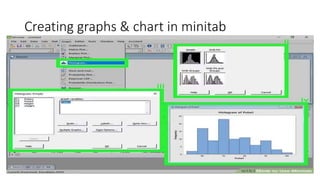
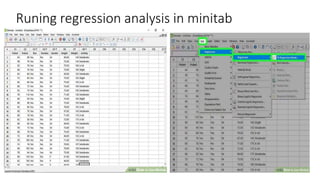
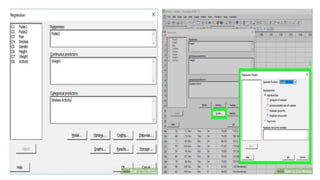
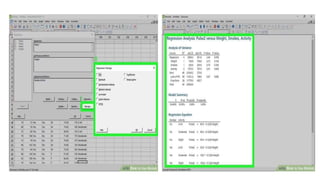
SlideShare a Scribd company logo
STATISTICAL SOFTWARES
PACKAGES , LAYOUT &
APPLICATIONS
DR.MUMTAZ ALI NAREJO
PhD STUDENT S.A.L.U KHAIRPUR MIRS
OUTLINES
• Introduction
• Common features
• Advantages
• Types
• Most common packages
• Layout
• Applications
STATISTICAL SOFTWARE
• Specialized programs=>complex statistical analysis
• organization =>collection ,interpretation , analysis , calculations ,
presentation of data
• vital tool for research analysis, data validation and findings
• Statistical solutions => statistical analysis
• capabilities =>support & analysis methodologies
regression analysis
predictive analysis
statistical modelling
• data scientists and mathematicians
• industry-specific features
• avoid routine mathematical mistakes and produce accurate figures
• features tailored to scientific research, cost modelling, or health
• Qualities:
Package statistical analysis capabilities, equations, and models
Facilitate data importing, preparation and modelling
Perform complex statistical analysis
Compare Statistical Analysis Software
 improve in the quality of research
COMMON FEATURES OF STATISTICAL SOFTWARES
• common characteristics that make reliable & suitable for data analysis
• Data editor is in rows & columns : very easy to enter numeric data
• availability of menu bar comprises drop-down menu, quick analysis
as well as brief user manual
• Statistical level of measurement is put into consideration in data entry
• Getting your data ready to enter into the software
• Defining and labeling variable
• Entering data appropriately with each row containing each case and
each column as variable
• Data checking and cleaning is possible
• All data should be numeric
• Data exploration can be done to check for errors and other accuracy
• The statistical level of significance for rejecting null hypothesis (Ho) is
when your p-value significance is less than 0.05
• Time & cost effective
ADVANTAGES OF STATISTICAL SOFTWARE
• Accuracy & speed
• Varsality
• Validity
• Graphics
• Flexibilty
• New variables
• Volume of data
• Easy transfer of data
• Easy compilation , tabulation ,Diagramatics prrsentaion
• averages , co-efficients of variation ,standard deviation error & percentiles
TYPES OF STATISTICAL SOFTWARE PACKAGES
• Open source
• Public domain
• Freeware
• Proprietary
OPEN SOURCE STATISTICAL SOFTWARE PACKAGES
• ADMB : Non-linear statistical modelling on C++
• DAP : Free replecement for SAS
• FITYK : Non-linear regression
• OPENEPI : Web-based , open source , independent for epidiomiology
& STATISTICS
• SCIPY: Regression , plotting , anova
• PSPP : Free & alternative to IBM SPSS
• R : A free implementation of S
PUBLIC DOMAIN STATISTICAL SOFTWARE
PACKAGES
• CSPRO :
Developed : US census beureau & ICF international
Used : entering , editing , tabulating , mapping , disseminting census & surveying data
• EPI-INFO :
Epidemiology
Developed : centre for disease controll & prevention in Atlanta & georgia (USA)
used : electronic survey creation , data entry , Analysis (t-test & Anova)
• X-12 -ARIMA :
 Developed : US census beureau
Use : seasonal variations
FREEWARE STATISTICAL SOFTWARE PACKAGES
• WINBUGS :
Baysian analysis
 use markov chain monte carlos methods
• WINPEPI :
Epidemilogy
PROPRIETARY STATISTICAL SOFTWARE PACKAGES
• GRAPHPAD INSTAT : very simple , lots guidance & explanation
• GRAPHPAD PRISM : biostatistic , non-linear regression & explanations
• IBM SPSS STATISTICS: comprehensive statistical package
• IBM SPSS MODELER: Comprehemsive data mining & text anaylsis
• MATLAB : programming language with statistical features
• SAS : comprehensive statistical package
• SPSS : social science
• STATS DIRECT : biomedical , public health & general health science
MICROSOFT ADDON STATISTICAL SOFTWARE
PACKAGES
• ANALYSE IT : analysis
• NUM XL : general statistics & economics
• REGRESS IT : multivariate data analysis & linear regression(freeware)
• SIGMA XL : statistical & graphical analysis
• SPC XL : general statistics
• STATS HELPER : descriptive statistics & six sigma
MOST COMMON STATISTICAL SOFTWARE
PACKAGES IN SOCIAL SCIENCE
• MS-EXCEL
• SPSS
• GRAPHPAD INSTAT
• GRAPHPAD PRISM
• STATISTIX
MICROSOFT EXCEL
• Part of the Microsoft Office suite of programs
• Excel version 1.0 was first released in 1985
• latest version Excel 2016
• most popular software application worldwide
• Good points:
Extremely easy to use and interchanges nicely with other Microsoft products
Excel to analyze data, for example, in accounts, budgets, billing and many other areas
Excel spreadsheets can be read by many other statistical packages
Add on module which is part of Excel for undertaking basic statistical analyses
Can produce very nice graphs
• Bad points :
Good in only general statistics but poor in regression analysis ,logistic
regression ,survival , variance , Factor & multivariate analysis
Excel is designed for financial calculations, although it is possible to
use it for many other things
Cannot undertake more sophisticated statistical analyses without
purchase of expensive commercial add ons.
• Availability
Microsoft software already installed
For blue-plated (UniSA) computers, contact the IT Help Desk to install
the latest Microsoft office software
For your own computer, you can always purchase Microsoft Office
from a retail store.
SPSS
• Statistical Package for the Social Sciences
• Version 1 being released in 1968, well before the advent of desktop computers
• It is now on Version 23
• Data editor ,output viewer , syntax editor , script window
• Good points :
Very easy to learn and use
Can use either with menus or syntax files
Quite good graphics
Excels at descriptive statistics,testing hypothesis , co-relation, basic regression analysis,
analysis of variance, and some newer techniques such as Classification and Regression Trees
(CART)
Has its own structural equation modelling software AMOS, that dovetails with SPSS
• Bad points :
Focus is on statistical methods mainly used in the social sciences,
market research and psychology
Has advanced regression modelling procedures such as LMM and
GEE, but they are awful to use with very obscure syntax
Has few of the more powerful techniques required in epidemiological
analysis, such as competing risk analysis or standardised rates
 Availability :
SPSS is available on blue-plated (UniSA) computers
contact the IT Help Desk to install it
SAS
• Statistical Analysis System
• North Carolina State University in 1966
• contemporary with SPSS
• Good points :
Can use either with menus or syntax files
Much more powerful than SPSS
 "power users" like because of its power and programmability
Commonly used for data management in clinical trials
• Bad points :
Harder & longer time to learn and use than SPSS
 number of records is generally limited to the size of your hard disk.
• Availability :
To organise installation contact the IT Help Desk
STATA
• more recent statistical package with Version 1 being released in 1985
• popular in the areas of epidemiology and economics
• We are now on Version 14
• available for Windows, Unix, and Mac computers
• Good points :
Can use either with menus or syntax files
Much more powerful than SPSS – probably equivalent to SAS
Excels at advanced regression modelling
Has its own in-built structural equation modelling
Has a good suite of epidemiological procedures
Researchers around the world write their own procedures in Stata
• powerful statistical package with smart data-management facilities
• an excellent system for producing publication-quality graphs
• a wide array of up-to-date statistical techniques
• Bad points :
Harder to learn and use than SPSS
most general statistical analyses (regression, logistic regression, survival analysis, analysis
of variance, factor analysis, multivariate analysis and time series analysis
Does not yet have some specialised techniques such as CART or Partial Least squares
regression
• Availability :
Stata can be downloaded onto blue-plated computers by contacting the IT Help Desk
Students can purchase a full copy with a perpetual license from the Australian
distributors (Survey Design and Analysis) for about $200
R
• S-plus is a statistical programming language developed in Seattle in 1988
• R is a free version of S-plus developed in 1996
• it is a programming language and environment
• richest statistical systems contain impressive amount of libraries, growing each day
• Good points
Very powerful – easily matches or even surpasses many of the models found in SAS
or Statas
Researchers around the world write their own procedures in R
• Bad points
Much harder to learn and use than SAS or Stata
general statistical analysis
• Availability
http://cran.csiro.au/
MINITAB
• used by educators, students, scientists, business associates and researchers in a
multitude of areas
• developed around 1990
• one of the oldest statistical software programs available
• has compatibility with PC, Macintosh, Linux
• GOOD POINTS:
 easiest statistical software programs to use
 popular choice with those new statistical software.
With drop-down menus and dialog boxes describing how and what to do next
persists as a popular choice for teaching students about statistics and data analysis
 primarily has a user base of educators using the program to show students research
methods and analysis
• BAD POINTS :
performs most general statistical analyses (regression, logistic regression,
survival analysis, analysis of variance, factor analysis
has its weaknesses in general linear model (GLM) and Multilevel regression)
1.Entering data in minitab
Viewing descriptive statistics in minitab
Creating graphs & chart in minitab
Runing regression analysis in minitab
GRAPHPAD PRISM
• written by Harvey Motulsky in 1989
• 2D graphics , curve fitting & statistical software for windows
• Good Points :
Non-linear regression & removal of outliers
 comparisons of models & curves, interpolation of standard curves
 automatic updating of results and graphs
functionality for displaying error bars
Built in formulae, batch processing and standardisation features,
along with automated analysis and data validation makes GraphPad
Prism a popular software amongst users
STATISTIX
• Statistix is a powerful statistical analysis program you can use to quickly analyze your
data
• Easy to Learn and Use
• Completely menu-driven, procedures are specified using concise Windows-style
dialog boxes.
• Reliable
• Developed in 1985
• Comprehensive
• Statistix performs all the basic and advanced statistics needed by most users.
• "Statistix gives the user easy access to all the common tools of data analysis
• Fast Computes lightening fast. No time consuming disk access needed
• Data are memory resident.
• "Statistix is fast, very fast.
APPLICATIONS
• quantitative research cannot be done effectively without SS
• It helps professionals to interact with data thereby paving way for creativity
and innovation
• user friendly interface with drop-down tips
• allowed experts greater freedom to come out with results within twinkle of
eye than ever before where it takes time to finish analysis
• It has been discovered that some analysis such as post Hoc, complex
analysis in time series, regression and variance analysis cannot be
calculated manually effectively without statistical software packages
• statistical software has contributed immensely to social research especially
in the area of demographic and data analysis
• Statistical software packages have been discovered to help academic
staffs in higher institution to improve their research expertise by attending
training on usage of statistical packages.
• Statistical packages make research work robust and faster.
• It was discovered that 81% efficiency of staff in statistical software is
determine by the years of experience in usage and the area of
specialization.
• Most reason for using statistical software is its easy usage, suitability for
many statistical analysis
• While reason for non usage range from lack of attention to learn, difficult
usage, cost of licensing
• statistical software are not expensive neither are they too difficult to use
but people do not give attention to its learning
• To provide magnitude of any health problem in community
• To findout basic factors underlying ill-health
• To calculate sample size from large population
• To calculate survival rates of varius diseases
• To determine association between two variables
• To study prevalence & incidence of disease
• To findout odd ratio ,relative risk ,attributable risk in case controll &
cohort
• To find out normal distribution of disease
• To test usefullness of both sera & vaccines
• Role of causative factors in disease
• To introdue & promote health legislation
• To evaluate the activity of drug
• To explore changes produced by drug are whether due to action of
drug or by chance
• To compare the actions of two or more different drugs
• To find out association between disease & risk factor like coronary
artery disease & smoking
• Population genetics inorder to findout variation in genotype &
phenotype
• Genomics & Proteomics
• Demography
• Education
• Government
• Marketing organizations
• NGO’s
• Telecommunication
• Banking
• Insurance
• Healthcare
• Manufacturing
• Social science
• Health scinece
• Pharmacy
• Economics
THANKYOU
Statistical software packages ,their layout & applications

More Related Content

What's hot

Classification of data
Classification of dataClassification of data
Statistics in nursing research
Statistics in nursing researchStatistics in nursing research
Statistics in nursing research
Nursing Path
 
Data collection - Nursing research
Data collection - Nursing researchData collection - Nursing research
Data collection - Nursing research
RVS Institute of Health Sciences, Sulur, Coimbatore
 
Research process quantitative and qualitative
Research process  quantitative and qualitativeResearch process  quantitative and qualitative
Research process quantitative and qualitative
EMERENSIA X
 
Analysis of data
Analysis of dataAnalysis of data
Analysis of data
TanirikaGodiyal
 
Basic stat analysis using excel
Basic stat analysis using excelBasic stat analysis using excel
Basic stat analysis using excel
Parag Shah
 
Coefficient of correlation...ppt
Coefficient of correlation...pptCoefficient of correlation...ppt
Coefficient of correlation...ppt
Rahul Dhaker
 
Statstics in nursing
Statstics in nursing Statstics in nursing
Statstics in nursing
Monika Devi NR
 
Babitha's Note on Unit 01: Introduction to Research & Research Process
Babitha's Note on Unit 01: Introduction to Research & Research ProcessBabitha's Note on Unit 01: Introduction to Research & Research Process
Babitha's Note on Unit 01: Introduction to Research & Research Process
Babitha Devu
 
Review of Literature
 Review of Literature Review of Literature
Review of Literature
DR .PALLAVI PATHANIA
 
Presentation on spss
Presentation on spssPresentation on spss
Presentation on spss
alfiyajamalcj
 
Vital statistics
Vital statisticsVital statistics
Vital statistics
Soumya Ranjan Parida
 
Data collection,tabulation,processing and analysis
Data collection,tabulation,processing and analysisData collection,tabulation,processing and analysis
Data collection,tabulation,processing and analysis
RobinsonRaja1
 
statistics in nursing
 statistics in nursing statistics in nursing
statistics in nursing
Pratibha Srivastava
 
CINAHL
CINAHLCINAHL
Statistical software.pptx
Statistical software.pptxStatistical software.pptx
Statistical software.pptx
Subramani Parasuraman
 
Literature review
Literature reviewLiterature review
Literature review
DEVA PON PUSHPAM I
 
Pilot study
Pilot studyPilot study
Data analysis and Presentation
Data analysis and PresentationData analysis and Presentation
Data analysis and Presentation
Jignesh Kariya
 
Research and research process
Research and research processResearch and research process
Research and research process
Atul Yadav
 

What's hot (20)

Classification of data
Classification of dataClassification of data
Classification of data
 
Statistics in nursing research
Statistics in nursing researchStatistics in nursing research
Statistics in nursing research
 
Data collection - Nursing research
Data collection - Nursing researchData collection - Nursing research
Data collection - Nursing research
 
Research process quantitative and qualitative
Research process  quantitative and qualitativeResearch process  quantitative and qualitative
Research process quantitative and qualitative
 
Analysis of data
Analysis of dataAnalysis of data
Analysis of data
 
Basic stat analysis using excel
Basic stat analysis using excelBasic stat analysis using excel
Basic stat analysis using excel
 
Coefficient of correlation...ppt
Coefficient of correlation...pptCoefficient of correlation...ppt
Coefficient of correlation...ppt
 
Statstics in nursing
Statstics in nursing Statstics in nursing
Statstics in nursing
 
Babitha's Note on Unit 01: Introduction to Research & Research Process
Babitha's Note on Unit 01: Introduction to Research & Research ProcessBabitha's Note on Unit 01: Introduction to Research & Research Process
Babitha's Note on Unit 01: Introduction to Research & Research Process
 
Review of Literature
 Review of Literature Review of Literature
Review of Literature
 
Presentation on spss
Presentation on spssPresentation on spss
Presentation on spss
 
Vital statistics
Vital statisticsVital statistics
Vital statistics
 
Data collection,tabulation,processing and analysis
Data collection,tabulation,processing and analysisData collection,tabulation,processing and analysis
Data collection,tabulation,processing and analysis
 
statistics in nursing
 statistics in nursing statistics in nursing
statistics in nursing
 
CINAHL
CINAHLCINAHL
CINAHL
 
Statistical software.pptx
Statistical software.pptxStatistical software.pptx
Statistical software.pptx
 
Literature review
Literature reviewLiterature review
Literature review
 
Pilot study
Pilot studyPilot study
Pilot study
 
Data analysis and Presentation
Data analysis and PresentationData analysis and Presentation
Data analysis and Presentation
 
Research and research process
Research and research processResearch and research process
Research and research process
 

Similar to Statistical software packages ,their layout & applications

Educational satistics
Educational satisticsEducational satistics
Educational satistics
alagappa university, Karaikudi
 
Data Processing DOH Workshop.pptx
Data Processing DOH Workshop.pptxData Processing DOH Workshop.pptx
Data Processing DOH Workshop.pptx
charlslabarda
 
Software Programs for Data Analysis
Software Programs for Data AnalysisSoftware Programs for Data Analysis
Software Programs for Data Analysis
unmgrc
 
Spss as a research tool
Spss  as a research tool Spss  as a research tool
Spss as a research tool
Integral university, Lucknow
 
SPSS Assignment Answers
SPSS Assignment AnswersSPSS Assignment Answers
SPSS Assignment Answers
Lesa Cote
 
SOFTWARE USED IN P'epidemiology.pdf
SOFTWARE USED IN P'epidemiology.pdfSOFTWARE USED IN P'epidemiology.pdf
SOFTWARE USED IN P'epidemiology.pdf
varshawadnere
 
SEM 8 BIOSTATISTICS graphs minitab excel etc
SEM 8 BIOSTATISTICS graphs minitab excel etcSEM 8 BIOSTATISTICS graphs minitab excel etc
SEM 8 BIOSTATISTICS graphs minitab excel etc
KaishAamirPathan
 
Application of Excel and SPSS software for statistical analysis- Biostatistic...
Application of Excel and SPSS software for statistical analysis- Biostatistic...Application of Excel and SPSS software for statistical analysis- Biostatistic...
Application of Excel and SPSS software for statistical analysis- Biostatistic...
Himanshu Sharma
 
SPSS.pptx
SPSS.pptxSPSS.pptx
Computer assistance in statistical methods.28.04.2021
Computer assistance in statistical methods.28.04.2021Computer assistance in statistical methods.28.04.2021
Computer assistance in statistical methods.28.04.2021
DrAnjaliUpadhye
 
Application of excel and spss programme in statistical
Application of excel and spss programme in statisticalApplication of excel and spss programme in statistical
Application of excel and spss programme in statistical
VeenaV29
 
What is SPSS?
What is SPSS?What is SPSS?
Introduction to Computational Statistics
Introduction to Computational StatisticsIntroduction to Computational Statistics
Introduction to Computational Statistics
Setia Pramana
 
SAS - Statistical Analysis System
SAS - Statistical Analysis SystemSAS - Statistical Analysis System
SAS - Statistical Analysis System
Dr-Jitendra Patel
 
SPSS.pptx(unit 4).pptx
SPSS.pptx(unit 4).pptxSPSS.pptx(unit 4).pptx
SPSS.pptx(unit 4).pptx
JOSEPHINELENTAF
 
Introducing The R Software
Introducing The R Software  Introducing The R Software
Introducing The R Software
Kamarul Imran
 
Data Science.pptx NEW COURICUUMN IN DATA
Data Science.pptx NEW COURICUUMN IN DATAData Science.pptx NEW COURICUUMN IN DATA
Data Science.pptx NEW COURICUUMN IN DATA
javed75
 
SEO Asset (PPT) Comparing Python, R, and SAS Overcoming Training Data Set Cha...
SEO Asset (PPT) Comparing Python, R, and SAS Overcoming Training Data Set Cha...SEO Asset (PPT) Comparing Python, R, and SAS Overcoming Training Data Set Cha...
SEO Asset (PPT) Comparing Python, R, and SAS Overcoming Training Data Set Cha...
Stats Statswork
 
Comparing Python, R, and SAS Overcoming Training Data Set Challenges.pptx
Comparing Python, R, and SAS Overcoming Training Data Set Challenges.pptxComparing Python, R, and SAS Overcoming Training Data Set Challenges.pptx
Comparing Python, R, and SAS Overcoming Training Data Set Challenges.pptx
statswork100
 
LSESU a Taste of R Language Workshop
LSESU a Taste of R Language WorkshopLSESU a Taste of R Language Workshop
LSESU a Taste of R Language Workshop
Korkrid Akepanidtaworn
 

Similar to Statistical software packages ,their layout & applications (20)

Educational satistics
Educational satisticsEducational satistics
Educational satistics
 
Data Processing DOH Workshop.pptx
Data Processing DOH Workshop.pptxData Processing DOH Workshop.pptx
Data Processing DOH Workshop.pptx
 
Software Programs for Data Analysis
Software Programs for Data AnalysisSoftware Programs for Data Analysis
Software Programs for Data Analysis
 
Spss as a research tool
Spss  as a research tool Spss  as a research tool
Spss as a research tool
 
SPSS Assignment Answers
SPSS Assignment AnswersSPSS Assignment Answers
SPSS Assignment Answers
 
SOFTWARE USED IN P'epidemiology.pdf
SOFTWARE USED IN P'epidemiology.pdfSOFTWARE USED IN P'epidemiology.pdf
SOFTWARE USED IN P'epidemiology.pdf
 
SEM 8 BIOSTATISTICS graphs minitab excel etc
SEM 8 BIOSTATISTICS graphs minitab excel etcSEM 8 BIOSTATISTICS graphs minitab excel etc
SEM 8 BIOSTATISTICS graphs minitab excel etc
 
Application of Excel and SPSS software for statistical analysis- Biostatistic...
Application of Excel and SPSS software for statistical analysis- Biostatistic...Application of Excel and SPSS software for statistical analysis- Biostatistic...
Application of Excel and SPSS software for statistical analysis- Biostatistic...
 
SPSS.pptx
SPSS.pptxSPSS.pptx
SPSS.pptx
 
Computer assistance in statistical methods.28.04.2021
Computer assistance in statistical methods.28.04.2021Computer assistance in statistical methods.28.04.2021
Computer assistance in statistical methods.28.04.2021
 
Application of excel and spss programme in statistical
Application of excel and spss programme in statisticalApplication of excel and spss programme in statistical
Application of excel and spss programme in statistical
 
What is SPSS?
What is SPSS?What is SPSS?
What is SPSS?
 
Introduction to Computational Statistics
Introduction to Computational StatisticsIntroduction to Computational Statistics
Introduction to Computational Statistics
 
SAS - Statistical Analysis System
SAS - Statistical Analysis SystemSAS - Statistical Analysis System
SAS - Statistical Analysis System
 
SPSS.pptx(unit 4).pptx
SPSS.pptx(unit 4).pptxSPSS.pptx(unit 4).pptx
SPSS.pptx(unit 4).pptx
 
Introducing The R Software
Introducing The R Software  Introducing The R Software
Introducing The R Software
 
Data Science.pptx NEW COURICUUMN IN DATA
Data Science.pptx NEW COURICUUMN IN DATAData Science.pptx NEW COURICUUMN IN DATA
Data Science.pptx NEW COURICUUMN IN DATA
 
SEO Asset (PPT) Comparing Python, R, and SAS Overcoming Training Data Set Cha...
SEO Asset (PPT) Comparing Python, R, and SAS Overcoming Training Data Set Cha...SEO Asset (PPT) Comparing Python, R, and SAS Overcoming Training Data Set Cha...
SEO Asset (PPT) Comparing Python, R, and SAS Overcoming Training Data Set Cha...
 
Comparing Python, R, and SAS Overcoming Training Data Set Challenges.pptx
Comparing Python, R, and SAS Overcoming Training Data Set Challenges.pptxComparing Python, R, and SAS Overcoming Training Data Set Challenges.pptx
Comparing Python, R, and SAS Overcoming Training Data Set Challenges.pptx
 
LSESU a Taste of R Language Workshop
LSESU a Taste of R Language WorkshopLSESU a Taste of R Language Workshop
LSESU a Taste of R Language Workshop
 

More from Neurosurgeon Mumtaz Ali Narejo

Meningioma presentation by dr,Mumtaz Ali narejo
Meningioma presentation by dr,Mumtaz Ali narejoMeningioma presentation by dr,Mumtaz Ali narejo
Meningioma presentation by dr,Mumtaz Ali narejo
Neurosurgeon Mumtaz Ali Narejo
 
Blue Printing in medical education by Dr.Mumtaz Ali.pptx
Blue Printing in medical education by Dr.Mumtaz Ali.pptxBlue Printing in medical education by Dr.Mumtaz Ali.pptx
Blue Printing in medical education by Dr.Mumtaz Ali.pptx
Neurosurgeon Mumtaz Ali Narejo
 
Endoscopic 3rd Ventriculostomy-DR.MUMTAZ ALI NAREJO.pptx
Endoscopic 3rd Ventriculostomy-DR.MUMTAZ ALI NAREJO.pptxEndoscopic 3rd Ventriculostomy-DR.MUMTAZ ALI NAREJO.pptx
Endoscopic 3rd Ventriculostomy-DR.MUMTAZ ALI NAREJO.pptx
Neurosurgeon Mumtaz Ali Narejo
 
head injury according to ATLS BY DR MUMTAZ ALI.pptx
head injury according to ATLS BY DR MUMTAZ ALI.pptxhead injury according to ATLS BY DR MUMTAZ ALI.pptx
head injury according to ATLS BY DR MUMTAZ ALI.pptx
Neurosurgeon Mumtaz Ali Narejo
 
Spine injury according to atls by dr mumtaz ali narejo.pptx
Spine injury according to atls by dr mumtaz ali narejo.pptxSpine injury according to atls by dr mumtaz ali narejo.pptx
Spine injury according to atls by dr mumtaz ali narejo.pptx
Neurosurgeon Mumtaz Ali Narejo
 
Neurofibromatosis Type.pptx
Neurofibromatosis Type.pptxNeurofibromatosis Type.pptx
Neurofibromatosis Type.pptx
Neurosurgeon Mumtaz Ali Narejo
 
Protein microarray.pptx
Protein microarray.pptxProtein microarray.pptx
Protein microarray.pptx
Neurosurgeon Mumtaz Ali Narejo
 
TRAUMATIC BRAIN INJURY - Copy.pptx
TRAUMATIC BRAIN INJURY - Copy.pptxTRAUMATIC BRAIN INJURY - Copy.pptx
TRAUMATIC BRAIN INJURY - Copy.pptx
Neurosurgeon Mumtaz Ali Narejo
 
Road Safty Presentation (2) (1).ppt
Road Safty Presentation (2) (1).pptRoad Safty Presentation (2) (1).ppt
Road Safty Presentation (2) (1).ppt
Neurosurgeon Mumtaz Ali Narejo
 
PRESENTATION OF SPINE INJURY BY DR.MUMTAZ ALI.ppt
PRESENTATION OF SPINE INJURY BY DR.MUMTAZ ALI.pptPRESENTATION OF SPINE INJURY BY DR.MUMTAZ ALI.ppt
PRESENTATION OF SPINE INJURY BY DR.MUMTAZ ALI.ppt
Neurosurgeon Mumtaz Ali Narejo
 
Spine lecture for Final year MBBS by Dr.Mumtaz Ali.pptx
Spine lecture for Final year MBBS by Dr.Mumtaz Ali.pptxSpine lecture for Final year MBBS by Dr.Mumtaz Ali.pptx
Spine lecture for Final year MBBS by Dr.Mumtaz Ali.pptx
Neurosurgeon Mumtaz Ali Narejo
 
Skeletal muscle excitation by dr mumtaz ali
Skeletal muscle excitation by dr mumtaz aliSkeletal muscle excitation by dr mumtaz ali
Skeletal muscle excitation by dr mumtaz ali
Neurosurgeon Mumtaz Ali Narejo
 
Skeletal muscle contraction by dr.mumtaz ali
Skeletal muscle contraction by dr.mumtaz aliSkeletal muscle contraction by dr.mumtaz ali
Skeletal muscle contraction by dr.mumtaz ali
Neurosurgeon Mumtaz Ali Narejo
 
Vestibular scwanomma (case pressentation)dr.mumtaz ali
Vestibular scwanomma (case pressentation)dr.mumtaz aliVestibular scwanomma (case pressentation)dr.mumtaz ali
Vestibular scwanomma (case pressentation)dr.mumtaz ali
Neurosurgeon Mumtaz Ali Narejo
 
Spinal schwannoma(case presentation) dr.mumtaz ali
Spinal schwannoma(case presentation) dr.mumtaz aliSpinal schwannoma(case presentation) dr.mumtaz ali
Spinal schwannoma(case presentation) dr.mumtaz ali
Neurosurgeon Mumtaz Ali Narejo
 
Spinal ependymoma (case presentation)dr.mumtaz ali
Spinal ependymoma (case presentation)dr.mumtaz aliSpinal ependymoma (case presentation)dr.mumtaz ali
Spinal ependymoma (case presentation)dr.mumtaz ali
Neurosurgeon Mumtaz Ali Narejo
 
Spinal meningioma (case presentation)dr.mumtaz ali
Spinal  meningioma (case presentation)dr.mumtaz aliSpinal  meningioma (case presentation)dr.mumtaz ali
Spinal meningioma (case presentation)dr.mumtaz ali
Neurosurgeon Mumtaz Ali Narejo
 
Right sphenoid wing meningioma (case presentation)dr.mumtaz a li
Right sphenoid wing meningioma (case presentation)dr.mumtaz a liRight sphenoid wing meningioma (case presentation)dr.mumtaz a li
Right sphenoid wing meningioma (case presentation)dr.mumtaz a li
Neurosurgeon Mumtaz Ali Narejo
 
Orbital tumor (case presentation)dr.mumtaz ali
Orbital tumor (case presentation)dr.mumtaz aliOrbital tumor (case presentation)dr.mumtaz ali
Orbital tumor (case presentation)dr.mumtaz ali
Neurosurgeon Mumtaz Ali Narejo
 
Olfactory groove meningioma(case presentation) dr.mumtaz ali
Olfactory groove meningioma(case presentation) dr.mumtaz aliOlfactory groove meningioma(case presentation) dr.mumtaz ali
Olfactory groove meningioma(case presentation) dr.mumtaz ali
Neurosurgeon Mumtaz Ali Narejo
 

More from Neurosurgeon Mumtaz Ali Narejo (20)

Meningioma presentation by dr,Mumtaz Ali narejo
Meningioma presentation by dr,Mumtaz Ali narejoMeningioma presentation by dr,Mumtaz Ali narejo
Meningioma presentation by dr,Mumtaz Ali narejo
 
Blue Printing in medical education by Dr.Mumtaz Ali.pptx
Blue Printing in medical education by Dr.Mumtaz Ali.pptxBlue Printing in medical education by Dr.Mumtaz Ali.pptx
Blue Printing in medical education by Dr.Mumtaz Ali.pptx
 
Endoscopic 3rd Ventriculostomy-DR.MUMTAZ ALI NAREJO.pptx
Endoscopic 3rd Ventriculostomy-DR.MUMTAZ ALI NAREJO.pptxEndoscopic 3rd Ventriculostomy-DR.MUMTAZ ALI NAREJO.pptx
Endoscopic 3rd Ventriculostomy-DR.MUMTAZ ALI NAREJO.pptx
 
head injury according to ATLS BY DR MUMTAZ ALI.pptx
head injury according to ATLS BY DR MUMTAZ ALI.pptxhead injury according to ATLS BY DR MUMTAZ ALI.pptx
head injury according to ATLS BY DR MUMTAZ ALI.pptx
 
Spine injury according to atls by dr mumtaz ali narejo.pptx
Spine injury according to atls by dr mumtaz ali narejo.pptxSpine injury according to atls by dr mumtaz ali narejo.pptx
Spine injury according to atls by dr mumtaz ali narejo.pptx
 
Neurofibromatosis Type.pptx
Neurofibromatosis Type.pptxNeurofibromatosis Type.pptx
Neurofibromatosis Type.pptx
 
Protein microarray.pptx
Protein microarray.pptxProtein microarray.pptx
Protein microarray.pptx
 
TRAUMATIC BRAIN INJURY - Copy.pptx
TRAUMATIC BRAIN INJURY - Copy.pptxTRAUMATIC BRAIN INJURY - Copy.pptx
TRAUMATIC BRAIN INJURY - Copy.pptx
 
Road Safty Presentation (2) (1).ppt
Road Safty Presentation (2) (1).pptRoad Safty Presentation (2) (1).ppt
Road Safty Presentation (2) (1).ppt
 
PRESENTATION OF SPINE INJURY BY DR.MUMTAZ ALI.ppt
PRESENTATION OF SPINE INJURY BY DR.MUMTAZ ALI.pptPRESENTATION OF SPINE INJURY BY DR.MUMTAZ ALI.ppt
PRESENTATION OF SPINE INJURY BY DR.MUMTAZ ALI.ppt
 
Spine lecture for Final year MBBS by Dr.Mumtaz Ali.pptx
Spine lecture for Final year MBBS by Dr.Mumtaz Ali.pptxSpine lecture for Final year MBBS by Dr.Mumtaz Ali.pptx
Spine lecture for Final year MBBS by Dr.Mumtaz Ali.pptx
 
Skeletal muscle excitation by dr mumtaz ali
Skeletal muscle excitation by dr mumtaz aliSkeletal muscle excitation by dr mumtaz ali
Skeletal muscle excitation by dr mumtaz ali
 
Skeletal muscle contraction by dr.mumtaz ali
Skeletal muscle contraction by dr.mumtaz aliSkeletal muscle contraction by dr.mumtaz ali
Skeletal muscle contraction by dr.mumtaz ali
 
Vestibular scwanomma (case pressentation)dr.mumtaz ali
Vestibular scwanomma (case pressentation)dr.mumtaz aliVestibular scwanomma (case pressentation)dr.mumtaz ali
Vestibular scwanomma (case pressentation)dr.mumtaz ali
 
Spinal schwannoma(case presentation) dr.mumtaz ali
Spinal schwannoma(case presentation) dr.mumtaz aliSpinal schwannoma(case presentation) dr.mumtaz ali
Spinal schwannoma(case presentation) dr.mumtaz ali
 
Spinal ependymoma (case presentation)dr.mumtaz ali
Spinal ependymoma (case presentation)dr.mumtaz aliSpinal ependymoma (case presentation)dr.mumtaz ali
Spinal ependymoma (case presentation)dr.mumtaz ali
 
Spinal meningioma (case presentation)dr.mumtaz ali
Spinal  meningioma (case presentation)dr.mumtaz aliSpinal  meningioma (case presentation)dr.mumtaz ali
Spinal meningioma (case presentation)dr.mumtaz ali
 
Right sphenoid wing meningioma (case presentation)dr.mumtaz a li
Right sphenoid wing meningioma (case presentation)dr.mumtaz a liRight sphenoid wing meningioma (case presentation)dr.mumtaz a li
Right sphenoid wing meningioma (case presentation)dr.mumtaz a li
 
Orbital tumor (case presentation)dr.mumtaz ali
Orbital tumor (case presentation)dr.mumtaz aliOrbital tumor (case presentation)dr.mumtaz ali
Orbital tumor (case presentation)dr.mumtaz ali
 
Olfactory groove meningioma(case presentation) dr.mumtaz ali
Olfactory groove meningioma(case presentation) dr.mumtaz aliOlfactory groove meningioma(case presentation) dr.mumtaz ali
Olfactory groove meningioma(case presentation) dr.mumtaz ali
 

Recently uploaded

Measures in SQL (SIGMOD 2024, Santiago, Chile)
Measures in SQL (SIGMOD 2024, Santiago, Chile)Measures in SQL (SIGMOD 2024, Santiago, Chile)
Measures in SQL (SIGMOD 2024, Santiago, Chile)
Julian Hyde
 
UI5con 2024 - Boost Your Development Experience with UI5 Tooling Extensions
UI5con 2024 - Boost Your Development Experience with UI5 Tooling ExtensionsUI5con 2024 - Boost Your Development Experience with UI5 Tooling Extensions
UI5con 2024 - Boost Your Development Experience with UI5 Tooling Extensions
Peter Muessig
 
Transform Your Communication with Cloud-Based IVR Solutions
Transform Your Communication with Cloud-Based IVR SolutionsTransform Your Communication with Cloud-Based IVR Solutions
Transform Your Communication with Cloud-Based IVR Solutions
TheSMSPoint
 
Energy consumption of Database Management - Florina Jonuzi
Energy consumption of Database Management - Florina JonuziEnergy consumption of Database Management - Florina Jonuzi
Energy consumption of Database Management - Florina Jonuzi
Green Software Development
 
OpenMetadata Community Meeting - 5th June 2024
OpenMetadata Community Meeting - 5th June 2024OpenMetadata Community Meeting - 5th June 2024
OpenMetadata Community Meeting - 5th June 2024
OpenMetadata
 
E-Invoicing Implementation: A Step-by-Step Guide for Saudi Arabian Companies
E-Invoicing Implementation: A Step-by-Step Guide for Saudi Arabian CompaniesE-Invoicing Implementation: A Step-by-Step Guide for Saudi Arabian Companies
E-Invoicing Implementation: A Step-by-Step Guide for Saudi Arabian Companies
Quickdice ERP
 
Unveiling the Advantages of Agile Software Development.pdf
Unveiling the Advantages of Agile Software Development.pdfUnveiling the Advantages of Agile Software Development.pdf
Unveiling the Advantages of Agile Software Development.pdf
brainerhub1
 
Microservice Teams - How the cloud changes the way we work
Microservice Teams - How the cloud changes the way we workMicroservice Teams - How the cloud changes the way we work
Microservice Teams - How the cloud changes the way we work
Sven Peters
 
ALGIT - Assembly Line for Green IT - Numbers, Data, Facts
ALGIT - Assembly Line for Green IT - Numbers, Data, FactsALGIT - Assembly Line for Green IT - Numbers, Data, Facts
ALGIT - Assembly Line for Green IT - Numbers, Data, Facts
Green Software Development
 
Introducing Crescat - Event Management Software for Venues, Festivals and Eve...
Introducing Crescat - Event Management Software for Venues, Festivals and Eve...Introducing Crescat - Event Management Software for Venues, Festivals and Eve...
Introducing Crescat - Event Management Software for Venues, Festivals and Eve...
Crescat
 
openEuler Case Study - The Journey to Supply Chain Security
openEuler Case Study - The Journey to Supply Chain SecurityopenEuler Case Study - The Journey to Supply Chain Security
openEuler Case Study - The Journey to Supply Chain Security
Shane Coughlan
 
SWEBOK and Education at FUSE Okinawa 2024
SWEBOK and Education at FUSE Okinawa 2024SWEBOK and Education at FUSE Okinawa 2024
SWEBOK and Education at FUSE Okinawa 2024
Hironori Washizaki
 
Need for Speed: Removing speed bumps from your Symfony projects ⚡️
Need for Speed: Removing speed bumps from your Symfony projects ⚡️Need for Speed: Removing speed bumps from your Symfony projects ⚡️
Need for Speed: Removing speed bumps from your Symfony projects ⚡️
Łukasz Chruściel
 
Artificia Intellicence and XPath Extension Functions
Artificia Intellicence and XPath Extension FunctionsArtificia Intellicence and XPath Extension Functions
Artificia Intellicence and XPath Extension Functions
Octavian Nadolu
 
Oracle Database 19c New Features for DBAs and Developers.pptx
Oracle Database 19c New Features for DBAs and Developers.pptxOracle Database 19c New Features for DBAs and Developers.pptx
Oracle Database 19c New Features for DBAs and Developers.pptx
Remote DBA Services
 
Why Choose Odoo 17 Community & How it differs from Odoo 17 Enterprise Edition
Why Choose Odoo 17 Community & How it differs from Odoo 17 Enterprise EditionWhy Choose Odoo 17 Community & How it differs from Odoo 17 Enterprise Edition
Why Choose Odoo 17 Community & How it differs from Odoo 17 Enterprise Edition
Envertis Software Solutions
 
UI5con 2024 - Keynote: Latest News about UI5 and it’s Ecosystem
UI5con 2024 - Keynote: Latest News about UI5 and it’s EcosystemUI5con 2024 - Keynote: Latest News about UI5 and it’s Ecosystem
UI5con 2024 - Keynote: Latest News about UI5 and it’s Ecosystem
Peter Muessig
 
原版定制美国纽约州立大学奥尔巴尼分校毕业证学位证书原版一模一样
原版定制美国纽约州立大学奥尔巴尼分校毕业证学位证书原版一模一样原版定制美国纽约州立大学奥尔巴尼分校毕业证学位证书原版一模一样
原版定制美国纽约州立大学奥尔巴尼分校毕业证学位证书原版一模一样
mz5nrf0n
 
Using Query Store in Azure PostgreSQL to Understand Query Performance
Using Query Store in Azure PostgreSQL to Understand Query PerformanceUsing Query Store in Azure PostgreSQL to Understand Query Performance
Using Query Store in Azure PostgreSQL to Understand Query Performance
Grant Fritchey
 
A Study of Variable-Role-based Feature Enrichment in Neural Models of Code
A Study of Variable-Role-based Feature Enrichment in Neural Models of CodeA Study of Variable-Role-based Feature Enrichment in Neural Models of Code
A Study of Variable-Role-based Feature Enrichment in Neural Models of Code
Aftab Hussain
 

Recently uploaded (20)

Measures in SQL (SIGMOD 2024, Santiago, Chile)
Measures in SQL (SIGMOD 2024, Santiago, Chile)Measures in SQL (SIGMOD 2024, Santiago, Chile)
Measures in SQL (SIGMOD 2024, Santiago, Chile)
 
UI5con 2024 - Boost Your Development Experience with UI5 Tooling Extensions
UI5con 2024 - Boost Your Development Experience with UI5 Tooling ExtensionsUI5con 2024 - Boost Your Development Experience with UI5 Tooling Extensions
UI5con 2024 - Boost Your Development Experience with UI5 Tooling Extensions
 
Transform Your Communication with Cloud-Based IVR Solutions
Transform Your Communication with Cloud-Based IVR SolutionsTransform Your Communication with Cloud-Based IVR Solutions
Transform Your Communication with Cloud-Based IVR Solutions
 
Energy consumption of Database Management - Florina Jonuzi
Energy consumption of Database Management - Florina JonuziEnergy consumption of Database Management - Florina Jonuzi
Energy consumption of Database Management - Florina Jonuzi
 
OpenMetadata Community Meeting - 5th June 2024
OpenMetadata Community Meeting - 5th June 2024OpenMetadata Community Meeting - 5th June 2024
OpenMetadata Community Meeting - 5th June 2024
 
E-Invoicing Implementation: A Step-by-Step Guide for Saudi Arabian Companies
E-Invoicing Implementation: A Step-by-Step Guide for Saudi Arabian CompaniesE-Invoicing Implementation: A Step-by-Step Guide for Saudi Arabian Companies
E-Invoicing Implementation: A Step-by-Step Guide for Saudi Arabian Companies
 
Unveiling the Advantages of Agile Software Development.pdf
Unveiling the Advantages of Agile Software Development.pdfUnveiling the Advantages of Agile Software Development.pdf
Unveiling the Advantages of Agile Software Development.pdf
 
Microservice Teams - How the cloud changes the way we work
Microservice Teams - How the cloud changes the way we workMicroservice Teams - How the cloud changes the way we work
Microservice Teams - How the cloud changes the way we work
 
ALGIT - Assembly Line for Green IT - Numbers, Data, Facts
ALGIT - Assembly Line for Green IT - Numbers, Data, FactsALGIT - Assembly Line for Green IT - Numbers, Data, Facts
ALGIT - Assembly Line for Green IT - Numbers, Data, Facts
 
Introducing Crescat - Event Management Software for Venues, Festivals and Eve...
Introducing Crescat - Event Management Software for Venues, Festivals and Eve...Introducing Crescat - Event Management Software for Venues, Festivals and Eve...
Introducing Crescat - Event Management Software for Venues, Festivals and Eve...
 
openEuler Case Study - The Journey to Supply Chain Security
openEuler Case Study - The Journey to Supply Chain SecurityopenEuler Case Study - The Journey to Supply Chain Security
openEuler Case Study - The Journey to Supply Chain Security
 
SWEBOK and Education at FUSE Okinawa 2024
SWEBOK and Education at FUSE Okinawa 2024SWEBOK and Education at FUSE Okinawa 2024
SWEBOK and Education at FUSE Okinawa 2024
 
Need for Speed: Removing speed bumps from your Symfony projects ⚡️
Need for Speed: Removing speed bumps from your Symfony projects ⚡️Need for Speed: Removing speed bumps from your Symfony projects ⚡️
Need for Speed: Removing speed bumps from your Symfony projects ⚡️
 
Artificia Intellicence and XPath Extension Functions
Artificia Intellicence and XPath Extension FunctionsArtificia Intellicence and XPath Extension Functions
Artificia Intellicence and XPath Extension Functions
 
Oracle Database 19c New Features for DBAs and Developers.pptx
Oracle Database 19c New Features for DBAs and Developers.pptxOracle Database 19c New Features for DBAs and Developers.pptx
Oracle Database 19c New Features for DBAs and Developers.pptx
 
Why Choose Odoo 17 Community & How it differs from Odoo 17 Enterprise Edition
Why Choose Odoo 17 Community & How it differs from Odoo 17 Enterprise EditionWhy Choose Odoo 17 Community & How it differs from Odoo 17 Enterprise Edition
Why Choose Odoo 17 Community & How it differs from Odoo 17 Enterprise Edition
 
UI5con 2024 - Keynote: Latest News about UI5 and it’s Ecosystem
UI5con 2024 - Keynote: Latest News about UI5 and it’s EcosystemUI5con 2024 - Keynote: Latest News about UI5 and it’s Ecosystem
UI5con 2024 - Keynote: Latest News about UI5 and it’s Ecosystem
 
原版定制美国纽约州立大学奥尔巴尼分校毕业证学位证书原版一模一样
原版定制美国纽约州立大学奥尔巴尼分校毕业证学位证书原版一模一样原版定制美国纽约州立大学奥尔巴尼分校毕业证学位证书原版一模一样
原版定制美国纽约州立大学奥尔巴尼分校毕业证学位证书原版一模一样
 
Using Query Store in Azure PostgreSQL to Understand Query Performance
Using Query Store in Azure PostgreSQL to Understand Query PerformanceUsing Query Store in Azure PostgreSQL to Understand Query Performance
Using Query Store in Azure PostgreSQL to Understand Query Performance
 
A Study of Variable-Role-based Feature Enrichment in Neural Models of Code
A Study of Variable-Role-based Feature Enrichment in Neural Models of CodeA Study of Variable-Role-based Feature Enrichment in Neural Models of Code
A Study of Variable-Role-based Feature Enrichment in Neural Models of Code
 

Statistical software packages ,their layout & applications

  • 1. STATISTICAL SOFTWARES PACKAGES , LAYOUT & APPLICATIONS DR.MUMTAZ ALI NAREJO PhD STUDENT S.A.L.U KHAIRPUR MIRS
  • 2. OUTLINES • Introduction • Common features • Advantages • Types • Most common packages • Layout • Applications
  • 3. STATISTICAL SOFTWARE • Specialized programs=>complex statistical analysis • organization =>collection ,interpretation , analysis , calculations , presentation of data • vital tool for research analysis, data validation and findings • Statistical solutions => statistical analysis • capabilities =>support & analysis methodologies regression analysis predictive analysis statistical modelling
  • 4. • data scientists and mathematicians • industry-specific features • avoid routine mathematical mistakes and produce accurate figures • features tailored to scientific research, cost modelling, or health • Qualities: Package statistical analysis capabilities, equations, and models Facilitate data importing, preparation and modelling Perform complex statistical analysis Compare Statistical Analysis Software  improve in the quality of research
  • 5. COMMON FEATURES OF STATISTICAL SOFTWARES • common characteristics that make reliable & suitable for data analysis • Data editor is in rows & columns : very easy to enter numeric data • availability of menu bar comprises drop-down menu, quick analysis as well as brief user manual • Statistical level of measurement is put into consideration in data entry • Getting your data ready to enter into the software • Defining and labeling variable • Entering data appropriately with each row containing each case and each column as variable
  • 6. • Data checking and cleaning is possible • All data should be numeric • Data exploration can be done to check for errors and other accuracy • The statistical level of significance for rejecting null hypothesis (Ho) is when your p-value significance is less than 0.05 • Time & cost effective
  • 7. ADVANTAGES OF STATISTICAL SOFTWARE • Accuracy & speed • Varsality • Validity • Graphics • Flexibilty • New variables • Volume of data • Easy transfer of data • Easy compilation , tabulation ,Diagramatics prrsentaion • averages , co-efficients of variation ,standard deviation error & percentiles
  • 8.
  • 9. TYPES OF STATISTICAL SOFTWARE PACKAGES • Open source • Public domain • Freeware • Proprietary
  • 10. OPEN SOURCE STATISTICAL SOFTWARE PACKAGES • ADMB : Non-linear statistical modelling on C++ • DAP : Free replecement for SAS • FITYK : Non-linear regression • OPENEPI : Web-based , open source , independent for epidiomiology & STATISTICS • SCIPY: Regression , plotting , anova • PSPP : Free & alternative to IBM SPSS • R : A free implementation of S
  • 11. PUBLIC DOMAIN STATISTICAL SOFTWARE PACKAGES • CSPRO : Developed : US census beureau & ICF international Used : entering , editing , tabulating , mapping , disseminting census & surveying data • EPI-INFO : Epidemiology Developed : centre for disease controll & prevention in Atlanta & georgia (USA) used : electronic survey creation , data entry , Analysis (t-test & Anova) • X-12 -ARIMA :  Developed : US census beureau Use : seasonal variations
  • 12. FREEWARE STATISTICAL SOFTWARE PACKAGES • WINBUGS : Baysian analysis  use markov chain monte carlos methods • WINPEPI : Epidemilogy
  • 13. PROPRIETARY STATISTICAL SOFTWARE PACKAGES • GRAPHPAD INSTAT : very simple , lots guidance & explanation • GRAPHPAD PRISM : biostatistic , non-linear regression & explanations • IBM SPSS STATISTICS: comprehensive statistical package • IBM SPSS MODELER: Comprehemsive data mining & text anaylsis • MATLAB : programming language with statistical features • SAS : comprehensive statistical package • SPSS : social science • STATS DIRECT : biomedical , public health & general health science
  • 14. MICROSOFT ADDON STATISTICAL SOFTWARE PACKAGES • ANALYSE IT : analysis • NUM XL : general statistics & economics • REGRESS IT : multivariate data analysis & linear regression(freeware) • SIGMA XL : statistical & graphical analysis • SPC XL : general statistics • STATS HELPER : descriptive statistics & six sigma
  • 15. MOST COMMON STATISTICAL SOFTWARE PACKAGES IN SOCIAL SCIENCE • MS-EXCEL • SPSS • GRAPHPAD INSTAT • GRAPHPAD PRISM • STATISTIX
  • 16. MICROSOFT EXCEL • Part of the Microsoft Office suite of programs • Excel version 1.0 was first released in 1985 • latest version Excel 2016 • most popular software application worldwide • Good points: Extremely easy to use and interchanges nicely with other Microsoft products Excel to analyze data, for example, in accounts, budgets, billing and many other areas Excel spreadsheets can be read by many other statistical packages Add on module which is part of Excel for undertaking basic statistical analyses Can produce very nice graphs
  • 17. • Bad points : Good in only general statistics but poor in regression analysis ,logistic regression ,survival , variance , Factor & multivariate analysis Excel is designed for financial calculations, although it is possible to use it for many other things Cannot undertake more sophisticated statistical analyses without purchase of expensive commercial add ons. • Availability Microsoft software already installed For blue-plated (UniSA) computers, contact the IT Help Desk to install the latest Microsoft office software For your own computer, you can always purchase Microsoft Office from a retail store.
  • 18.
  • 19.
  • 20.
  • 21. SPSS • Statistical Package for the Social Sciences • Version 1 being released in 1968, well before the advent of desktop computers • It is now on Version 23 • Data editor ,output viewer , syntax editor , script window • Good points : Very easy to learn and use Can use either with menus or syntax files Quite good graphics Excels at descriptive statistics,testing hypothesis , co-relation, basic regression analysis, analysis of variance, and some newer techniques such as Classification and Regression Trees (CART) Has its own structural equation modelling software AMOS, that dovetails with SPSS
  • 22. • Bad points : Focus is on statistical methods mainly used in the social sciences, market research and psychology Has advanced regression modelling procedures such as LMM and GEE, but they are awful to use with very obscure syntax Has few of the more powerful techniques required in epidemiological analysis, such as competing risk analysis or standardised rates  Availability : SPSS is available on blue-plated (UniSA) computers contact the IT Help Desk to install it
  • 23.
  • 24.
  • 25.
  • 26. SAS • Statistical Analysis System • North Carolina State University in 1966 • contemporary with SPSS • Good points : Can use either with menus or syntax files Much more powerful than SPSS  "power users" like because of its power and programmability Commonly used for data management in clinical trials • Bad points : Harder & longer time to learn and use than SPSS  number of records is generally limited to the size of your hard disk. • Availability : To organise installation contact the IT Help Desk
  • 27.
  • 28. STATA • more recent statistical package with Version 1 being released in 1985 • popular in the areas of epidemiology and economics • We are now on Version 14 • available for Windows, Unix, and Mac computers • Good points : Can use either with menus or syntax files Much more powerful than SPSS – probably equivalent to SAS Excels at advanced regression modelling Has its own in-built structural equation modelling Has a good suite of epidemiological procedures Researchers around the world write their own procedures in Stata
  • 29. • powerful statistical package with smart data-management facilities • an excellent system for producing publication-quality graphs • a wide array of up-to-date statistical techniques • Bad points : Harder to learn and use than SPSS most general statistical analyses (regression, logistic regression, survival analysis, analysis of variance, factor analysis, multivariate analysis and time series analysis Does not yet have some specialised techniques such as CART or Partial Least squares regression • Availability : Stata can be downloaded onto blue-plated computers by contacting the IT Help Desk Students can purchase a full copy with a perpetual license from the Australian distributors (Survey Design and Analysis) for about $200
  • 30.
  • 31. R • S-plus is a statistical programming language developed in Seattle in 1988 • R is a free version of S-plus developed in 1996 • it is a programming language and environment • richest statistical systems contain impressive amount of libraries, growing each day • Good points Very powerful – easily matches or even surpasses many of the models found in SAS or Statas Researchers around the world write their own procedures in R • Bad points Much harder to learn and use than SAS or Stata general statistical analysis • Availability http://cran.csiro.au/
  • 32. MINITAB • used by educators, students, scientists, business associates and researchers in a multitude of areas • developed around 1990 • one of the oldest statistical software programs available • has compatibility with PC, Macintosh, Linux • GOOD POINTS:  easiest statistical software programs to use  popular choice with those new statistical software. With drop-down menus and dialog boxes describing how and what to do next persists as a popular choice for teaching students about statistics and data analysis  primarily has a user base of educators using the program to show students research methods and analysis
  • 33. • BAD POINTS : performs most general statistical analyses (regression, logistic regression, survival analysis, analysis of variance, factor analysis has its weaknesses in general linear model (GLM) and Multilevel regression)
  • 36.
  • 37. Creating graphs & chart in minitab
  • 39.
  • 40.
  • 41. GRAPHPAD PRISM • written by Harvey Motulsky in 1989 • 2D graphics , curve fitting & statistical software for windows • Good Points : Non-linear regression & removal of outliers  comparisons of models & curves, interpolation of standard curves  automatic updating of results and graphs functionality for displaying error bars Built in formulae, batch processing and standardisation features, along with automated analysis and data validation makes GraphPad Prism a popular software amongst users
  • 42.
  • 43.
  • 44. STATISTIX • Statistix is a powerful statistical analysis program you can use to quickly analyze your data • Easy to Learn and Use • Completely menu-driven, procedures are specified using concise Windows-style dialog boxes. • Reliable • Developed in 1985 • Comprehensive • Statistix performs all the basic and advanced statistics needed by most users. • "Statistix gives the user easy access to all the common tools of data analysis • Fast Computes lightening fast. No time consuming disk access needed • Data are memory resident. • "Statistix is fast, very fast.
  • 45.
  • 46.
  • 47.
  • 48.
  • 49. APPLICATIONS • quantitative research cannot be done effectively without SS • It helps professionals to interact with data thereby paving way for creativity and innovation • user friendly interface with drop-down tips • allowed experts greater freedom to come out with results within twinkle of eye than ever before where it takes time to finish analysis • It has been discovered that some analysis such as post Hoc, complex analysis in time series, regression and variance analysis cannot be calculated manually effectively without statistical software packages • statistical software has contributed immensely to social research especially in the area of demographic and data analysis
  • 50. • Statistical software packages have been discovered to help academic staffs in higher institution to improve their research expertise by attending training on usage of statistical packages. • Statistical packages make research work robust and faster. • It was discovered that 81% efficiency of staff in statistical software is determine by the years of experience in usage and the area of specialization. • Most reason for using statistical software is its easy usage, suitability for many statistical analysis • While reason for non usage range from lack of attention to learn, difficult usage, cost of licensing • statistical software are not expensive neither are they too difficult to use but people do not give attention to its learning
  • 51. • To provide magnitude of any health problem in community • To findout basic factors underlying ill-health • To calculate sample size from large population • To calculate survival rates of varius diseases • To determine association between two variables • To study prevalence & incidence of disease • To findout odd ratio ,relative risk ,attributable risk in case controll & cohort • To find out normal distribution of disease • To test usefullness of both sera & vaccines • Role of causative factors in disease • To introdue & promote health legislation
  • 52. • To evaluate the activity of drug • To explore changes produced by drug are whether due to action of drug or by chance • To compare the actions of two or more different drugs • To find out association between disease & risk factor like coronary artery disease & smoking • Population genetics inorder to findout variation in genotype & phenotype • Genomics & Proteomics • Demography
  • 53. • Education • Government • Marketing organizations • NGO’s • Telecommunication • Banking • Insurance • Healthcare • Manufacturing • Social science • Health scinece • Pharmacy • Economics