Download as PDF, PPTX

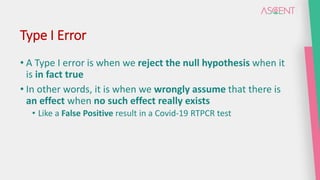
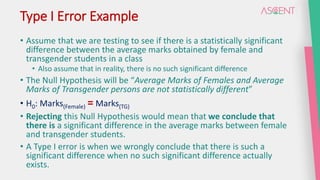
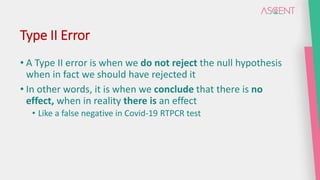
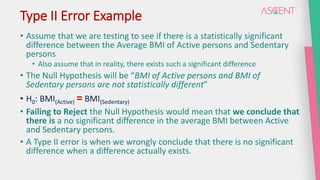

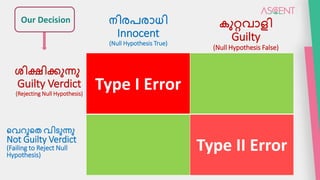
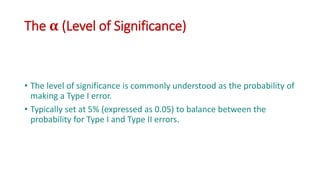

The document explains type I and type II errors in hypothesis testing, emphasizing that a type I error occurs when a true null hypothesis is incorrectly rejected, leading to a false positive. Conversely, a type II error happens when a false null hypothesis is not rejected, resulting in a false negative. The document highlights the importance of controlling type I errors in research, as they are considered more serious.


