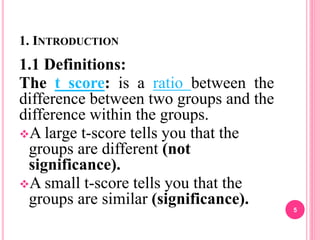
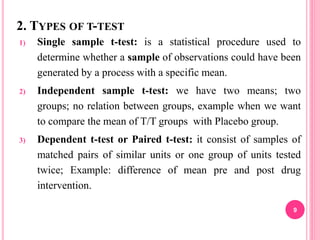
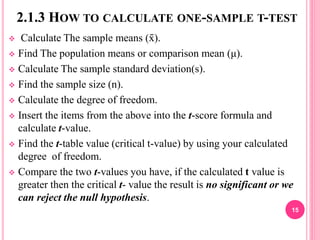
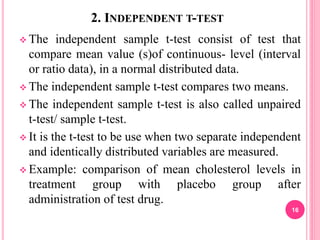
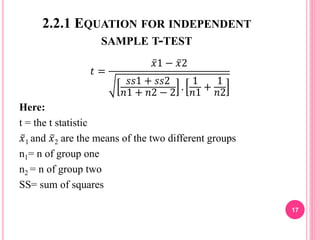
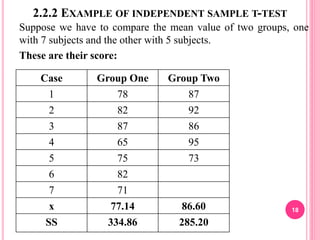
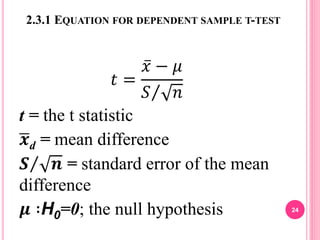
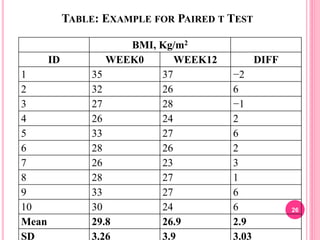
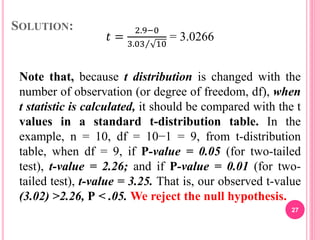
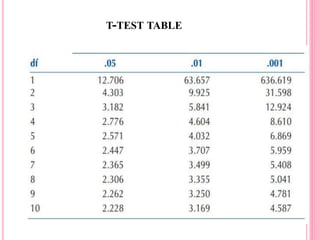
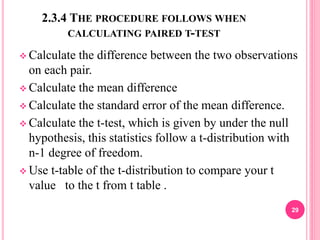
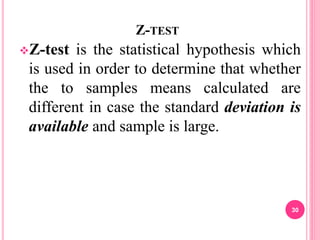
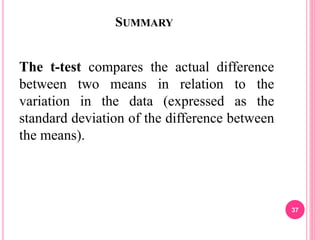
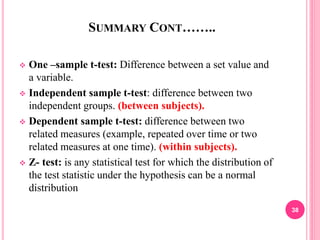
SlideShare a Scribd company logo
UNIVERSITY OF MEDICAL SCIENCE
AND TECHNOLOGY
Faculty of Pharmacy
Graduate college
M.Sc. of Pharmaceutical Analysis And Quality
Control
Batch (9)
Subject: Biostatistics
Presentation: the t-test
Prepared by
Mohamed Hersi Farah
Modether aldow
Aya Ahmed Salih Ahmed
Under the supervision of
Dr.Suleiman Abdgabbar Abdullah
28th of December 2019
1
2
OVERVIEW
1. Introduction
 Definitions
 Applications of t-test
2. Types of t-test
 Single sample t-test
Equation for one-sample t-test
Example of one-sample t-test
How to calculate one-sample t-test
 Independent t-test
Equation for independent sample t-test
Example of independent sample t-test
How to calculate independent t-test
3
OVERVIEW…..
 Dependent t-test or Paired t-test
Equation for dependent sample t-test
Example of dependent sample t-test
The procedure follows when calculating paired t-test
3. z-test.
 Comparison of t-test and z-test
 Formula to find the value of z-test is
 When do we use z-test
4. Summary
5. Reference
4
1. INTRODUCTION
1.1 Definitions:
The t score: is a ratio between the
difference between two groups and the
difference within the groups.
A large t-score tells you that the
groups are different (not
significance).
A small t-score tells you that the
groups are similar (significance).
5
INTRODUCTION………
A p-value: is the probability that the results
from your sample data occurred by chance. P-
values are from 0% to 100%. They are usually
written as a decimal. For example, a p value of
5% is 0.05. Low p-values are good. In most
cases, a p-value of 0.05 (5%) is accepted to
mean the data is valid.
6
INTRODUCTION……..
 A t-test: is a type of inferential statistic used to determine if
there is a significant difference between the means of two
groups, which may be related in certain features.
 The t test tells you how significant the differences between
groups are; In other words it lets you know if those differences
(measured in means/averages) could have happened by chance.
7
1.2 APPLICATIONS OF T-TEST
The calculations of a confidence interval
for a sample mean
To test whether a sample mean is different
from a hypothesized value
To compare mean two samples
To compare two sample means by group
8
2. TYPES OF T-TEST
1) Single sample t-test: is a statistical procedure used to
determine whether a sample of observations could have been
generated by a process with a specific mean.
2) Independent sample t-test: we have two means; two
groups; no relation between groups, example when we want
to compare the mean of T/T groups with Placebo group.
3) Dependent t-test or Paired t-test: it consist of samples of
matched pairs of similar units or one group of units tested
twice; Example: difference of mean pre and post drug
intervention.
9
2.1 SINGLE SAMPLE T-TEST
It is used in measuring whether a sample
value significantly differs from a
hypothesized value.
The single-sample t test compares the
mean of your sample data to a known
value. For example, you might want to
know how your sample mean compares to
the population mean. You should run a one
sample t test when you don’t know the
population standard deviation or you have
a small sample size.
10
2.1.1 EQUATION FOR ONE-SAMPLE T-TEST
𝑡 =
𝑥 − 𝜇
𝑠/ 𝑛
Where:
t = the t statistic
𝑥 =the mean of the sample
𝜇 =the comparison mean
S= the sample standard deviation
n = the sample size
11
2.1.2 EXAMPLE OF ONE-SAMPLE T-TEST
10 individuals had taken an
exam and we want to test
whether their scores, all
together, are significantly
different from the score of 100.
while standard deviation is 5.35
and sample mean is 107.8.
12
SOLUTION:
𝑡 =
107.8 − 100
5.35/ 10
= 4.61
We need to calculate the degree of freedom
Here, the degree of freedom is simply the sample
size minus one (n-1), 10-1=9
Now, we will refer to a t-table to determine the
critical t value for 9 degrees of freedom at the 0.05
level of significance
Looking at a t-table, this value of 4.61 is greater
than the critical t value of 2.26, we can say that the
score of our sample of 10 individuals differ
significantly from the score of 100. 13
T-TEST TABLE
14
2.1.3 HOW TO CALCULATE ONE-SAMPLE T-TEST
 Calculate The sample means (x̄ ).
 Find The population means or comparison mean (μ).
 Calculate The sample standard deviation(s).
 Find the sample size (n).
 Calculate the degree of freedom.
 Insert the items from the above into the t-score formula and
calculate t-value.
 Find the t-table value (critical t-value) by using your calculated
degree of freedom.
 Compare the two t-values you have, if the calculated t value is
greater then the critical t- value the result is no significant or we
can reject the null hypothesis.
15
2. INDEPENDENT T-TEST
 The independent sample t-test consist of test that
compare mean value (s)of continuous- level (interval
or ratio data), in a normal distributed data.
 The independent sample t-test compares two means.
 The independent sample t-test is also called unpaired
t-test/ sample t-test.
 It is the t-test to be use when two separate independent
and identically distributed variables are measured.
 Example: comparison of mean cholesterol levels in
treatment group with placebo group after
administration of test drug.
16
2.2.1 EQUATION FOR INDEPENDENT
SAMPLE T-TEST
𝑡 =
𝑥1 − 𝑥2
𝑠𝑠1 + 𝑠𝑠2
𝑛1 + 𝑛2 − 2
.
1
𝑛1
+
1
𝑛2
Here:
t = the t statistic
𝑥1 and 𝑥2 are the means of the two different groups
n1= n of group one
n2 = n of group two
SS= sum of squares
17
2.2.2 EXAMPLE OF INDEPENDENT SAMPLE T-TEST
Suppose we have to compare the mean value of two groups, one
with 7 subjects and the other with 5 subjects.
These are their score:
Case Group One Group Two
1 78 87
2 82 92
3 87 86
4 65 95
5 75 73
6 82
7 71
x 77.14 86.60
SS 334.86 285.20
18
CALCULATION OF SUM SQUARES
𝑆𝑆1 = 41992 −
291600
7
= 334.86
𝑆𝑆2 = 37783 −
187489
5
= 285.20
19
SOLUTION:
𝑡 =
77.14 − 86.60
334.86 + 285.20
7 + 5 − 2
1
7
+
1
5
−9.46
620.06
10
12
35
=
−9.46
21.26
= −0.44
For an independent
or between subjects
t-test: degree
freedom = n1+n2-2
7+5-2=10
Now, take the absolute value
of this, which is 0.44.
Now, for the 0.05 probability
level with 10 degrees of
freedom, we see from the
table that the critical t score is
2.228 for to tailed test.
Since the calculated t score is
less than the critical t score,
the results are significant at
the 0.05 probability.
20
T-TEST TABLE
21
2.2.3 HOW TO CALCULATE INDEPENDENT T-TEST
 Calculate the difference between two sample mean (x1 and
x2).
 Calculate the sum of squares (SS1 and SS2).
 Then calculate the degree of freedom (n1+n2-2).
 Insert the items from the above into the t-score formula and
calculate t-value.
 Find the t-table value (critical t-value) by using your
calculated degree of freedom.
 Compare the two t-values (t-score) you have, if the calculated t
value is greater then the critical t- value the result is no
significant or we can reject the null hypothesis.
22
2.3 DEPENDENT T-TEST OR PAIRED T-TEST
 A paired t-test is used to compare two population
means where you have two samples in which
observations in one sample can be paired with
observations in the other sample.
 A comparison of two different methods of
measurement or two different treatment where the
measurements/treatments are applied to the same
subjects.
 Example: 1. pre-test/posttest samples in which a
factor is measured before and after an intervention.
2. Matched samples, in which individuals are matched
on personal characteristics such as age and sex.
23
2.3.1 EQUATION FOR DEPENDENT SAMPLE T-TEST
𝑡 =
𝑥 − 𝜇
𝑆 𝑛
t = the t statistic
𝒙d = mean difference
𝑺 𝒏 = standard error of the mean
difference
𝝁 ∶H0=0; the null hypothesis 24
2.3.3 EXAMPLE OF DEPENDENT SAMPLE T-TEST
Table below shows an intensive intervention
program for 10 subjects with BMI more
than 25 kg/m2. After a 12-week lifestyle
change (diet and physical activity) trial,
BMIs are compared between baseline and at
week 12. Paired t-test is applied to test the
mean difference in subjects with before and
after the intervention.
25
TABLE: EXAMPLE FOR PAIRED T TEST
BMI, Kg/m2
ID WEEK0 WEEK12 DIFF
1 35 37 −2
2 32 26 6
3 27 28 −1
4 26 24 2
5 33 27 6
6 28 26 2
7 26 23 3
8 28 27 1
9 33 27 6
10 30 24 6
Mean 29.8 26.9 2.9
SD 3.26 3.9 3.03
26
SOLUTION:
𝑡 =
2.9−0
3.03 10
= 3.0266
Note that, because t distribution is changed with the
number of observation (or degree of freedom, df), when
t statistic is calculated, it should be compared with the t
values in a standard t-distribution table. In the
example, n = 10, df = 10−1 = 9, from t-distribution
table, when df = 9, if P-value = 0.05 (for two-tailed
test), t-value = 2.26; and if P-value = 0.01 (for two-
tailed test), t-value = 3.25. That is, our observed t-value
(3.02) >2.26, P < .05. We reject the null hypothesis.
27
T-TEST TABLE
28
2.3.4 THE PROCEDURE FOLLOWS WHEN
CALCULATING PAIRED T-TEST
 Calculate the difference between the two observations
on each pair.
 Calculate the mean difference
 Calculate the standard error of the mean difference.
 Calculate the t-test, which is given by under the null
hypothesis, this statistics follow a t-distribution with
n-1 degree of freedom.
 Use t-table of the t-distribution to compare your t
value to the t from t table .
29
Z-TEST
Z-test is the statistical hypothesis which
is used in order to determine that whether
the to samples means calculated are
different in case the standard deviation is
available and sample is large.
30
COMPARISON OF T-TEST AND Z-TEST
t-test uses:
 t-test can be used to test a
hypothesis, but they are very
useful when we need to
determine if there is a
statistically significant
comparison between the 2
independent sample groups.
 Usually, t-test are more
appropriate when you are
dealing with problems with a
limited sample size example
n<30.
 Mostly, they are useful when the
standard deviation is unknown.
z-test uses
 Z-test can be used to compare
population averages to a
sample’s.
 The z-test will be tell you how
far, in standard deviation terms,
a data point is from the average
of a data set.
 A z-test will do a comparison of
a sample to a defined population
that is typically used for dealing
with problems relating to a large
samples. (Example, n>30)
 Mostly, they are very useful
when the standard deviation is
known. 31
FORMULA TO FIND THE VALUE OF Z-TEST IN
ONE SAMPLE:
Z =
𝑥 − 𝜇
𝜎
𝑥=mean of sample
𝜇=mean of population
𝜎=standard deviation of population
32
EXAMPLE OF Z-TEST IN ONE SAMPLE:
For example, let’s say you have a test score of 190.
the test has mean of 150 and a standard deviation of
25. assuming a normal distribution, your z score
would be:
Z =
𝑥−𝜇
𝜎
=
190−150
25
= 1.6
The z score tells you have many standard deviations
from the mean your score is. In this example, your
score is 1.6 standard deviations above the mean.
33
Z TEST FORMULA: STANDARD ERROR OF THE
MEAN
Z =
𝑥 − 𝜇
𝜎/ 𝑛
𝑥=mean of sample
𝜇=mean of population
𝜎/ 𝑛=standard error of the mean
34
EXAMPLE OF STANDARD ERROR OF THE
MEAN
In general, the mean height of the women is 65 “with
a standard deviation of 3.5”. What is the probability
of finding a random sample of women with a mean
height of 70”, assuming the heights are normally
distributed?
solution:
Z =
𝑥 − 𝜇
𝜎/ 𝑛
=
70−65
3.5/ 50
=
5
0.495
=10.1
35
WHEN DO WE USE Z-TEST
 When samples are draw at random
 When the samples are taken from population are
independent.
 When standard deviation is know
 When number of observation is larger than (n≥30)
36
SUMMARY
The t-test compares the actual difference
between two means in relation to the
variation in the data (expressed as the
standard deviation of the difference between
the means).
37
SUMMARY CONT……..
 One –sample t-test: Difference between a set value and
a variable.
 Independent sample t-test: difference between two
independent groups. (between subjects).
 Dependent sample t-test: difference between two
related measures (example, repeated over time or two
related measures at one time). (within subjects).
 Z- test: is any statistical test for which the distribution of
the test statistic under the hypothesis can be a normal
distribution
38
4. REFERENCE:
 Meier et. al. (2014). Applied Statistics for Public and
Nonprofit Administration, Cengage Learning.
 Altaian DG (1991) Practical Statistics for Medical
Research. Chapman & Hall, London.
 Armitage P, Matthews JNS and Berry G (2001)
Statistical Methods in Medical Research (4e). Blackwell
Scientific Publications, Oxford.
 Barker DJP, Cooper C and Rose GR (1998) Bland M
(2000) An Introduction to Medical Statistics (3e). Oxford
University Press, Oxford.
39
40

More Related Content

What's hot

{ANOVA} PPT-1.pptx
{ANOVA} PPT-1.pptx{ANOVA} PPT-1.pptx
{ANOVA} PPT-1.pptx
SNEHA AGRAWAL GUPTA
 

What's hot (20)

PPT on Sample Size, Importance of Sample Size,
PPT on Sample Size, Importance of Sample Size,PPT on Sample Size, Importance of Sample Size,
PPT on Sample Size, Importance of Sample Size,
 
Parametric Statistical tests
Parametric Statistical testsParametric Statistical tests
Parametric Statistical tests
 
Mann Whitney U test
Mann Whitney U testMann Whitney U test
Mann Whitney U test
 
Standard error
Standard error Standard error
Standard error
 
{ANOVA} PPT-1.pptx
{ANOVA} PPT-1.pptx{ANOVA} PPT-1.pptx
{ANOVA} PPT-1.pptx
 
Parametric Test
Parametric TestParametric Test
Parametric Test
 
Parametric and non parametric test in biostatistics
Parametric and non parametric test in biostatistics Parametric and non parametric test in biostatistics
Parametric and non parametric test in biostatistics
 
Student t-test
Student t-testStudent t-test
Student t-test
 
Anova ppt
Anova pptAnova ppt
Anova ppt
 
t distribution, paired and unpaired t-test
t distribution, paired and unpaired t-testt distribution, paired and unpaired t-test
t distribution, paired and unpaired t-test
 
Parametric tests
Parametric testsParametric tests
Parametric tests
 
T test statistics
T test statisticsT test statistics
T test statistics
 
Anova - One way and two way
Anova - One way and two wayAnova - One way and two way
Anova - One way and two way
 
Chi -square test
Chi -square testChi -square test
Chi -square test
 
Test of significance in Statistics
Test of significance in StatisticsTest of significance in Statistics
Test of significance in Statistics
 
Wilcoxon signed rank test
Wilcoxon signed rank testWilcoxon signed rank test
Wilcoxon signed rank test
 
ANOVA TEST by shafeek
ANOVA TEST by shafeekANOVA TEST by shafeek
ANOVA TEST by shafeek
 
Parametric and nonparametric test
Parametric and nonparametric testParametric and nonparametric test
Parametric and nonparametric test
 
Chi squared test
Chi squared testChi squared test
Chi squared test
 
Z-test
Z-testZ-test
Z-test
 

Similar to The t test

Two Sample Tests
Two Sample TestsTwo Sample Tests
Two Sample Tests
sanketd1983
 
Lecture-6 (t-test and one way ANOVA.ppt
Lecture-6 (t-test and one way ANOVA.pptLecture-6 (t-test and one way ANOVA.ppt
Lecture-6 (t-test and one way ANOVA.ppt
habtamu biazin
 
11 T(EA) FOR TWO TESTS BETWEEN THE MEANS OF DIFFERENT GROUPS11 .docx
11 T(EA) FOR TWO TESTS BETWEEN THE MEANS OF DIFFERENT GROUPS11 .docx11 T(EA) FOR TWO TESTS BETWEEN THE MEANS OF DIFFERENT GROUPS11 .docx
11 T(EA) FOR TWO TESTS BETWEEN THE MEANS OF DIFFERENT GROUPS11 .docx
novabroom
 
11 T(EA) FOR TWO TESTS BETWEEN THE MEANS OF DIFFERENT GROUPS11 .docx
11 T(EA) FOR TWO TESTS BETWEEN THE MEANS OF DIFFERENT GROUPS11 .docx11 T(EA) FOR TWO TESTS BETWEEN THE MEANS OF DIFFERENT GROUPS11 .docx
11 T(EA) FOR TWO TESTS BETWEEN THE MEANS OF DIFFERENT GROUPS11 .docx
hyacinthshackley2629
 
In a left-tailed test comparing two means with variances unknown b.docx
In a left-tailed test comparing two means with variances unknown b.docxIn a left-tailed test comparing two means with variances unknown b.docx
In a left-tailed test comparing two means with variances unknown b.docx
bradburgess22840
 

Similar to The t test (20)

Ttest
TtestTtest
Ttest
 
T-Test
T-TestT-Test
T-Test
 
Test of significance (t-test, proportion test, chi-square test)
Test of significance (t-test, proportion test, chi-square test)Test of significance (t-test, proportion test, chi-square test)
Test of significance (t-test, proportion test, chi-square test)
 
Lecture-6 (t-test and one way ANOVA.ppt
Lecture-6 (t-test and one way ANOVA.pptLecture-6 (t-test and one way ANOVA.ppt
Lecture-6 (t-test and one way ANOVA.ppt
 
Chapter11
Chapter11Chapter11
Chapter11
 
Survival.pptx
Survival.pptxSurvival.pptx
Survival.pptx
 
Two Sample Tests
Two Sample TestsTwo Sample Tests
Two Sample Tests
 
Lecture-6 (t-test and one way ANOVA.ppt
Lecture-6 (t-test and one way ANOVA.pptLecture-6 (t-test and one way ANOVA.ppt
Lecture-6 (t-test and one way ANOVA.ppt
 
11 T(EA) FOR TWO TESTS BETWEEN THE MEANS OF DIFFERENT GROUPS11 .docx
11 T(EA) FOR TWO TESTS BETWEEN THE MEANS OF DIFFERENT GROUPS11 .docx11 T(EA) FOR TWO TESTS BETWEEN THE MEANS OF DIFFERENT GROUPS11 .docx
11 T(EA) FOR TWO TESTS BETWEEN THE MEANS OF DIFFERENT GROUPS11 .docx
 
11 T(EA) FOR TWO TESTS BETWEEN THE MEANS OF DIFFERENT GROUPS11 .docx
11 T(EA) FOR TWO TESTS BETWEEN THE MEANS OF DIFFERENT GROUPS11 .docx11 T(EA) FOR TWO TESTS BETWEEN THE MEANS OF DIFFERENT GROUPS11 .docx
11 T(EA) FOR TWO TESTS BETWEEN THE MEANS OF DIFFERENT GROUPS11 .docx
 
In a left-tailed test comparing two means with variances unknown b.docx
In a left-tailed test comparing two means with variances unknown b.docxIn a left-tailed test comparing two means with variances unknown b.docx
In a left-tailed test comparing two means with variances unknown b.docx
 
Application of Statistical and mathematical equations in Chemistry Part 2
Application of Statistical and mathematical equations in Chemistry Part 2Application of Statistical and mathematical equations in Chemistry Part 2
Application of Statistical and mathematical equations in Chemistry Part 2
 
Parametric Statistics
Parametric StatisticsParametric Statistics
Parametric Statistics
 
inferentialstatistics-210411214248.pdf
inferentialstatistics-210411214248.pdfinferentialstatistics-210411214248.pdf
inferentialstatistics-210411214248.pdf
 
Inferential statistics
Inferential statisticsInferential statistics
Inferential statistics
 
Hypothesis testing for parametric data (1)
Hypothesis testing for parametric data (1)Hypothesis testing for parametric data (1)
Hypothesis testing for parametric data (1)
 
Hypothesis testing for parametric data
Hypothesis testing for parametric dataHypothesis testing for parametric data
Hypothesis testing for parametric data
 
Unit-5.-t-test.ppt
Unit-5.-t-test.pptUnit-5.-t-test.ppt
Unit-5.-t-test.ppt
 
PARAMETRIC STATISTICS .pptx
PARAMETRIC STATISTICS .pptxPARAMETRIC STATISTICS .pptx
PARAMETRIC STATISTICS .pptx
 
Independent Samples t-test.pptx
Independent Samples t-test.pptxIndependent Samples t-test.pptx
Independent Samples t-test.pptx
 

More from Mohamed Hersi Farah (10)

CV Mohamed Hersi Farah
CV Mohamed Hersi Farah CV Mohamed Hersi Farah
CV Mohamed Hersi Farah
 
Acacia nilotica seeds
Acacia nilotica seedsAcacia nilotica seeds
Acacia nilotica seeds
 
Orange peel
Orange peelOrange peel
Orange peel
 
Chromatography summary
Chromatography summaryChromatography summary
Chromatography summary
 
Research differen tyes of histogram
Research differen tyes of histogramResearch differen tyes of histogram
Research differen tyes of histogram
 
Mc qs of total quality managements
Mc qs of total quality managementsMc qs of total quality managements
Mc qs of total quality managements
 
Msc alcohols, phenols, ethers
Msc alcohols, phenols, ethersMsc alcohols, phenols, ethers
Msc alcohols, phenols, ethers
 
Msc chiral chromatography
Msc chiral chromatographyMsc chiral chromatography
Msc chiral chromatography
 
Curriculum vitae for mohammed hersi farah
Curriculum vitae for mohammed hersi farahCurriculum vitae for mohammed hersi farah
Curriculum vitae for mohammed hersi farah
 
How to write cv by Mohamed Farah
How to write cv by Mohamed FarahHow to write cv by Mohamed Farah
How to write cv by Mohamed Farah
 

Recently uploaded

Industrial Training Report- AKTU Industrial Training Report
Industrial Training Report- AKTU Industrial Training ReportIndustrial Training Report- AKTU Industrial Training Report
Industrial Training Report- AKTU Industrial Training Report
Avinash Rai
 

Recently uploaded (20)

Jose-Rizal-and-Philippine-Nationalism-National-Symbol-2.pptx
Jose-Rizal-and-Philippine-Nationalism-National-Symbol-2.pptxJose-Rizal-and-Philippine-Nationalism-National-Symbol-2.pptx
Jose-Rizal-and-Philippine-Nationalism-National-Symbol-2.pptx
 
UNIT – IV_PCI Complaints: Complaints and evaluation of complaints, Handling o...
UNIT – IV_PCI Complaints: Complaints and evaluation of complaints, Handling o...UNIT – IV_PCI Complaints: Complaints and evaluation of complaints, Handling o...
UNIT – IV_PCI Complaints: Complaints and evaluation of complaints, Handling o...
 
Telling Your Story_ Simple Steps to Build Your Nonprofit's Brand Webinar.pdf
Telling Your Story_ Simple Steps to Build Your Nonprofit's Brand Webinar.pdfTelling Your Story_ Simple Steps to Build Your Nonprofit's Brand Webinar.pdf
Telling Your Story_ Simple Steps to Build Your Nonprofit's Brand Webinar.pdf
 
Basic phrases for greeting and assisting costumers
Basic phrases for greeting and assisting costumersBasic phrases for greeting and assisting costumers
Basic phrases for greeting and assisting costumers
 
GIÁO ÁN DẠY THÊM (KẾ HOẠCH BÀI BUỔI 2) - TIẾNG ANH 8 GLOBAL SUCCESS (2 CỘT) N...
GIÁO ÁN DẠY THÊM (KẾ HOẠCH BÀI BUỔI 2) - TIẾNG ANH 8 GLOBAL SUCCESS (2 CỘT) N...GIÁO ÁN DẠY THÊM (KẾ HOẠCH BÀI BUỔI 2) - TIẾNG ANH 8 GLOBAL SUCCESS (2 CỘT) N...
GIÁO ÁN DẠY THÊM (KẾ HOẠCH BÀI BUỔI 2) - TIẾNG ANH 8 GLOBAL SUCCESS (2 CỘT) N...
 
Research Methods in Psychology | Cambridge AS Level | Cambridge Assessment In...
Research Methods in Psychology | Cambridge AS Level | Cambridge Assessment In...Research Methods in Psychology | Cambridge AS Level | Cambridge Assessment In...
Research Methods in Psychology | Cambridge AS Level | Cambridge Assessment In...
 
Salient features of Environment protection Act 1986.pptx
Salient features of Environment protection Act 1986.pptxSalient features of Environment protection Act 1986.pptx
Salient features of Environment protection Act 1986.pptx
 
2024_Student Session 2_ Set Plan Preparation.pptx
2024_Student Session 2_ Set Plan Preparation.pptx2024_Student Session 2_ Set Plan Preparation.pptx
2024_Student Session 2_ Set Plan Preparation.pptx
 
How to Manage Notification Preferences in the Odoo 17
How to Manage Notification Preferences in the Odoo 17How to Manage Notification Preferences in the Odoo 17
How to Manage Notification Preferences in the Odoo 17
 
Pragya Champions Chalice 2024 Prelims & Finals Q/A set, General Quiz
Pragya Champions Chalice 2024 Prelims & Finals Q/A set, General QuizPragya Champions Chalice 2024 Prelims & Finals Q/A set, General Quiz
Pragya Champions Chalice 2024 Prelims & Finals Q/A set, General Quiz
 
Sha'Carri Richardson Presentation 202345
Sha'Carri Richardson Presentation 202345Sha'Carri Richardson Presentation 202345
Sha'Carri Richardson Presentation 202345
 
Phrasal Verbs.XXXXXXXXXXXXXXXXXXXXXXXXXX
Phrasal Verbs.XXXXXXXXXXXXXXXXXXXXXXXXXXPhrasal Verbs.XXXXXXXXXXXXXXXXXXXXXXXXXX
Phrasal Verbs.XXXXXXXXXXXXXXXXXXXXXXXXXX
 
Open Educational Resources Primer PowerPoint
Open Educational Resources Primer PowerPointOpen Educational Resources Primer PowerPoint
Open Educational Resources Primer PowerPoint
 
Basic Civil Engg Notes_Chapter-6_Environment Pollution & Engineering
Basic Civil Engg Notes_Chapter-6_Environment Pollution & EngineeringBasic Civil Engg Notes_Chapter-6_Environment Pollution & Engineering
Basic Civil Engg Notes_Chapter-6_Environment Pollution & Engineering
 
Students, digital devices and success - Andreas Schleicher - 27 May 2024..pptx
Students, digital devices and success - Andreas Schleicher - 27 May 2024..pptxStudents, digital devices and success - Andreas Schleicher - 27 May 2024..pptx
Students, digital devices and success - Andreas Schleicher - 27 May 2024..pptx
 
How to the fix Attribute Error in odoo 17
How to the fix Attribute Error in odoo 17How to the fix Attribute Error in odoo 17
How to the fix Attribute Error in odoo 17
 
Industrial Training Report- AKTU Industrial Training Report
Industrial Training Report- AKTU Industrial Training ReportIndustrial Training Report- AKTU Industrial Training Report
Industrial Training Report- AKTU Industrial Training Report
 
Instructions for Submissions thorugh G- Classroom.pptx
Instructions for Submissions thorugh G- Classroom.pptxInstructions for Submissions thorugh G- Classroom.pptx
Instructions for Submissions thorugh G- Classroom.pptx
 
Morse OER Some Benefits and Challenges.pptx
Morse OER Some Benefits and Challenges.pptxMorse OER Some Benefits and Challenges.pptx
Morse OER Some Benefits and Challenges.pptx
 
B.ed spl. HI pdusu exam paper-2023-24.pdf
B.ed spl. HI pdusu exam paper-2023-24.pdfB.ed spl. HI pdusu exam paper-2023-24.pdf
B.ed spl. HI pdusu exam paper-2023-24.pdf
 

The t test

  • 1. UNIVERSITY OF MEDICAL SCIENCE AND TECHNOLOGY Faculty of Pharmacy Graduate college M.Sc. of Pharmaceutical Analysis And Quality Control Batch (9) Subject: Biostatistics Presentation: the t-test Prepared by Mohamed Hersi Farah Modether aldow Aya Ahmed Salih Ahmed Under the supervision of Dr.Suleiman Abdgabbar Abdullah 28th of December 2019 1
  • 2. 2
  • 3. OVERVIEW 1. Introduction  Definitions  Applications of t-test 2. Types of t-test  Single sample t-test Equation for one-sample t-test Example of one-sample t-test How to calculate one-sample t-test  Independent t-test Equation for independent sample t-test Example of independent sample t-test How to calculate independent t-test 3
  • 4. OVERVIEW…..  Dependent t-test or Paired t-test Equation for dependent sample t-test Example of dependent sample t-test The procedure follows when calculating paired t-test 3. z-test.  Comparison of t-test and z-test  Formula to find the value of z-test is  When do we use z-test 4. Summary 5. Reference 4
  • 5. 1. INTRODUCTION 1.1 Definitions: The t score: is a ratio between the difference between two groups and the difference within the groups. A large t-score tells you that the groups are different (not significance). A small t-score tells you that the groups are similar (significance). 5
  • 6. INTRODUCTION……… A p-value: is the probability that the results from your sample data occurred by chance. P- values are from 0% to 100%. They are usually written as a decimal. For example, a p value of 5% is 0.05. Low p-values are good. In most cases, a p-value of 0.05 (5%) is accepted to mean the data is valid. 6
  • 7. INTRODUCTION……..  A t-test: is a type of inferential statistic used to determine if there is a significant difference between the means of two groups, which may be related in certain features.  The t test tells you how significant the differences between groups are; In other words it lets you know if those differences (measured in means/averages) could have happened by chance. 7
  • 8. 1.2 APPLICATIONS OF T-TEST The calculations of a confidence interval for a sample mean To test whether a sample mean is different from a hypothesized value To compare mean two samples To compare two sample means by group 8
  • 9. 2. TYPES OF T-TEST 1) Single sample t-test: is a statistical procedure used to determine whether a sample of observations could have been generated by a process with a specific mean. 2) Independent sample t-test: we have two means; two groups; no relation between groups, example when we want to compare the mean of T/T groups with Placebo group. 3) Dependent t-test or Paired t-test: it consist of samples of matched pairs of similar units or one group of units tested twice; Example: difference of mean pre and post drug intervention. 9
  • 10. 2.1 SINGLE SAMPLE T-TEST It is used in measuring whether a sample value significantly differs from a hypothesized value. The single-sample t test compares the mean of your sample data to a known value. For example, you might want to know how your sample mean compares to the population mean. You should run a one sample t test when you don’t know the population standard deviation or you have a small sample size. 10
  • 11. 2.1.1 EQUATION FOR ONE-SAMPLE T-TEST 𝑡 = 𝑥 − 𝜇 𝑠/ 𝑛 Where: t = the t statistic 𝑥 =the mean of the sample 𝜇 =the comparison mean S= the sample standard deviation n = the sample size 11
  • 12. 2.1.2 EXAMPLE OF ONE-SAMPLE T-TEST 10 individuals had taken an exam and we want to test whether their scores, all together, are significantly different from the score of 100. while standard deviation is 5.35 and sample mean is 107.8. 12
  • 13. SOLUTION: 𝑡 = 107.8 − 100 5.35/ 10 = 4.61 We need to calculate the degree of freedom Here, the degree of freedom is simply the sample size minus one (n-1), 10-1=9 Now, we will refer to a t-table to determine the critical t value for 9 degrees of freedom at the 0.05 level of significance Looking at a t-table, this value of 4.61 is greater than the critical t value of 2.26, we can say that the score of our sample of 10 individuals differ significantly from the score of 100. 13
  • 15. 2.1.3 HOW TO CALCULATE ONE-SAMPLE T-TEST  Calculate The sample means (x̄ ).  Find The population means or comparison mean (μ).  Calculate The sample standard deviation(s).  Find the sample size (n).  Calculate the degree of freedom.  Insert the items from the above into the t-score formula and calculate t-value.  Find the t-table value (critical t-value) by using your calculated degree of freedom.  Compare the two t-values you have, if the calculated t value is greater then the critical t- value the result is no significant or we can reject the null hypothesis. 15
  • 16. 2. INDEPENDENT T-TEST  The independent sample t-test consist of test that compare mean value (s)of continuous- level (interval or ratio data), in a normal distributed data.  The independent sample t-test compares two means.  The independent sample t-test is also called unpaired t-test/ sample t-test.  It is the t-test to be use when two separate independent and identically distributed variables are measured.  Example: comparison of mean cholesterol levels in treatment group with placebo group after administration of test drug. 16
  • 17. 2.2.1 EQUATION FOR INDEPENDENT SAMPLE T-TEST 𝑡 = 𝑥1 − 𝑥2 𝑠𝑠1 + 𝑠𝑠2 𝑛1 + 𝑛2 − 2 . 1 𝑛1 + 1 𝑛2 Here: t = the t statistic 𝑥1 and 𝑥2 are the means of the two different groups n1= n of group one n2 = n of group two SS= sum of squares 17
  • 18. 2.2.2 EXAMPLE OF INDEPENDENT SAMPLE T-TEST Suppose we have to compare the mean value of two groups, one with 7 subjects and the other with 5 subjects. These are their score: Case Group One Group Two 1 78 87 2 82 92 3 87 86 4 65 95 5 75 73 6 82 7 71 x 77.14 86.60 SS 334.86 285.20 18
  • 19. CALCULATION OF SUM SQUARES 𝑆𝑆1 = 41992 − 291600 7 = 334.86 𝑆𝑆2 = 37783 − 187489 5 = 285.20 19
  • 20. SOLUTION: 𝑡 = 77.14 − 86.60 334.86 + 285.20 7 + 5 − 2 1 7 + 1 5 −9.46 620.06 10 12 35 = −9.46 21.26 = −0.44 For an independent or between subjects t-test: degree freedom = n1+n2-2 7+5-2=10 Now, take the absolute value of this, which is 0.44. Now, for the 0.05 probability level with 10 degrees of freedom, we see from the table that the critical t score is 2.228 for to tailed test. Since the calculated t score is less than the critical t score, the results are significant at the 0.05 probability. 20
  • 22. 2.2.3 HOW TO CALCULATE INDEPENDENT T-TEST  Calculate the difference between two sample mean (x1 and x2).  Calculate the sum of squares (SS1 and SS2).  Then calculate the degree of freedom (n1+n2-2).  Insert the items from the above into the t-score formula and calculate t-value.  Find the t-table value (critical t-value) by using your calculated degree of freedom.  Compare the two t-values (t-score) you have, if the calculated t value is greater then the critical t- value the result is no significant or we can reject the null hypothesis. 22
  • 23. 2.3 DEPENDENT T-TEST OR PAIRED T-TEST  A paired t-test is used to compare two population means where you have two samples in which observations in one sample can be paired with observations in the other sample.  A comparison of two different methods of measurement or two different treatment where the measurements/treatments are applied to the same subjects.  Example: 1. pre-test/posttest samples in which a factor is measured before and after an intervention. 2. Matched samples, in which individuals are matched on personal characteristics such as age and sex. 23
  • 24. 2.3.1 EQUATION FOR DEPENDENT SAMPLE T-TEST 𝑡 = 𝑥 − 𝜇 𝑆 𝑛 t = the t statistic 𝒙d = mean difference 𝑺 𝒏 = standard error of the mean difference 𝝁 ∶H0=0; the null hypothesis 24
  • 25. 2.3.3 EXAMPLE OF DEPENDENT SAMPLE T-TEST Table below shows an intensive intervention program for 10 subjects with BMI more than 25 kg/m2. After a 12-week lifestyle change (diet and physical activity) trial, BMIs are compared between baseline and at week 12. Paired t-test is applied to test the mean difference in subjects with before and after the intervention. 25
  • 26. TABLE: EXAMPLE FOR PAIRED T TEST BMI, Kg/m2 ID WEEK0 WEEK12 DIFF 1 35 37 −2 2 32 26 6 3 27 28 −1 4 26 24 2 5 33 27 6 6 28 26 2 7 26 23 3 8 28 27 1 9 33 27 6 10 30 24 6 Mean 29.8 26.9 2.9 SD 3.26 3.9 3.03 26
  • 27. SOLUTION: 𝑡 = 2.9−0 3.03 10 = 3.0266 Note that, because t distribution is changed with the number of observation (or degree of freedom, df), when t statistic is calculated, it should be compared with the t values in a standard t-distribution table. In the example, n = 10, df = 10−1 = 9, from t-distribution table, when df = 9, if P-value = 0.05 (for two-tailed test), t-value = 2.26; and if P-value = 0.01 (for two- tailed test), t-value = 3.25. That is, our observed t-value (3.02) >2.26, P < .05. We reject the null hypothesis. 27
  • 29. 2.3.4 THE PROCEDURE FOLLOWS WHEN CALCULATING PAIRED T-TEST  Calculate the difference between the two observations on each pair.  Calculate the mean difference  Calculate the standard error of the mean difference.  Calculate the t-test, which is given by under the null hypothesis, this statistics follow a t-distribution with n-1 degree of freedom.  Use t-table of the t-distribution to compare your t value to the t from t table . 29
  • 30. Z-TEST Z-test is the statistical hypothesis which is used in order to determine that whether the to samples means calculated are different in case the standard deviation is available and sample is large. 30
  • 31. COMPARISON OF T-TEST AND Z-TEST t-test uses:  t-test can be used to test a hypothesis, but they are very useful when we need to determine if there is a statistically significant comparison between the 2 independent sample groups.  Usually, t-test are more appropriate when you are dealing with problems with a limited sample size example n<30.  Mostly, they are useful when the standard deviation is unknown. z-test uses  Z-test can be used to compare population averages to a sample’s.  The z-test will be tell you how far, in standard deviation terms, a data point is from the average of a data set.  A z-test will do a comparison of a sample to a defined population that is typically used for dealing with problems relating to a large samples. (Example, n>30)  Mostly, they are very useful when the standard deviation is known. 31
  • 32. FORMULA TO FIND THE VALUE OF Z-TEST IN ONE SAMPLE: Z = 𝑥 − 𝜇 𝜎 𝑥=mean of sample 𝜇=mean of population 𝜎=standard deviation of population 32
  • 33. EXAMPLE OF Z-TEST IN ONE SAMPLE: For example, let’s say you have a test score of 190. the test has mean of 150 and a standard deviation of 25. assuming a normal distribution, your z score would be: Z = 𝑥−𝜇 𝜎 = 190−150 25 = 1.6 The z score tells you have many standard deviations from the mean your score is. In this example, your score is 1.6 standard deviations above the mean. 33
  • 34. Z TEST FORMULA: STANDARD ERROR OF THE MEAN Z = 𝑥 − 𝜇 𝜎/ 𝑛 𝑥=mean of sample 𝜇=mean of population 𝜎/ 𝑛=standard error of the mean 34
  • 35. EXAMPLE OF STANDARD ERROR OF THE MEAN In general, the mean height of the women is 65 “with a standard deviation of 3.5”. What is the probability of finding a random sample of women with a mean height of 70”, assuming the heights are normally distributed? solution: Z = 𝑥 − 𝜇 𝜎/ 𝑛 = 70−65 3.5/ 50 = 5 0.495 =10.1 35
  • 36. WHEN DO WE USE Z-TEST  When samples are draw at random  When the samples are taken from population are independent.  When standard deviation is know  When number of observation is larger than (n≥30) 36
  • 37. SUMMARY The t-test compares the actual difference between two means in relation to the variation in the data (expressed as the standard deviation of the difference between the means). 37
  • 38. SUMMARY CONT……..  One –sample t-test: Difference between a set value and a variable.  Independent sample t-test: difference between two independent groups. (between subjects).  Dependent sample t-test: difference between two related measures (example, repeated over time or two related measures at one time). (within subjects).  Z- test: is any statistical test for which the distribution of the test statistic under the hypothesis can be a normal distribution 38
  • 39. 4. REFERENCE:  Meier et. al. (2014). Applied Statistics for Public and Nonprofit Administration, Cengage Learning.  Altaian DG (1991) Practical Statistics for Medical Research. Chapman & Hall, London.  Armitage P, Matthews JNS and Berry G (2001) Statistical Methods in Medical Research (4e). Blackwell Scientific Publications, Oxford.  Barker DJP, Cooper C and Rose GR (1998) Bland M (2000) An Introduction to Medical Statistics (3e). Oxford University Press, Oxford. 39
  • 40. 40