Downloaded 248 times


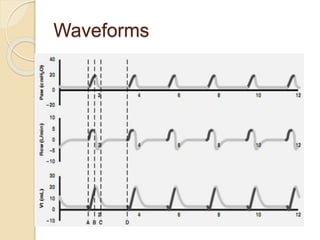
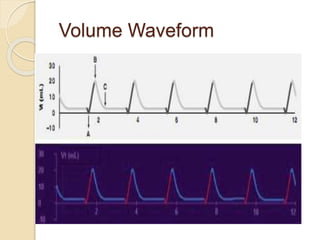
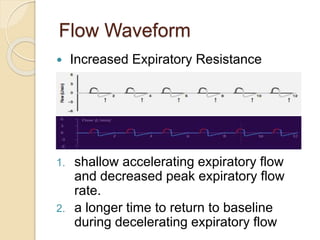
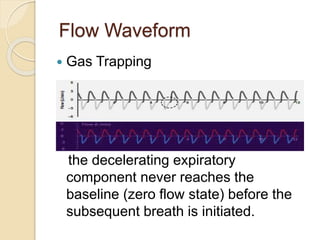
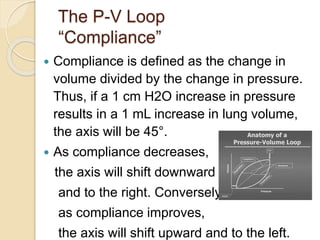
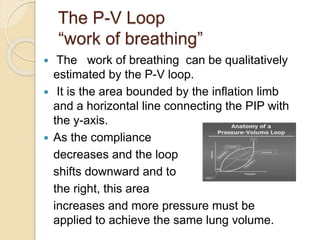
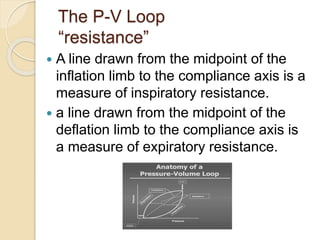
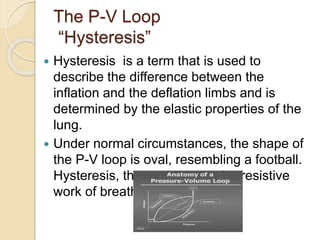
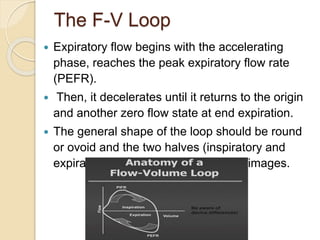

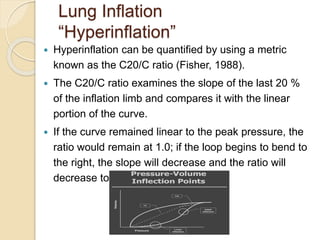
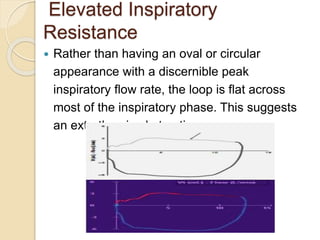
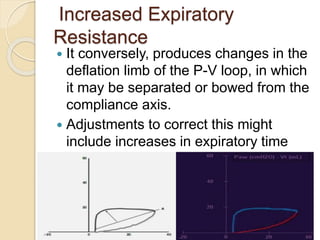
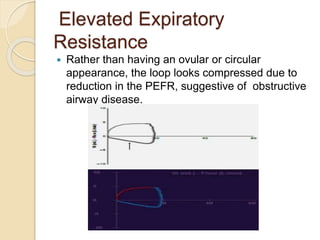
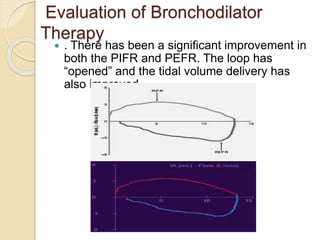


This document provides an overview of neonatal ventilator graphics and waveforms. It discusses the key waveforms of pressure, volume, and flow and how they depict the respiratory cycle. Specific features of each waveform are described, including how they can reveal conditions like leaks, auto-triggering, gas trapping, and changes in compliance. Pulmonary loops like the pressure-volume and flow-volume loops are introduced and how they can provide information about lung mechanics, resistance, compliance, and other conditions. Interpretation of loop features is covered for various pathological states and responses to treatments.


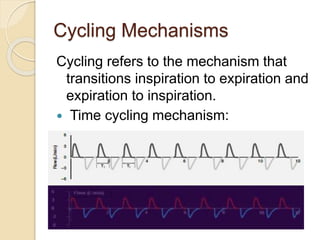
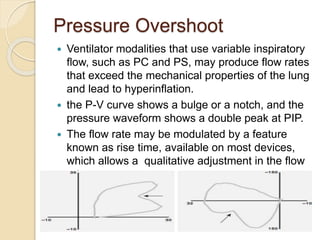
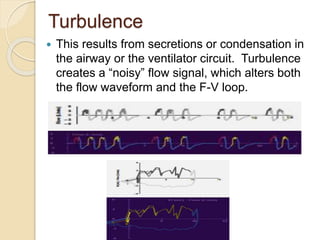
![PERI-PROSTHETIC FRACTURE NAIL-PLATE CONSTRUCT [NPC].pptx](https://cdn.slidesharecdn.com/ss_thumbnails/drarunkumardrmohamedashrafperiprostheticfrasturenail-plateconstructnpc-260209164459-7e9d15a1-thumbnail.jpg?width=640&height=640&fit=bounds)


