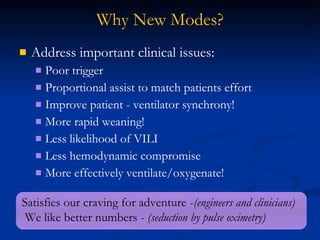
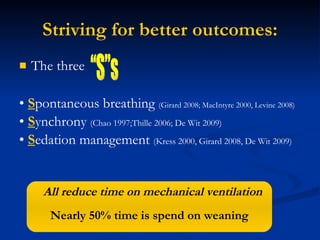
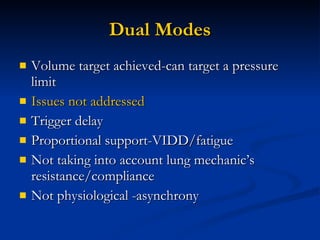
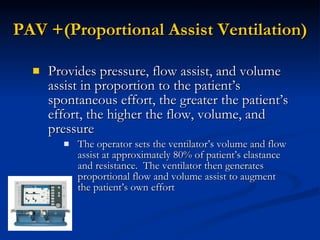
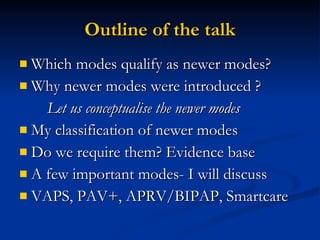
Newer modes of Mechanical Ventilation Dr. T.R. Chandrashekar Director Critical Care  K.R.Hospital Bangalore
Outline of the talk Which modes qualify as newer modes? Why newer modes were introduced ? Let us conceptualise the newer modes  My classification of newer modes Do we require them? Evidence base  A few important modes- I will discuss VAPS, PAV+, APRV/BIPAP, Smartcare
SIMV PCV ACV CMV Basic Modes? PS Newer [Alternative] Modes ? Volume support (VS) Volume Assured Pressure Support (VAPS) Pressure regulated volume control ventilation (PRVC) Mandatory minute ventilation (MMV) PROPORTIONAL ASSIST VENTILATION(PAV) ADAPTIVE SUPPORT VENTILATION(ASV) Smartcare/Automatic tube Compensation BIPAP/DUOPAP Airway pressure release ventilation (APRV  ) High Frequency Ventilation/oscillation Partial Liquid Ventilation (Perflurocarbon) Neurally Adjusted Ventilatory Assist (NAVA)  Fractal ventilation
What are Physicians Doing? 1,638 patients in 412 ICUs 47% Assist-Control Ventilation 46% Pressure Support and/or SIMV  7% Other Variability in modes across nations No variability in settings   Esteban et al, AJRCCM 2000; 161:1450-8
Modes of Ventilation during Weaning Esteban et al, AJRCCM 2000;161:1450 PS SIMV + PS Intermittent SB trials Others SIMV Daily SB trials Number of ventilated   patients, (%)
Why New Modes? Address important clinical issues: Poor trigger Proportional assist to match patients effort Improve patient - ventilator synchrony! More rapid weaning!  Less likelihood of VILI Less hemodynamic compromise More effectively ventilate/oxygenate! Satisfies our craving for adventure - (engineers and clinicians) We like better numbers -  (seduction by pulse oximetry)
Why newer modes were introduced ? Let us conceptualise the newer modes
Striving for better outcomes: The three •  S pontaneous breathing  (Girard 2008; MacIntyre 2000, Levine 2008) •  S ynchrony  (Chao 1997;Thille 2006; De Wit 2009) •  S edation management  (Kress 2000, Girard 2008, De Wit 2009) “S”s All reduce time on mechanical ventilation Nearly 50% time is spend on weaning
Phases of ventilatory cycle Delay, Missed breaths Fatigue/VIDD/runaway
Old modes trigger delay
Trigger in conventional modes We are targeting the last part of the cycle and  Also add the delay from the Y piece or the machine end Trigger delay is inbuilt in the old modes
NAVA Esophagus
Sinderby et al, Nature Med 1999;5:1433 Time (s) 0 1 4 3 2 0 1 4 3 2 Airway Pressure Trigger Onset of diaphragmatic electrical activity Onset of ventilator flow Neural Trigger 0 20 -5.0 0.0 0.0 0.5 -1 0 1 Flow (l/s) Volume (l) P es (cm H 2 O) P aw (cm  H 2 O ) Missed breaths
PAV+ vs. PCV /PSV example PCV 15 cmH2O PAV+ at 75% Compared to PCV, the PAV+ mode better matches patient’s effort to ventilator output. PAV+ P T P T P T P T P T P T Proportional support has synchronised  inspiration to expiration cycling
These can lead to disuse atrophy of the respiratory muscles (VIDD)  or   lowering of the CO 2  set point. Either case can delay weaning and result in more ventilator days! or M Younes. Proportional Assist Ventilation, A New Approach to Ventilatory Support.  Theory.  Am Rev Respir Dis  1992;145:114-120.  The practitioner’s typical response to an increase in demand is what?   we need to select a level of pressure support that is “ not too low, not too high, but just right”. Proportional support to patients effort which can change from breath to breath is ideal Increase support Sedate
Proportional support is vital No Diaphragm activity Missed breaths Possibly to much pressure support which had  suppressed the diaphragmatic activity Increase the PS
Automated mechanical ventilation is the future A growing number of medical errors in the literature related to  Workload  Due to the shortage of personnel  High frequency of severe ‘burnout syndrome’ among physicians and nurses working in ICUs. High frequency of staff turnover
Automated mechanical ventilation is the future In the study by Donchin et al ,   Average number of activities per patient per day was  178 Activities  related to breathing were the most frequent  (26% of all  activities) An estimated mean number of  errors per patient per day was 1.7 Errors  related to breathing were the second most frequent  (23% of all errors),  after errors related to data entry
The Future of Mechanical Ventilation   Advanced closed-loop systems -Reduce the staff workload and to reduce the duration of MV What is a Closed Loop Ventilation   ? Automated mechanical ventilation is the future
Closed Loop Ventilation Ventilator Patient Clinician Open  Loop Ventilation Basic modes- PS/SIMV/CMV Set volume/presuure/flow Patient has to adapt to the ventilator Gets feedback on lung resistance/compliance Adapts to the patient-   ASV/PAV+/NAVA Smartcare Intensivists brain
My classification of new MODES Dual modes Which combine Volume mode + Pressure modes- VS, MMV, VAPS, PRVC etc… Modes which adapt to lung characteristics ( Resistance & Compliance)  PAV+, ASV Spontaneous breathing + higher FRC-  APRV/ BIPAP Knowledge based Weaning modes-  Smartcare, ATC, PAV, ASV, NAVA Better trigger mechanism-  NAVA
Arguments Against New Modes Lack high-level evidence for better patient outcomes If we try a new mode and the patient has a good outcome, we say it was due to the new mode. But if try a new mode and there is a bad outcome, we say the patient was going to die anyway. Potential for harm  (these are often not reported) Improved gas exchange does not necessarily improve outcomes: high tidal volume, iNO, prone New is  not  necessarily better Solution to a problem or  in search of a problem?
Better oxygenation, faster weaning, lesser sedation, less Asynchrony YES- BUT mortality benefit not proved Dual modes  most popular but no great evidence BIPAP  no great evidence NAVA -emerging evidence even in children and NIV ASV-  physiological mode –accumulating evidence (ARDS/COPD) PAV +-better than PAV, physiological mode –accumulating evidence, NIV good evidence Smartcar e-unique mode can say ventilator has intensivist’s brain-good evidence for weaning
I will discuss these modes Dual modes- VAPS  –  PAV+,   BIPAP Smartcare VS/PRVC/MMR/MMV etc.. ASV /APRV / ATC/NAVA
DUAL MODES
Lung Compliance Changes and the P-V Loop Volume (mL) PIP levels Preset V T P aw  (cm H 2 O) Volume Targeted Ventilation COMPLIANCE Increased Normal Decreased
Volume Control : good and bad Guaranteed tidal volume- even with variable compliance and resistance. Less atelectasis compared to pressure control. Can cause excessive airway pressure-VILI The limited flow available may not meet the patient’s desired inspiratory flow rate-asynchrony Leaks = Volume loss
Lung Compliance Changes  and the P-V Loop Volume (mL) Preset PIP V T  levels P aw  (cm H 2 O) COMPLIANCE Increased Normal Decreased Pressure Targeted Ventilation
Pressure Control : good and bad •  Limits excessive airway pressure •  Improves gas distribution •  Less VT as pulmonary mechanics change-atelectasis •  Potentially excessive VT as compliance improves
1.Set Tidal Volume With 2. Safer  Pressure  Limit Target
60 -20 60 Flow L/min Volume Switch  from Pressure control to Volume control L 0 0.6 40 VAPS-Volume assured Pressure Support Normal PS If Compliance decreases P aw cmH 2 0 Set tidal volume cycle threshold Set pressure limit Tidal volume  met Tidal volume  not met Flow cycle
Dual Modes Volume target achieved-can target a pressure limit Issues not addressed Trigger delay Proportional support-VIDD/fatigue Not taking into account lung mechanic’s resistance/compliance Not physiological -asynchrony
PAV +(Proportional Assist Ventilation) Provides pressure, flow assist, and volume assist in proportion to the patient’s spontaneous effort, the greater the patient’s effort, the higher the flow, volume, and pressure The operator sets the ventilator’s volume and flow assist at approximately 80% of patient’s elastance and resistance.  The ventilator then generates proportional flow and volume assist to augment the patient’s own effort
PAV+ uses the compliance and resistance information collected every 4-10 breaths to know what it’s  fighting against . PAV+ uses the flow and volume information collected every 5 milliseconds to know what the  patient wants. PAV+ combines this data with the %Supp information input by the clinician to determine  how much pressure  to supply to the system. PAV+
The clinician will NOT set a rate, tidal volume, flow or target pressure.  Instead, the clinician will simply set the percentage of  work  that the ventilator should do. f %Supp x x x x PAV+ V . V t P i
PAV+ Start patients at 70% and wean back to stabilize When disease process has sufficiently reversed, decrease  %Support  over 2 hr intervals
+ PAV+ Potential Benefits 1. Comfort. 2. Lower peak airway pressure. 3. Less need for paralysis and/or sedation. 4. Less likelihood for over ventilation. 5. Preservation and enhancement of patient’s own control mechanisms such as metabolic ABG control and Hering-Breuer reflex. Some patients have a high rate normally, so a high rate on  PAV + may or may not reflect distress; check other signs;  Try increasing assist to see if rate goes down Don’t be surprised if RR climbs when switching from other modes
Circuit MUST be free of  large  leaks (small leaks are okay). No external nebulizers which add flow. PAV+  Limitations PAV+ is NOT recommended for… Low Respiratory drive Abnormal breathing pattern  Extreme air trapping  Large mechanical leaks.
APRV/BIPAP Maintain high FRC-better oxygenation Lung in safe zone-less de-recruitment /VILI Spontaneous breaths- diaphragm is active hence less VIDD/better Hemodynamics Less sedation and analgesia? Conflicting results APRV is IRV hence more impetus on Oxygenation/ synchrony problems persist BIPAP- less synchrony problems Keeps the lung in lung protective zone Keeps the lung in lung protective zone
APRV settings P aw T high  (4-5) Sec T low P high P low ( 1 sec) Time-triggered,  Time-cycled, Pressure-limited, Spontaneous breathing is allowed at any point during the ventilatory cycle FLOW P high  -This parameter is set with the goal of improving oxygenation. P low   -The setting of this parameter has the goal of facilitating ventilation or CO2 clearance. It is this inverse inspiratory:expiratory (I:E) ratio that distinguishes APRV from bi-level positive airway pressure (BiPAP=1:1)
BiLevel Ventilation: Uses 2 pressure levels for 2 time periods PEEP low  & PEEP high , T high  and T low  Patient triggering & cycling  can change phases If PS is set higher than PEEP H , the PS pressure is applied to a spontaneous effort at upper pressure If set PS < than Phigh then only applied in the lower pressure level If PS> than P-High,Then spontaneous breaths at both levels will be supported by PS P T Synchronized Transitions PEEP HIGH PEEP LOW T LOW T HIGH Synchronized Transitions PEEP High  + PS  P PEEP L PEEP H Pressure Support Spontaneous Breaths P Pressure Support T
Smartcare/NeoGanesh Complete Closed Loop
The “Zone of Respiratory Comfort” or “ZoRC” The 3 monitored parameters: •  spontaneous breath rate, fspn •  spontaneous tidal volume, VT •  etCO2 “ ZoRC”-Goals: Regulate Pressure Support to stabilize the patient within their ZoRC  2) Reduce PS stepwise ( in steps of 2 to 4 cmsH2o )  to no support, keeping the patient within their ZoRC. 3) Conduct a Spontaneous Breathing Trial with no support; if patient remains within ZoRC,  recommend separation from ventilator.
Smartcare   These therapeutic measures are based on a clinical protocol  that has been tested and verified during several years of development ..
SmartCare/PS the clinical evidence In February 2008, the FDA gave clearance for additional claims of efficacy SmartCare can  Reduce overall ventilation time by 33% Decrease ICU length of stay by up to 20% Reduce weaning duration by up to 40%
New Modes of Mechanical Ventilation: Summary Older modes & ventilators: passive, operator-dependant tools New modes on new generation ventilators: adaptively interactive to patient goal oriented Low operator activity Adapted from John J. Marini, MD; AARC congress, 11/98
The Evidence for New Ventilator Modes … It’s not the ventilator mode that makes a difference … …  It’s the skills of the clinician that makes the difference. Any ventilator mode has the potential to do harm! High level evidence is lacking that any new ventilator mode improves patient outcomes compared to existing lung-protective ventilation strategies. Dean Hess
Thank you Innovation and Automation is the future
 
PAV+ 80% with varying Demand Patient Work Machine Work
Amplification of Patient Effort •  Small at low levels and high at high levels •  20% Support-1.25:1 •  50% Support -2:1ratio  •  95% Support 20:1
Equation of Motion  for the respiratory system Paw + Pmus = V’ x R +   V x E Ventilator output   : Triggering, Cycling Control of flow, rise time and pressure Mechanical Patient response Chemical Reflex Behavioral
What is ASV?   Goal 2: Three-knob ventilation T p Rate P sup P insp T i T e @ V t Conventional ASV FiO 2 PEEP CMV SIMV PCV PSV
How do I apply ASV? Ideal Body Weight Ideal Body Weight You % Minute Volume
How do I apply ASV? Ideal Body Weight Test breaths You % Minute Volume Automatically applies 3 test breaths to determine lung characteristics
ASV

New modes of mechanical ventilation TRC

  • 1.
    Newer modes ofMechanical Ventilation Dr. T.R. Chandrashekar Director Critical Care K.R.Hospital Bangalore
  • 2.
    Outline of thetalk Which modes qualify as newer modes? Why newer modes were introduced ? Let us conceptualise the newer modes My classification of newer modes Do we require them? Evidence base A few important modes- I will discuss VAPS, PAV+, APRV/BIPAP, Smartcare
  • 3.
    SIMV PCV ACVCMV Basic Modes? PS Newer [Alternative] Modes ? Volume support (VS) Volume Assured Pressure Support (VAPS) Pressure regulated volume control ventilation (PRVC) Mandatory minute ventilation (MMV) PROPORTIONAL ASSIST VENTILATION(PAV) ADAPTIVE SUPPORT VENTILATION(ASV) Smartcare/Automatic tube Compensation BIPAP/DUOPAP Airway pressure release ventilation (APRV ) High Frequency Ventilation/oscillation Partial Liquid Ventilation (Perflurocarbon) Neurally Adjusted Ventilatory Assist (NAVA) Fractal ventilation
  • 4.
    What are PhysiciansDoing? 1,638 patients in 412 ICUs 47% Assist-Control Ventilation 46% Pressure Support and/or SIMV 7% Other Variability in modes across nations No variability in settings Esteban et al, AJRCCM 2000; 161:1450-8
  • 5.
    Modes of Ventilationduring Weaning Esteban et al, AJRCCM 2000;161:1450 PS SIMV + PS Intermittent SB trials Others SIMV Daily SB trials Number of ventilated patients, (%)
  • 6.
    Why New Modes?Address important clinical issues: Poor trigger Proportional assist to match patients effort Improve patient - ventilator synchrony! More rapid weaning! Less likelihood of VILI Less hemodynamic compromise More effectively ventilate/oxygenate! Satisfies our craving for adventure - (engineers and clinicians) We like better numbers - (seduction by pulse oximetry)
  • 7.
    Why newer modeswere introduced ? Let us conceptualise the newer modes
  • 8.
    Striving for betteroutcomes: The three • S pontaneous breathing (Girard 2008; MacIntyre 2000, Levine 2008) • S ynchrony (Chao 1997;Thille 2006; De Wit 2009) • S edation management (Kress 2000, Girard 2008, De Wit 2009) “S”s All reduce time on mechanical ventilation Nearly 50% time is spend on weaning
  • 9.
    Phases of ventilatorycycle Delay, Missed breaths Fatigue/VIDD/runaway
  • 10.
  • 11.
    Trigger in conventionalmodes We are targeting the last part of the cycle and Also add the delay from the Y piece or the machine end Trigger delay is inbuilt in the old modes
  • 12.
  • 13.
    Sinderby et al,Nature Med 1999;5:1433 Time (s) 0 1 4 3 2 0 1 4 3 2 Airway Pressure Trigger Onset of diaphragmatic electrical activity Onset of ventilator flow Neural Trigger 0 20 -5.0 0.0 0.0 0.5 -1 0 1 Flow (l/s) Volume (l) P es (cm H 2 O) P aw (cm H 2 O ) Missed breaths
  • 14.
    PAV+ vs. PCV/PSV example PCV 15 cmH2O PAV+ at 75% Compared to PCV, the PAV+ mode better matches patient’s effort to ventilator output. PAV+ P T P T P T P T P T P T Proportional support has synchronised inspiration to expiration cycling
  • 15.
    These can leadto disuse atrophy of the respiratory muscles (VIDD) or lowering of the CO 2 set point. Either case can delay weaning and result in more ventilator days! or M Younes. Proportional Assist Ventilation, A New Approach to Ventilatory Support. Theory. Am Rev Respir Dis 1992;145:114-120. The practitioner’s typical response to an increase in demand is what? we need to select a level of pressure support that is “ not too low, not too high, but just right”. Proportional support to patients effort which can change from breath to breath is ideal Increase support Sedate
  • 16.
    Proportional support isvital No Diaphragm activity Missed breaths Possibly to much pressure support which had suppressed the diaphragmatic activity Increase the PS
  • 17.
    Automated mechanical ventilationis the future A growing number of medical errors in the literature related to Workload Due to the shortage of personnel High frequency of severe ‘burnout syndrome’ among physicians and nurses working in ICUs. High frequency of staff turnover
  • 18.
    Automated mechanical ventilationis the future In the study by Donchin et al , Average number of activities per patient per day was 178 Activities related to breathing were the most frequent (26% of all activities) An estimated mean number of errors per patient per day was 1.7 Errors related to breathing were the second most frequent (23% of all errors), after errors related to data entry
  • 19.
    The Future ofMechanical Ventilation Advanced closed-loop systems -Reduce the staff workload and to reduce the duration of MV What is a Closed Loop Ventilation ? Automated mechanical ventilation is the future
  • 20.
    Closed Loop VentilationVentilator Patient Clinician Open Loop Ventilation Basic modes- PS/SIMV/CMV Set volume/presuure/flow Patient has to adapt to the ventilator Gets feedback on lung resistance/compliance Adapts to the patient- ASV/PAV+/NAVA Smartcare Intensivists brain
  • 21.
    My classification ofnew MODES Dual modes Which combine Volume mode + Pressure modes- VS, MMV, VAPS, PRVC etc… Modes which adapt to lung characteristics ( Resistance & Compliance) PAV+, ASV Spontaneous breathing + higher FRC- APRV/ BIPAP Knowledge based Weaning modes- Smartcare, ATC, PAV, ASV, NAVA Better trigger mechanism- NAVA
  • 22.
    Arguments Against NewModes Lack high-level evidence for better patient outcomes If we try a new mode and the patient has a good outcome, we say it was due to the new mode. But if try a new mode and there is a bad outcome, we say the patient was going to die anyway. Potential for harm (these are often not reported) Improved gas exchange does not necessarily improve outcomes: high tidal volume, iNO, prone New is not necessarily better Solution to a problem or in search of a problem?
  • 23.
    Better oxygenation, fasterweaning, lesser sedation, less Asynchrony YES- BUT mortality benefit not proved Dual modes most popular but no great evidence BIPAP no great evidence NAVA -emerging evidence even in children and NIV ASV- physiological mode –accumulating evidence (ARDS/COPD) PAV +-better than PAV, physiological mode –accumulating evidence, NIV good evidence Smartcar e-unique mode can say ventilator has intensivist’s brain-good evidence for weaning
  • 24.
    I will discussthese modes Dual modes- VAPS – PAV+, BIPAP Smartcare VS/PRVC/MMR/MMV etc.. ASV /APRV / ATC/NAVA
  • 25.
  • 26.
    Lung Compliance Changesand the P-V Loop Volume (mL) PIP levels Preset V T P aw (cm H 2 O) Volume Targeted Ventilation COMPLIANCE Increased Normal Decreased
  • 27.
    Volume Control :good and bad Guaranteed tidal volume- even with variable compliance and resistance. Less atelectasis compared to pressure control. Can cause excessive airway pressure-VILI The limited flow available may not meet the patient’s desired inspiratory flow rate-asynchrony Leaks = Volume loss
  • 28.
    Lung Compliance Changes and the P-V Loop Volume (mL) Preset PIP V T levels P aw (cm H 2 O) COMPLIANCE Increased Normal Decreased Pressure Targeted Ventilation
  • 29.
    Pressure Control :good and bad • Limits excessive airway pressure • Improves gas distribution • Less VT as pulmonary mechanics change-atelectasis • Potentially excessive VT as compliance improves
  • 30.
    1.Set Tidal VolumeWith 2. Safer Pressure Limit Target
  • 31.
    60 -20 60Flow L/min Volume Switch from Pressure control to Volume control L 0 0.6 40 VAPS-Volume assured Pressure Support Normal PS If Compliance decreases P aw cmH 2 0 Set tidal volume cycle threshold Set pressure limit Tidal volume met Tidal volume not met Flow cycle
  • 32.
    Dual Modes Volumetarget achieved-can target a pressure limit Issues not addressed Trigger delay Proportional support-VIDD/fatigue Not taking into account lung mechanic’s resistance/compliance Not physiological -asynchrony
  • 33.
    PAV +(Proportional AssistVentilation) Provides pressure, flow assist, and volume assist in proportion to the patient’s spontaneous effort, the greater the patient’s effort, the higher the flow, volume, and pressure The operator sets the ventilator’s volume and flow assist at approximately 80% of patient’s elastance and resistance. The ventilator then generates proportional flow and volume assist to augment the patient’s own effort
  • 34.
    PAV+ uses thecompliance and resistance information collected every 4-10 breaths to know what it’s fighting against . PAV+ uses the flow and volume information collected every 5 milliseconds to know what the patient wants. PAV+ combines this data with the %Supp information input by the clinician to determine how much pressure to supply to the system. PAV+
  • 35.
    The clinician willNOT set a rate, tidal volume, flow or target pressure. Instead, the clinician will simply set the percentage of work that the ventilator should do. f %Supp x x x x PAV+ V . V t P i
  • 36.
    PAV+ Start patientsat 70% and wean back to stabilize When disease process has sufficiently reversed, decrease %Support over 2 hr intervals
  • 37.
    + PAV+ PotentialBenefits 1. Comfort. 2. Lower peak airway pressure. 3. Less need for paralysis and/or sedation. 4. Less likelihood for over ventilation. 5. Preservation and enhancement of patient’s own control mechanisms such as metabolic ABG control and Hering-Breuer reflex. Some patients have a high rate normally, so a high rate on PAV + may or may not reflect distress; check other signs; Try increasing assist to see if rate goes down Don’t be surprised if RR climbs when switching from other modes
  • 38.
    Circuit MUST befree of large leaks (small leaks are okay). No external nebulizers which add flow. PAV+ Limitations PAV+ is NOT recommended for… Low Respiratory drive Abnormal breathing pattern Extreme air trapping Large mechanical leaks.
  • 39.
    APRV/BIPAP Maintain highFRC-better oxygenation Lung in safe zone-less de-recruitment /VILI Spontaneous breaths- diaphragm is active hence less VIDD/better Hemodynamics Less sedation and analgesia? Conflicting results APRV is IRV hence more impetus on Oxygenation/ synchrony problems persist BIPAP- less synchrony problems Keeps the lung in lung protective zone Keeps the lung in lung protective zone
  • 40.
    APRV settings Paw T high (4-5) Sec T low P high P low ( 1 sec) Time-triggered, Time-cycled, Pressure-limited, Spontaneous breathing is allowed at any point during the ventilatory cycle FLOW P high -This parameter is set with the goal of improving oxygenation. P low -The setting of this parameter has the goal of facilitating ventilation or CO2 clearance. It is this inverse inspiratory:expiratory (I:E) ratio that distinguishes APRV from bi-level positive airway pressure (BiPAP=1:1)
  • 41.
    BiLevel Ventilation: Uses2 pressure levels for 2 time periods PEEP low & PEEP high , T high and T low Patient triggering & cycling can change phases If PS is set higher than PEEP H , the PS pressure is applied to a spontaneous effort at upper pressure If set PS < than Phigh then only applied in the lower pressure level If PS> than P-High,Then spontaneous breaths at both levels will be supported by PS P T Synchronized Transitions PEEP HIGH PEEP LOW T LOW T HIGH Synchronized Transitions PEEP High + PS P PEEP L PEEP H Pressure Support Spontaneous Breaths P Pressure Support T
  • 42.
  • 43.
    The “Zone ofRespiratory Comfort” or “ZoRC” The 3 monitored parameters: • spontaneous breath rate, fspn • spontaneous tidal volume, VT • etCO2 “ ZoRC”-Goals: Regulate Pressure Support to stabilize the patient within their ZoRC 2) Reduce PS stepwise ( in steps of 2 to 4 cmsH2o ) to no support, keeping the patient within their ZoRC. 3) Conduct a Spontaneous Breathing Trial with no support; if patient remains within ZoRC, recommend separation from ventilator.
  • 44.
    Smartcare These therapeutic measures are based on a clinical protocol that has been tested and verified during several years of development ..
  • 45.
    SmartCare/PS the clinicalevidence In February 2008, the FDA gave clearance for additional claims of efficacy SmartCare can Reduce overall ventilation time by 33% Decrease ICU length of stay by up to 20% Reduce weaning duration by up to 40%
  • 46.
    New Modes ofMechanical Ventilation: Summary Older modes & ventilators: passive, operator-dependant tools New modes on new generation ventilators: adaptively interactive to patient goal oriented Low operator activity Adapted from John J. Marini, MD; AARC congress, 11/98
  • 47.
    The Evidence forNew Ventilator Modes … It’s not the ventilator mode that makes a difference … … It’s the skills of the clinician that makes the difference. Any ventilator mode has the potential to do harm! High level evidence is lacking that any new ventilator mode improves patient outcomes compared to existing lung-protective ventilation strategies. Dean Hess
  • 48.
    Thank you Innovationand Automation is the future
  • 49.
  • 50.
    PAV+ 80% withvarying Demand Patient Work Machine Work
  • 51.
    Amplification of PatientEffort • Small at low levels and high at high levels • 20% Support-1.25:1 • 50% Support -2:1ratio • 95% Support 20:1
  • 52.
    Equation of Motion for the respiratory system Paw + Pmus = V’ x R +  V x E Ventilator output : Triggering, Cycling Control of flow, rise time and pressure Mechanical Patient response Chemical Reflex Behavioral
  • 53.
    What is ASV? Goal 2: Three-knob ventilation T p Rate P sup P insp T i T e @ V t Conventional ASV FiO 2 PEEP CMV SIMV PCV PSV
  • 54.
    How do Iapply ASV? Ideal Body Weight Ideal Body Weight You % Minute Volume
  • 55.
    How do Iapply ASV? Ideal Body Weight Test breaths You % Minute Volume Automatically applies 3 test breaths to determine lung characteristics
  • 56.

Editor's Notes

  • #13 NAVA Training Presentation 2007 NAVA Training Presentation.ppt The electrical discharge of the diaphragm is captured through the introduction of an Edi Catheter fitted with an electrode array. Since NAVA uses the Edi to control the ventilator, it is important to understand what the signal represents. All muscles (including the diaphragm and other respiratory muscles) generate electrical activity to excite muscle contraction. This electrical excitation is controlled by nerve stimulus and controlled in magnitude by adjusting the stimulation frequency (rate coding) or by adjusting the numbers of nerves that are sending the stimulus (nerve fiber recruitment). Both, the rate coding and nerve fiber recruitment will be transmitted into muscle fiber motor unit action potentials which will be summed both in time and space producing the intensity of the electrical activity measured on the muscle. To reduce the influence of external noise, the measurement of the muscle electrical activity is performed by bipolar differential recordings, where the signal difference between two single electrodes is measured. For example the resting Edi measured with electrodes in the esophagus in a healthy subject typically ranges between a few and 10 μ V. Patients with chronic respiratory insufficiency may demonstrate signals 5-7 times stronger. Due to the differential recording and low signal amplitude, measurement of Edi is sensitive to electrode filtering, external noise, and cross-talk from other muscles e.g. the heart which produces electrical amplitudes of about 10-100 times that of the diaphragm. Since, the Edi must always be present to initiate a contraction of the diaphragm it should always be possible to record the signal in healthy subjects
  • #15 LRF -This slide shows how PAV+ software may improve ventilator synchrony. -The top three boxes represent pressure vs. time for PCV while the bottom three boxes represent the same thing for PAV+ software. -The green line represents the effort input from the patient’s diaphragm and the red line represents the pressure output from the ventilator. -In PCV the ventilator’s output is the same despite changes in the diaphragm’s input. -In PAV+ mode, the machine’s output mirrors the input of the diaphragm. -If the patient pulls a little bit, the vent pushes a little bit. If the patient pulls a lot then the vent pushes a lot.
  • #16 LRF M Younes. Proportional Assist Ventilation, A New Approach to Ventilatory Support. Theory. Am Rev Respir Dis 1992;145:114-120.
  • #38 LRF -Potential benefits as listed by Dr Younes in one of his early papers. M Younes. Proportional Assist Ventilation, A New Approach to Ventilatory Support. Theory. Am Rev Respir Dis 1992;145:114-120.
  • #41 So, there are only four settings for APRV as seen on this graph of airway pressure and flow : • the high pressure, P- high, the CPAP level to keep the lungs open, • the duration, or time, that the CPAP pressure is held at the airway, called T- high, • the release pressure, P- low, that allows additional CO2 removal, • and the duration, or time, that pressure is released, called T- low. We see flow in and out of the lungs with spontaneous breathing during the time that the higher pressure is applied to the airway. And here we see the larger flow, or exhaled volume, from the lungs during the release. Again, it’s very important that the release time be short so that lung volume is maintained. How can we assess that? Well, I’d love to be able to actually measure FRC at the bedside in the ICU, but that really isn’t practical today. Notice that the expiratory flow tracing during the release doesn’t reach the zero line before the high pressure is re- applied. Because flow is still coming from the lungs, we know that volume remains in the lungs. In other words, we are intentionally trapping gas in the lung by limiting the release time. When we set T- high, we are really setting the frequency of releases, which is like setting the ventilator rate.
  • #54 It was decided that the third knob would be Minute Volume: the volume of gas delivered to the patient every minute. So there we have it: One mode. And three controls. Three knob ventilation. The first design goal. [Click: Next slide.]
  • #55 Then, just once, and never again for this patient , you enter an indication of the patient’s body size. And the body size indicator that ASV uses is Ideal Body Weight . That’s a reference point for ASV to use. If you are not sure where to get this information, you will find it on a chart hanging on the ventilator. You look up the patient’s height. And the table gives you his ideal body weight. [Pause.] And that’s it! That’s what you have to do. From this point on, ASV does everything else automatically. Pretty simple... You set up the minute volume. ASV does everything else. You can see why we say that ASV is suitable for non-specialist operators! So! What exactly does ASV do? [Click: Next slide.]
  • #56 [Point out to the audience that the operator is doing nothing!] This is what happens – and happens completely automatically: ASV starts by giving the patient three test breaths to determine – amongst other things – the compliance, or pressure/volume ratio of the lung. Remember: ASV only delivers these three test breaths once. [Click: Next slide.]