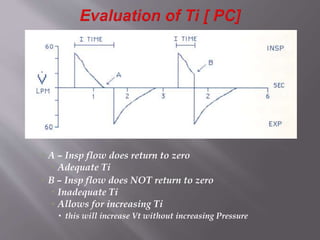
Downloaded 1,198 times
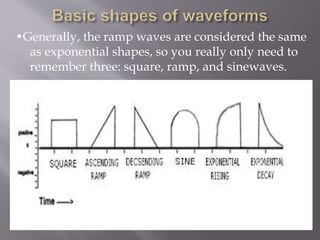
![ Distinguishing breath type
Trigger Sensitivity
Plateau pressure
Rate & I:E
Peak Flow [VC]
PS characteristics
Lung mechanics](https://image.slidesharecdn.com/ventilatorgraphics-140711120058-phpapp02/85/Ventilator-graphics-12-320.jpg)
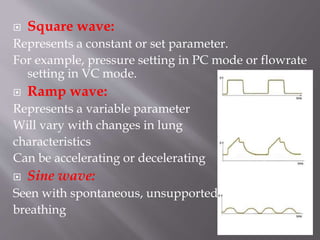
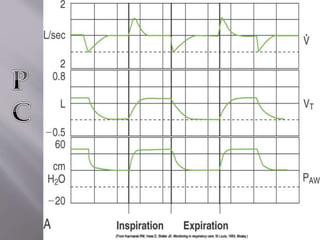
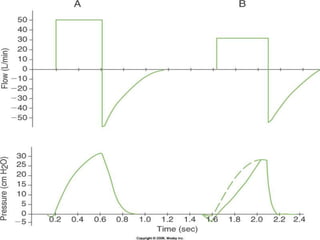
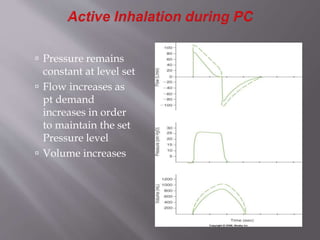
![ Press wave is square [constant]
P wave is not affected by lung mechanics or pt flow
demand
Flow rate is according to lung mechanics, set P, & Insp
effort by pt
Flow wave rises rapidly to meet set P, then decreases
to a point necessary to maintain set P. [ expo decay or
continuously variable decelerating pattern]
Note the P & V plateaus in regard to the Flow which
ends before Ti is over
This condition provides the greatest volume
possible for that set P
Indicates the lung has met equilibrium [Plateau]](https://image.slidesharecdn.com/ventilatorgraphics-140711120058-phpapp02/85/Ventilator-graphics-14-320.jpg)
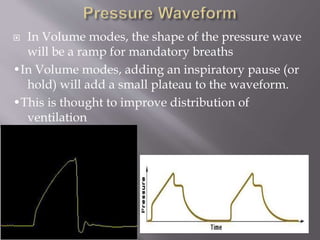
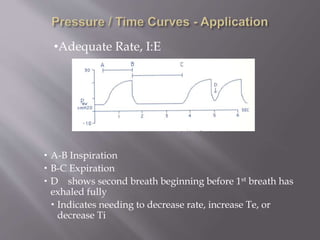
![ This condix has a much shorter Ti [not allowing for
Plateau] but for a longer Te
Delivered volume is slightly decreased](https://image.slidesharecdn.com/ventilatorgraphics-140711120058-phpapp02/85/Ventilator-graphics-16-320.jpg)
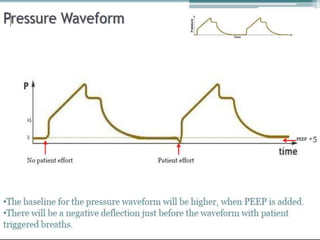
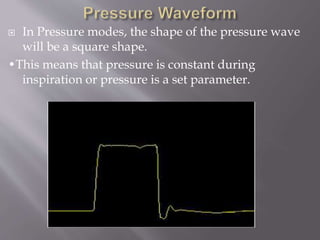
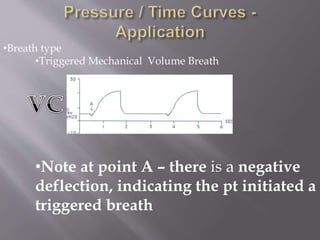
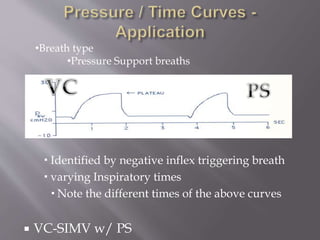
![•Breath type
Mechanical breath [volume]
•Note at point A – there is no negative deflex
•Consistent Ti & Volume delivery
•Pressure continues to rise until set V is
reached, then breath cycles](https://image.slidesharecdn.com/ventilatorgraphics-140711120058-phpapp02/85/Ventilator-graphics-22-320.jpg)
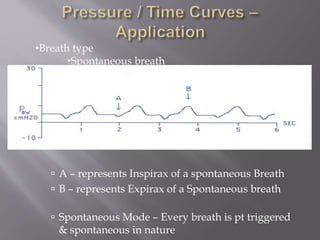
![•Breath type
•Mechanical Breath [ Pressure]
Consistent Ti & Pressure delivery
•P reaches limit early in I and holds
for Ti
•No Trigger](https://image.slidesharecdn.com/ventilatorgraphics-140711120058-phpapp02/85/Ventilator-graphics-23-320.jpg)
![ A – scooped out waveform b/c
inadequate flow for pt demand
B – bulging indicates too much flow
•Adjusting Peak Flow [ VC]](https://image.slidesharecdn.com/ventilatorgraphics-140711120058-phpapp02/85/Ventilator-graphics-28-320.jpg)

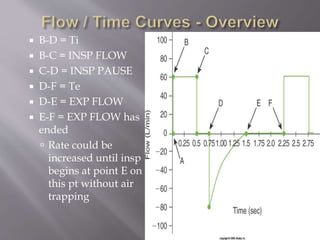
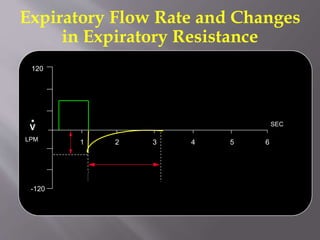
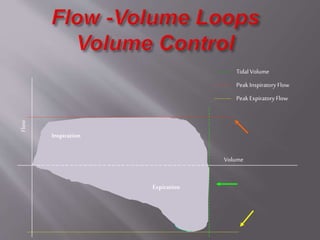
![ Y axis = flow
X axis = Time
A-B = inspiration
Above x axis
B-C = Expirax
Below X axis
D- Peak Inspiratory
Flow
E = Peak Expiratory
Flow [ PEFR]](https://image.slidesharecdn.com/ventilatorgraphics-140711120058-phpapp02/85/Ventilator-graphics-37-320.jpg)

![ Dashed line plotted
based on the Static
Compliance calculation
drawn from zero to
peak PA
Peak PA – Pstatic or
Pplat
Note that the point
at which Peak PA is
also the point
where the volume
plateaus
PTA = xairway
pressure
[difference b/w the
airway
opening(Pawo) and
the Alveoli (PA)]](https://image.slidesharecdn.com/ventilatorgraphics-140711120058-phpapp02/85/Ventilator-graphics-56-320.jpg)
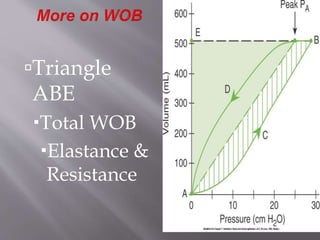
![ Triangle APAE
Represents the amount of
mechanical work to
overcome the compliance
[elastic forces] of the chest
Area ACBPA represents
amount of work to
overcome Raw during
Insp
Triangle APAD represents
amount of work to
overcome Raw during
Exp
The insp area [area w/in
the hysteresis] represents
total WOB due to Raw](https://image.slidesharecdn.com/ventilatorgraphics-140711120058-phpapp02/85/Ventilator-graphics-58-320.jpg)
![PTA = xairway pressure
[difference b/w the
airway
opening(Pawo) and
the Alveoli (PA)]
Represents the
amount of pressure
needed to overcome
resistance of the
lung
If Raw increases
this distance will
increase
If flow [turbulence]
increases, so does
this distance](https://image.slidesharecdn.com/ventilatorgraphics-140711120058-phpapp02/85/Ventilator-graphics-59-320.jpg)
![ Slope = line drawn
from zero through the
Pplat
As slope increases [
Pplat decreases]
compliance increases
for a set volume
As slope decreases [
Pplat increase]
compliance decreases
for a set volume](https://image.slidesharecdn.com/ventilatorgraphics-140711120058-phpapp02/85/Ventilator-graphics-61-320.jpg)
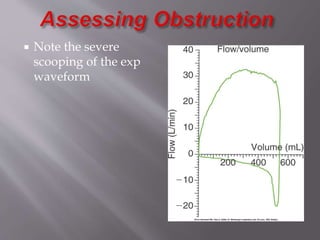
![ A – normal Raw & exp
flow
B – increased Raw &
reduced exp flow
C – markedly
increased Raw &
reduced exp flow
Insp flow is unaffected
by Raw b/c the vent is
delivering a constant
flow [square
waveform]](https://image.slidesharecdn.com/ventilatorgraphics-140711120058-phpapp02/85/Ventilator-graphics-71-320.jpg)
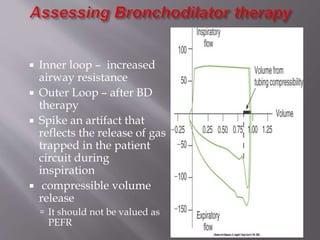
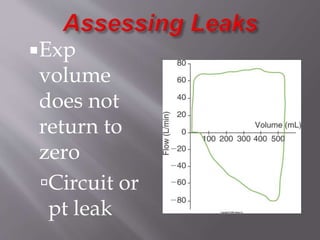
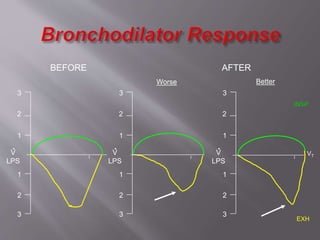


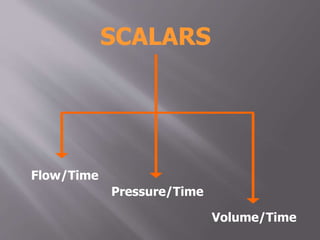
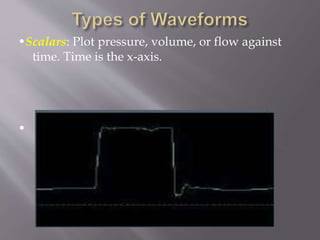
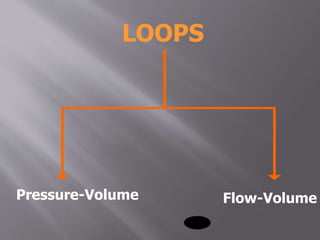
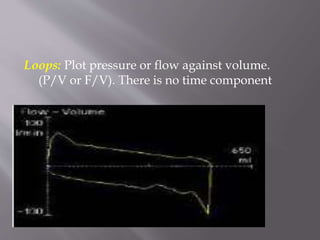
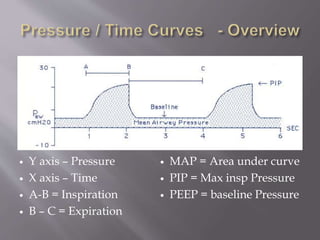
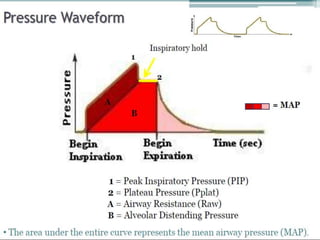
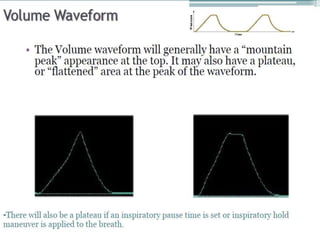
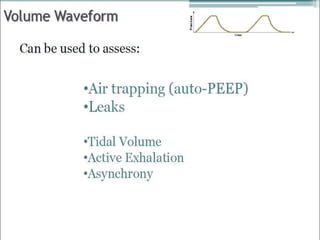
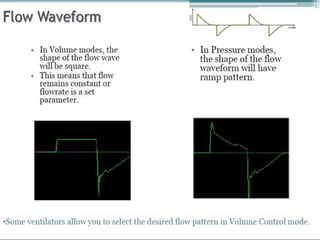
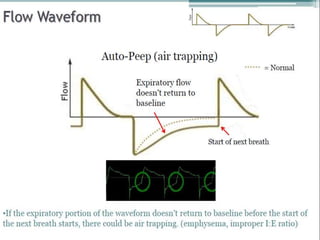
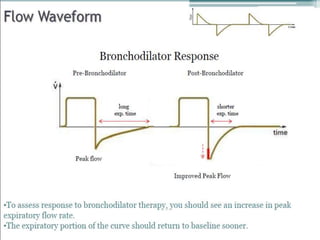
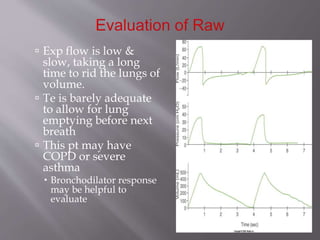
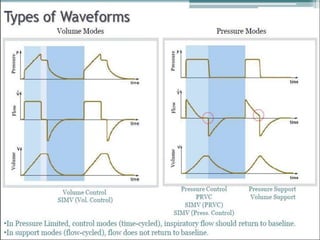
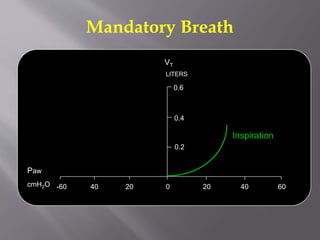
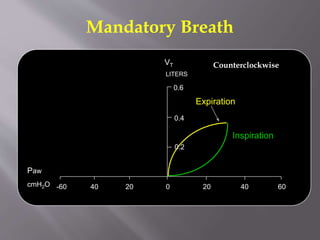
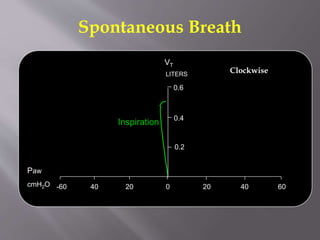
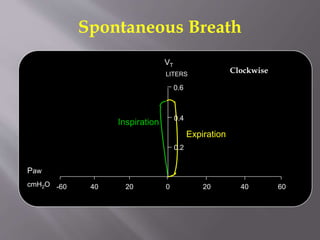
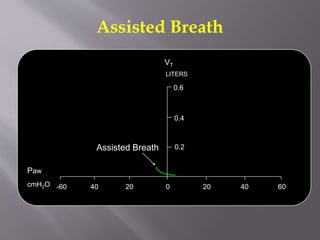
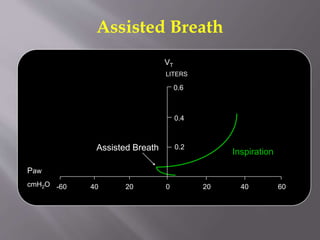
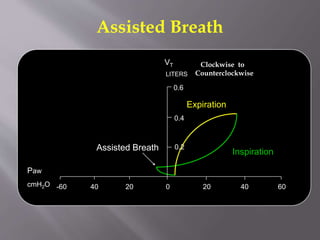
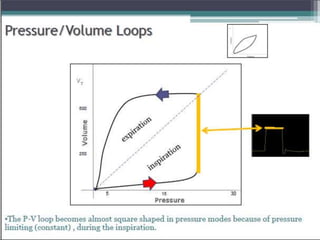
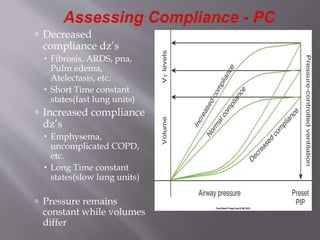
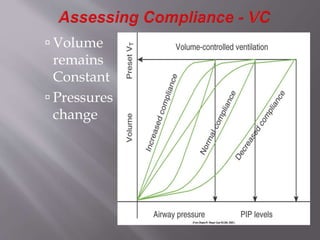
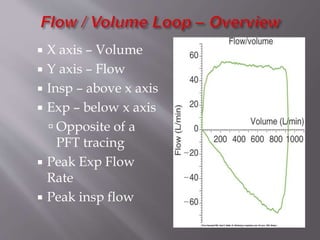
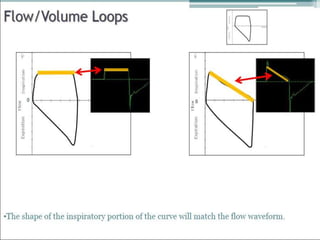
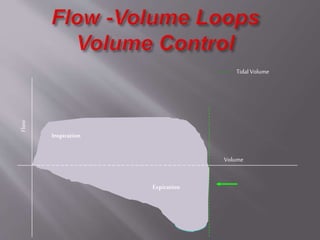
Mechanical ventilation graphics provide important information to interpret patient response, disease status, and ventilator function. Scalars plot pressure, volume, or flow over time, while loops plot pressure versus volume or flow versus volume with no time component. Common waveforms include square, ramp, and sine waves. Pressure modes result in square pressure waves while volume modes produce ramp waves. Loops can indicate breath type and assess issues like air trapping, resistance, compliance, and asynchrony. Graphical analysis is a critical tool for ventilator management and optimization.


![Dual controlled modes of mechanical ventilation [onarılmış]](https://cdn.slidesharecdn.com/ss_thumbnails/dualcontrolledmodesofmechanicalventilationonarlm-151116121024-lva1-app6891-thumbnail.jpg?width=640&height=640&fit=bounds)


![PERI-PROSTHETIC FRACTURE NAIL-PLATE CONSTRUCT [NPC].pptx](https://cdn.slidesharecdn.com/ss_thumbnails/drarunkumardrmohamedashrafperiprostheticfrasturenail-plateconstructnpc-260209164459-7e9d15a1-thumbnail.jpg?width=640&height=640&fit=bounds)


