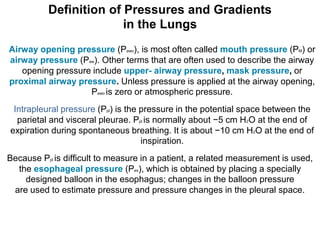
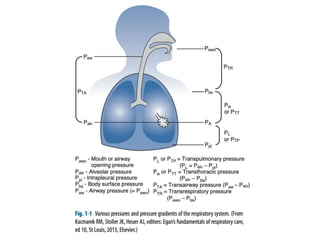
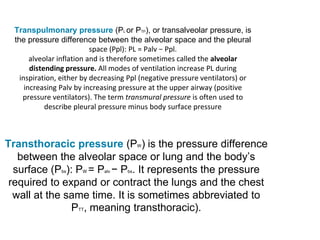
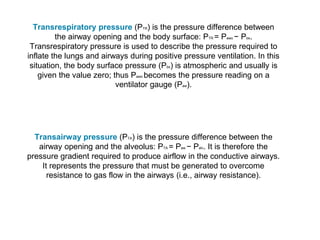
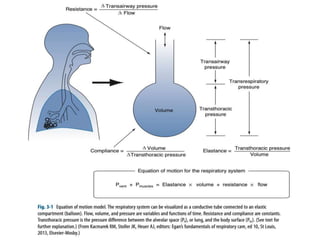
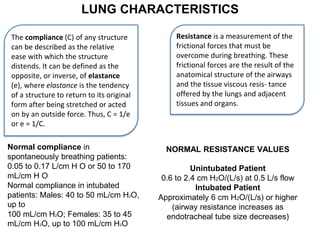
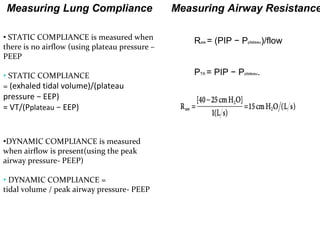
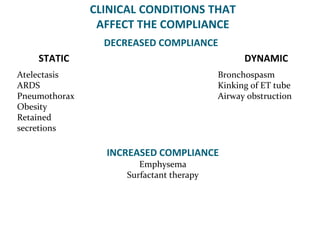
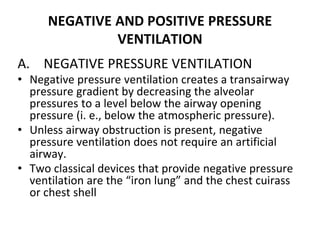
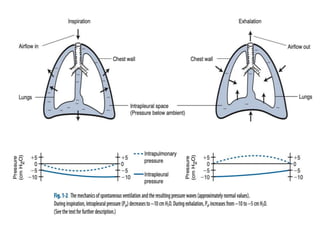
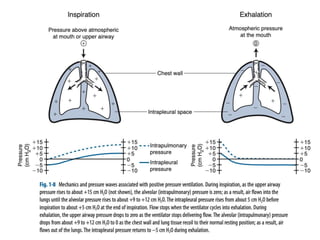
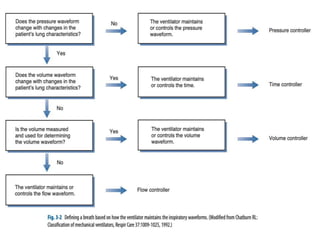
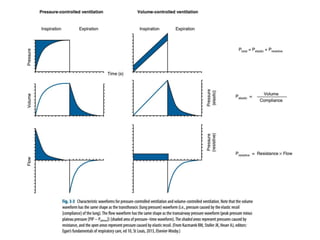
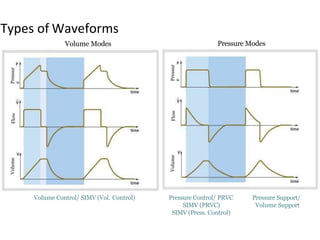
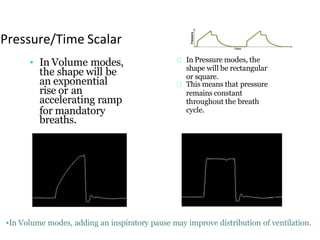
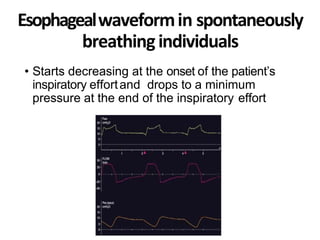
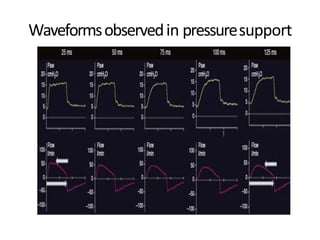
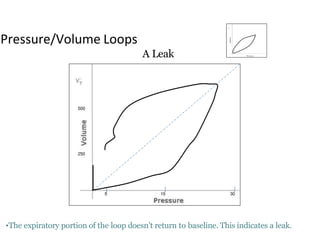
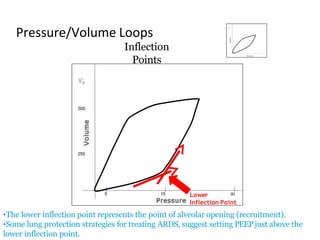
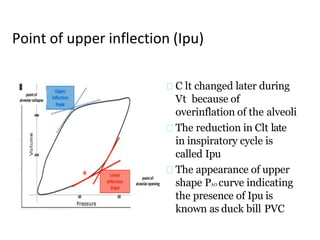
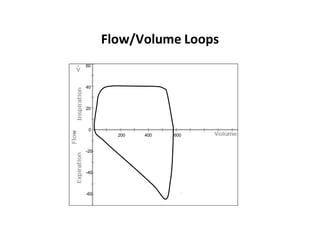
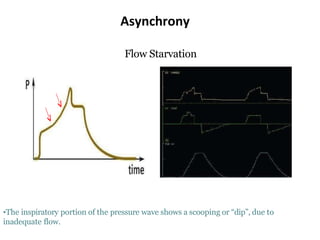
This document defines key terms and concepts related to mechanical ventilation. It discusses pressures such as airway opening pressure, intrapleural pressure, transpulmonary pressure, and others. It also describes lung characteristics like compliance and resistance. The document outlines the basics of negative and positive pressure ventilation. It discusses variables that control the ventilator cycle, including triggers, limits, and cycles. Finally, it examines various waveforms produced by mechanical ventilation like pressure/time scalars and esophageal pressure curves.
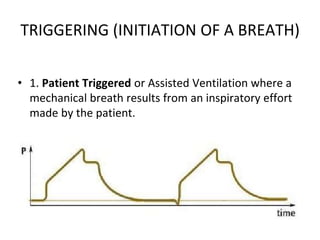


![Dual controlled modes of mechanical ventilation [onarılmış]](https://cdn.slidesharecdn.com/ss_thumbnails/dualcontrolledmodesofmechanicalventilationonarlm-151116121024-lva1-app6891-thumbnail.jpg?width=640&height=640&fit=bounds)


