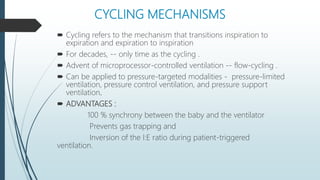
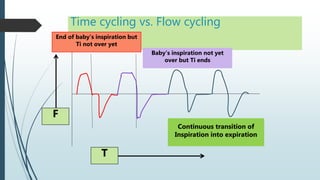
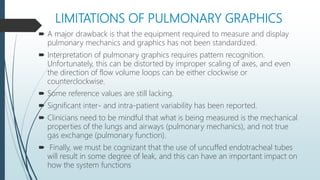
Downloaded 106 times

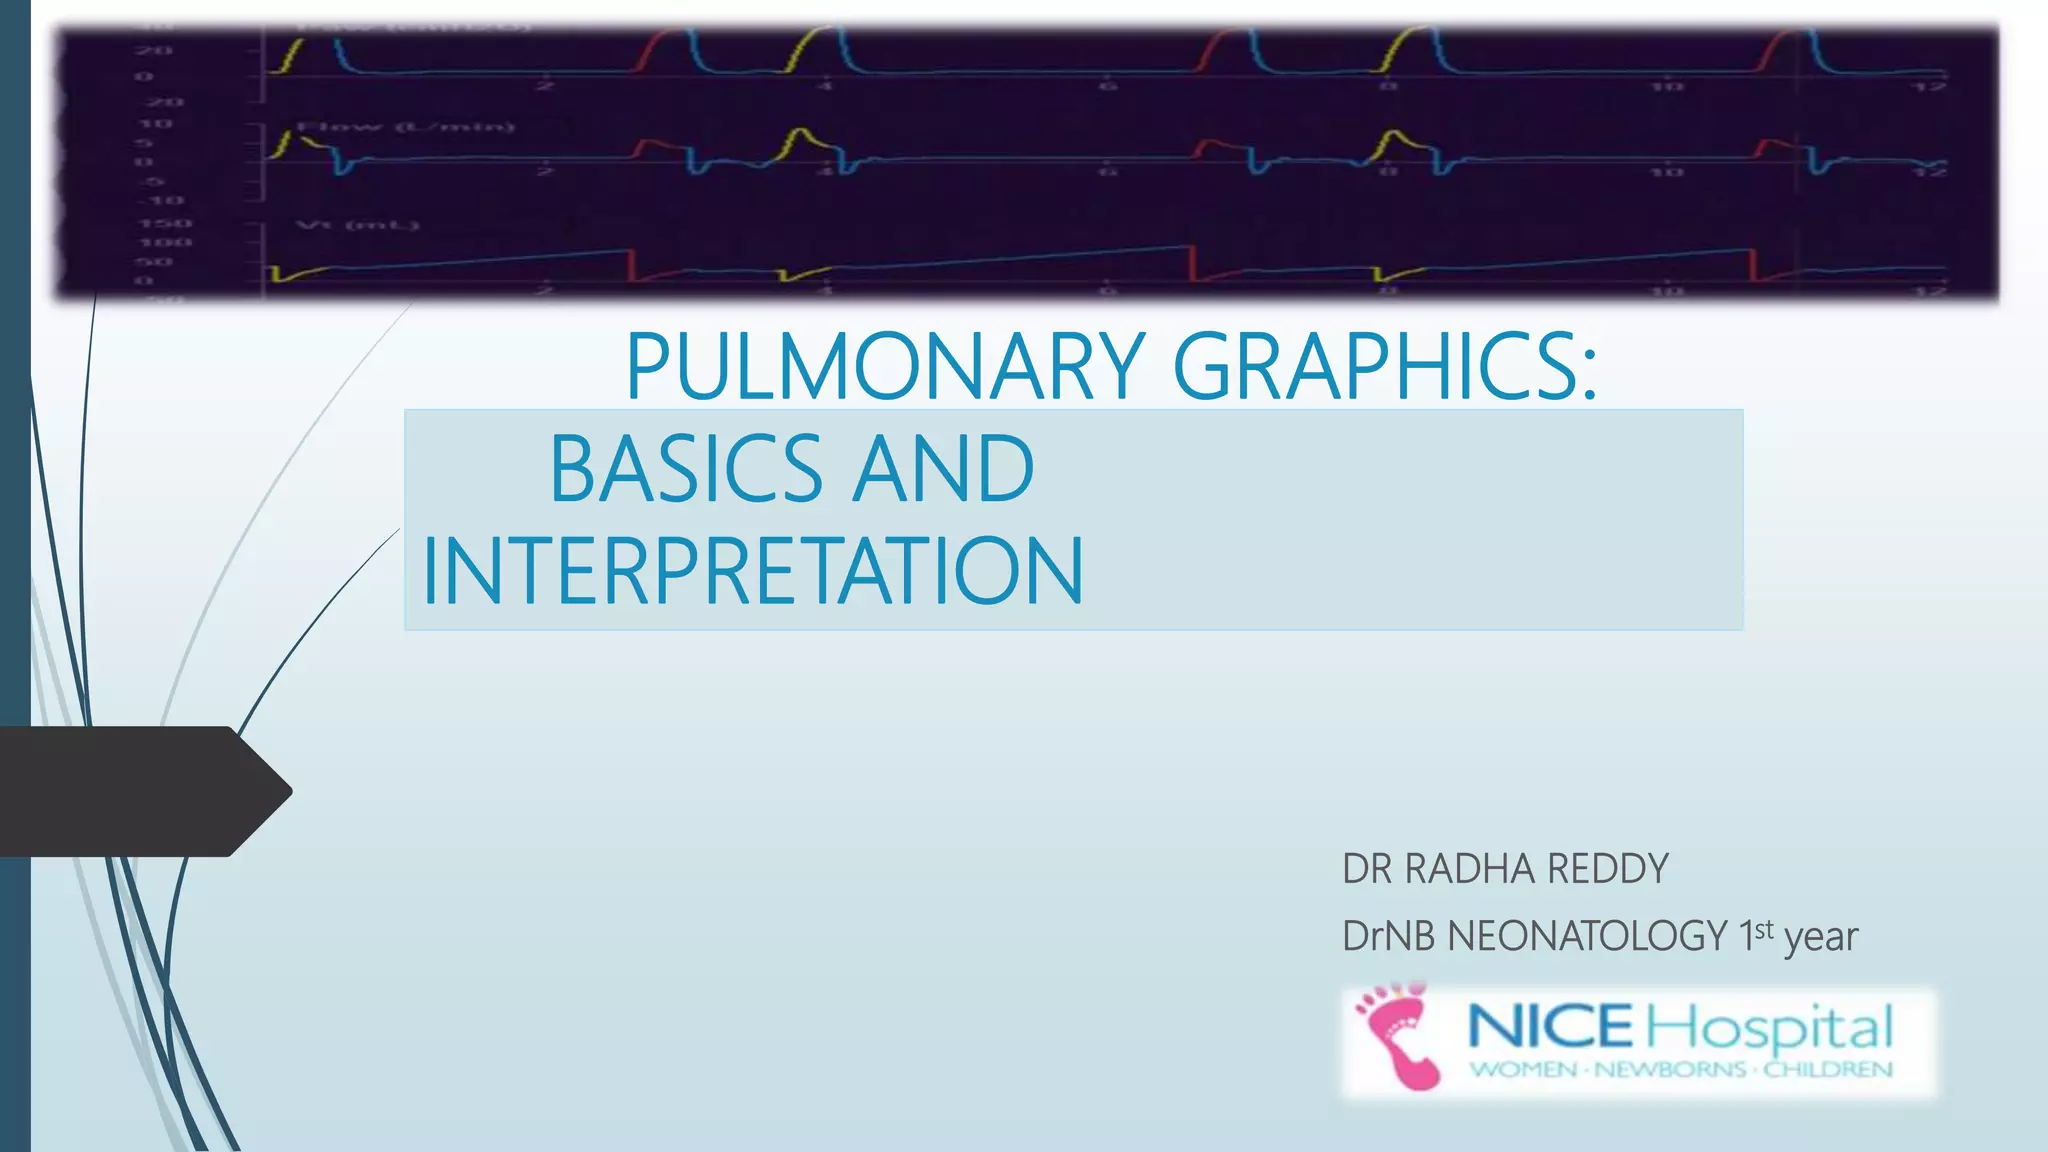
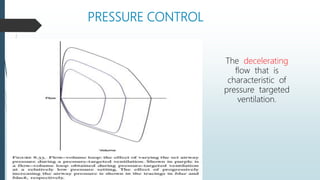
![MECHANICAL BREATH [PRESSURE CONTROL]
Consistent Ti & Pressure delivery
•P reaches limit early in I and holds for Ti
(square)
•No Trigger](https://image.slidesharecdn.com/pulmonarygraphicsradha-220303194504/85/Pulmonary-graphics-radha-17-320.jpg)
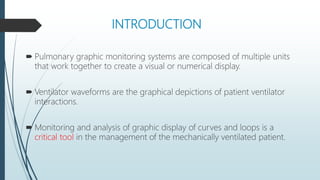
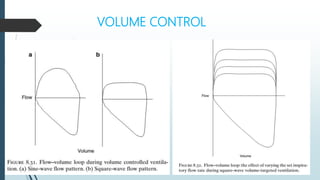
![MECHANICAL BREATH [VOLUME CONTROL]
At point A – there is no negative deflection
•Consistent Ti & Volume delivery
•Pressure continues to rise until set V is reached, then breath cycles
•classically a “shark-fin” appearance, where an initially rapid rise in pressure is
followed by a gradual attainment of a peak inspiratory pressure (PIP).](https://image.slidesharecdn.com/pulmonarygraphicsradha-220303194504/85/Pulmonary-graphics-radha-19-320.jpg)

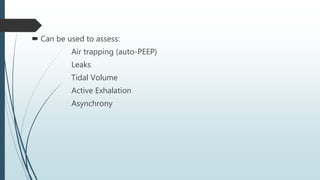
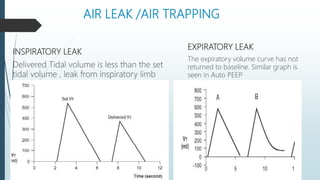
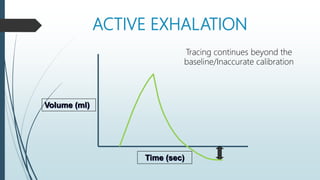
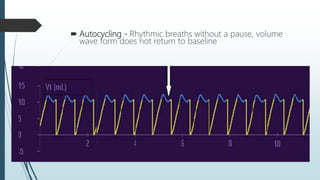


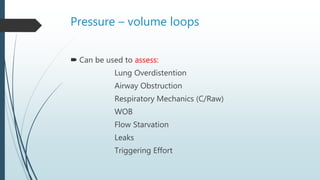


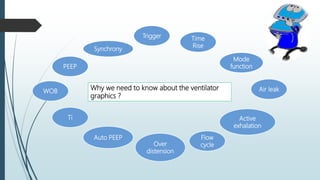
This document provides an overview of pulmonary graphics and ventilator waveforms. It discusses the basics of how ventilator monitoring systems work and the importance of interpreting graphic displays. The key ventilator waveforms of pressure-time, volume-time, flow-time and pressure-volume loops are described. Specific features of each waveform are defined, and they can be analyzed to evaluate lung mechanics, respiratory system pressures, gas trapping, leaks, asynchrony, and other factors. Understanding ventilator graphics is critical for optimizing ventilator settings and managing mechanically ventilated patients.


![Mechanical ventilation[1]](https://cdn.slidesharecdn.com/ss_thumbnails/mechanicalventilation1-150109002450-conversion-gate01-thumbnail.jpg?width=640&height=640&fit=bounds)


