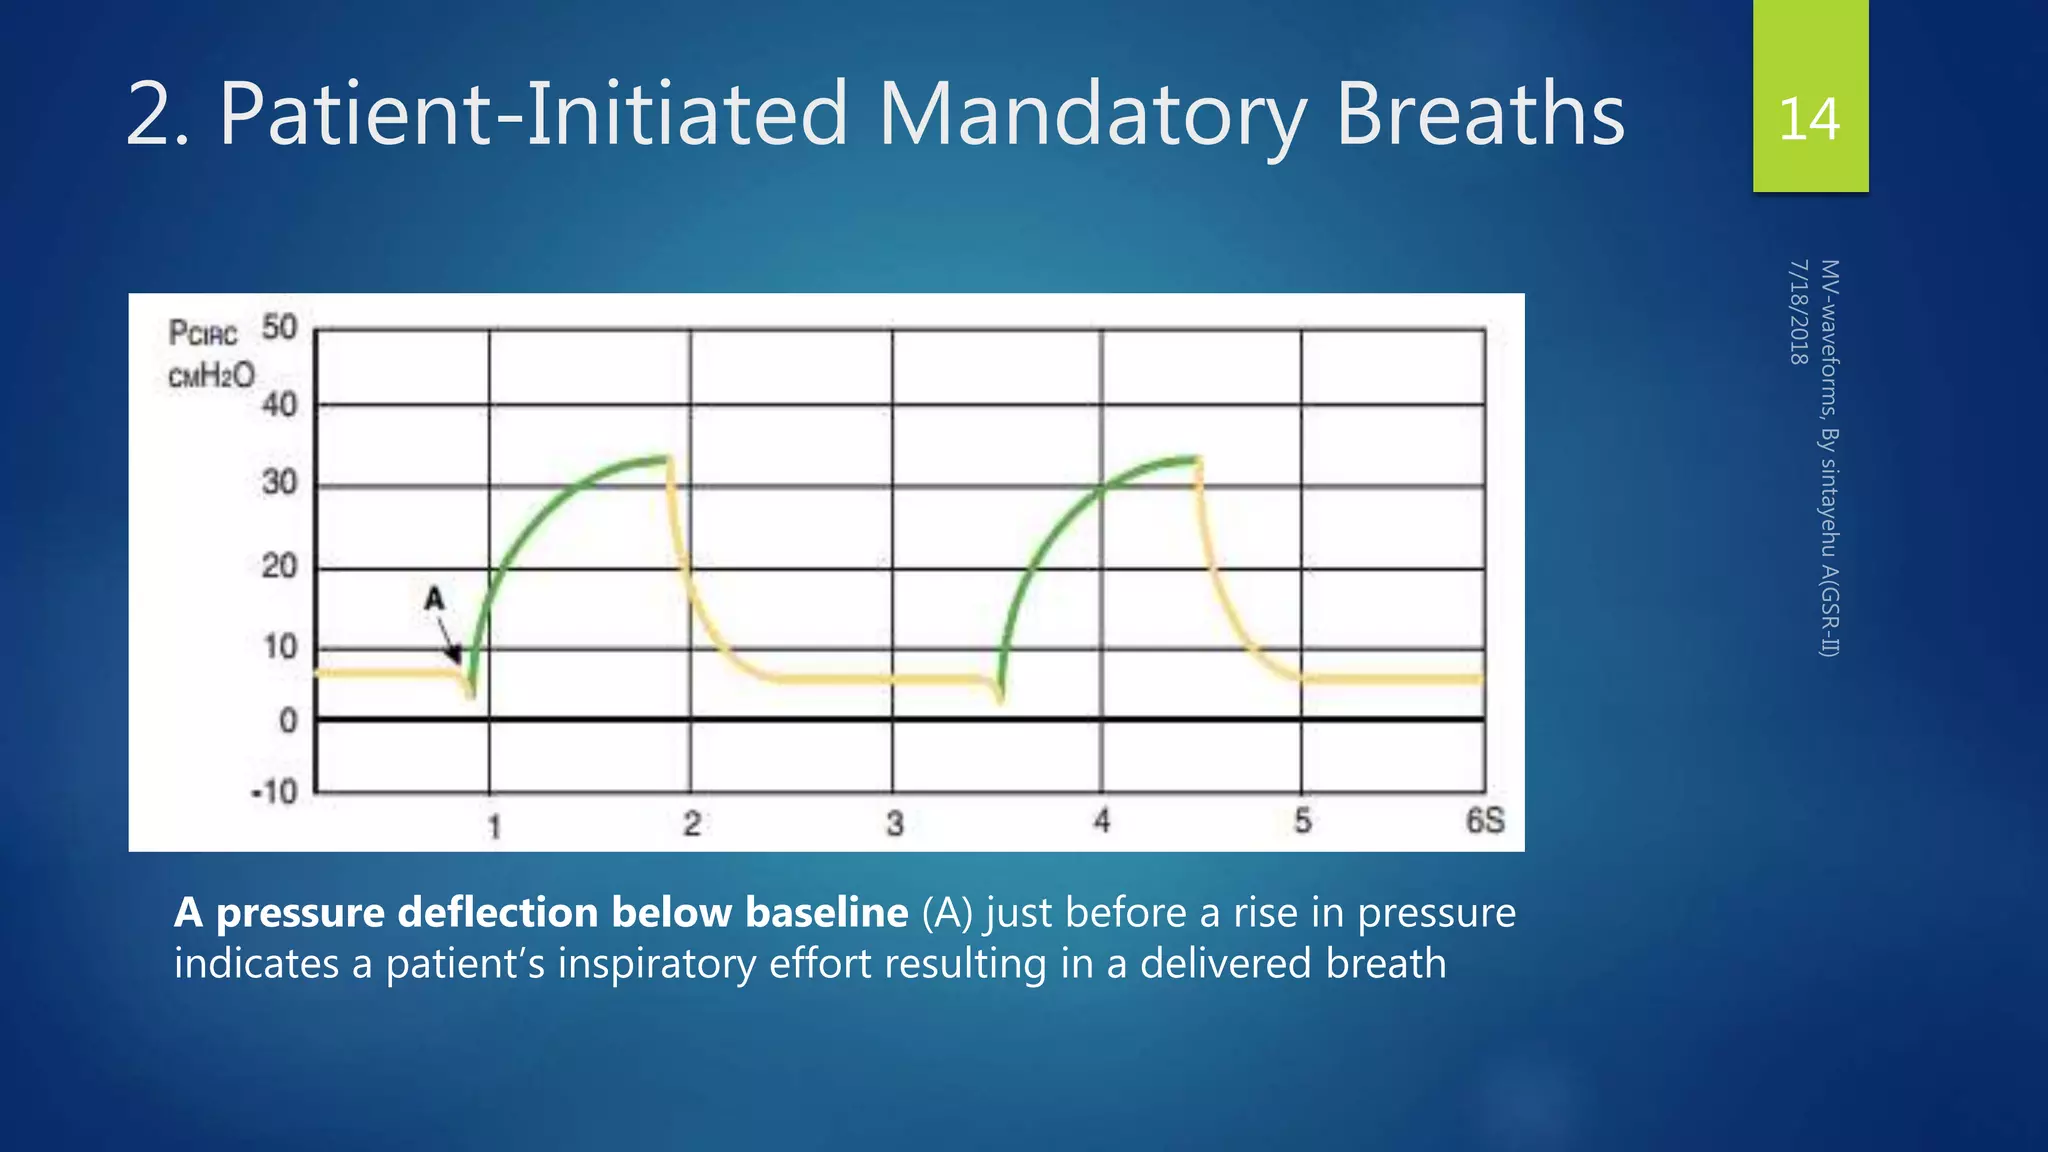
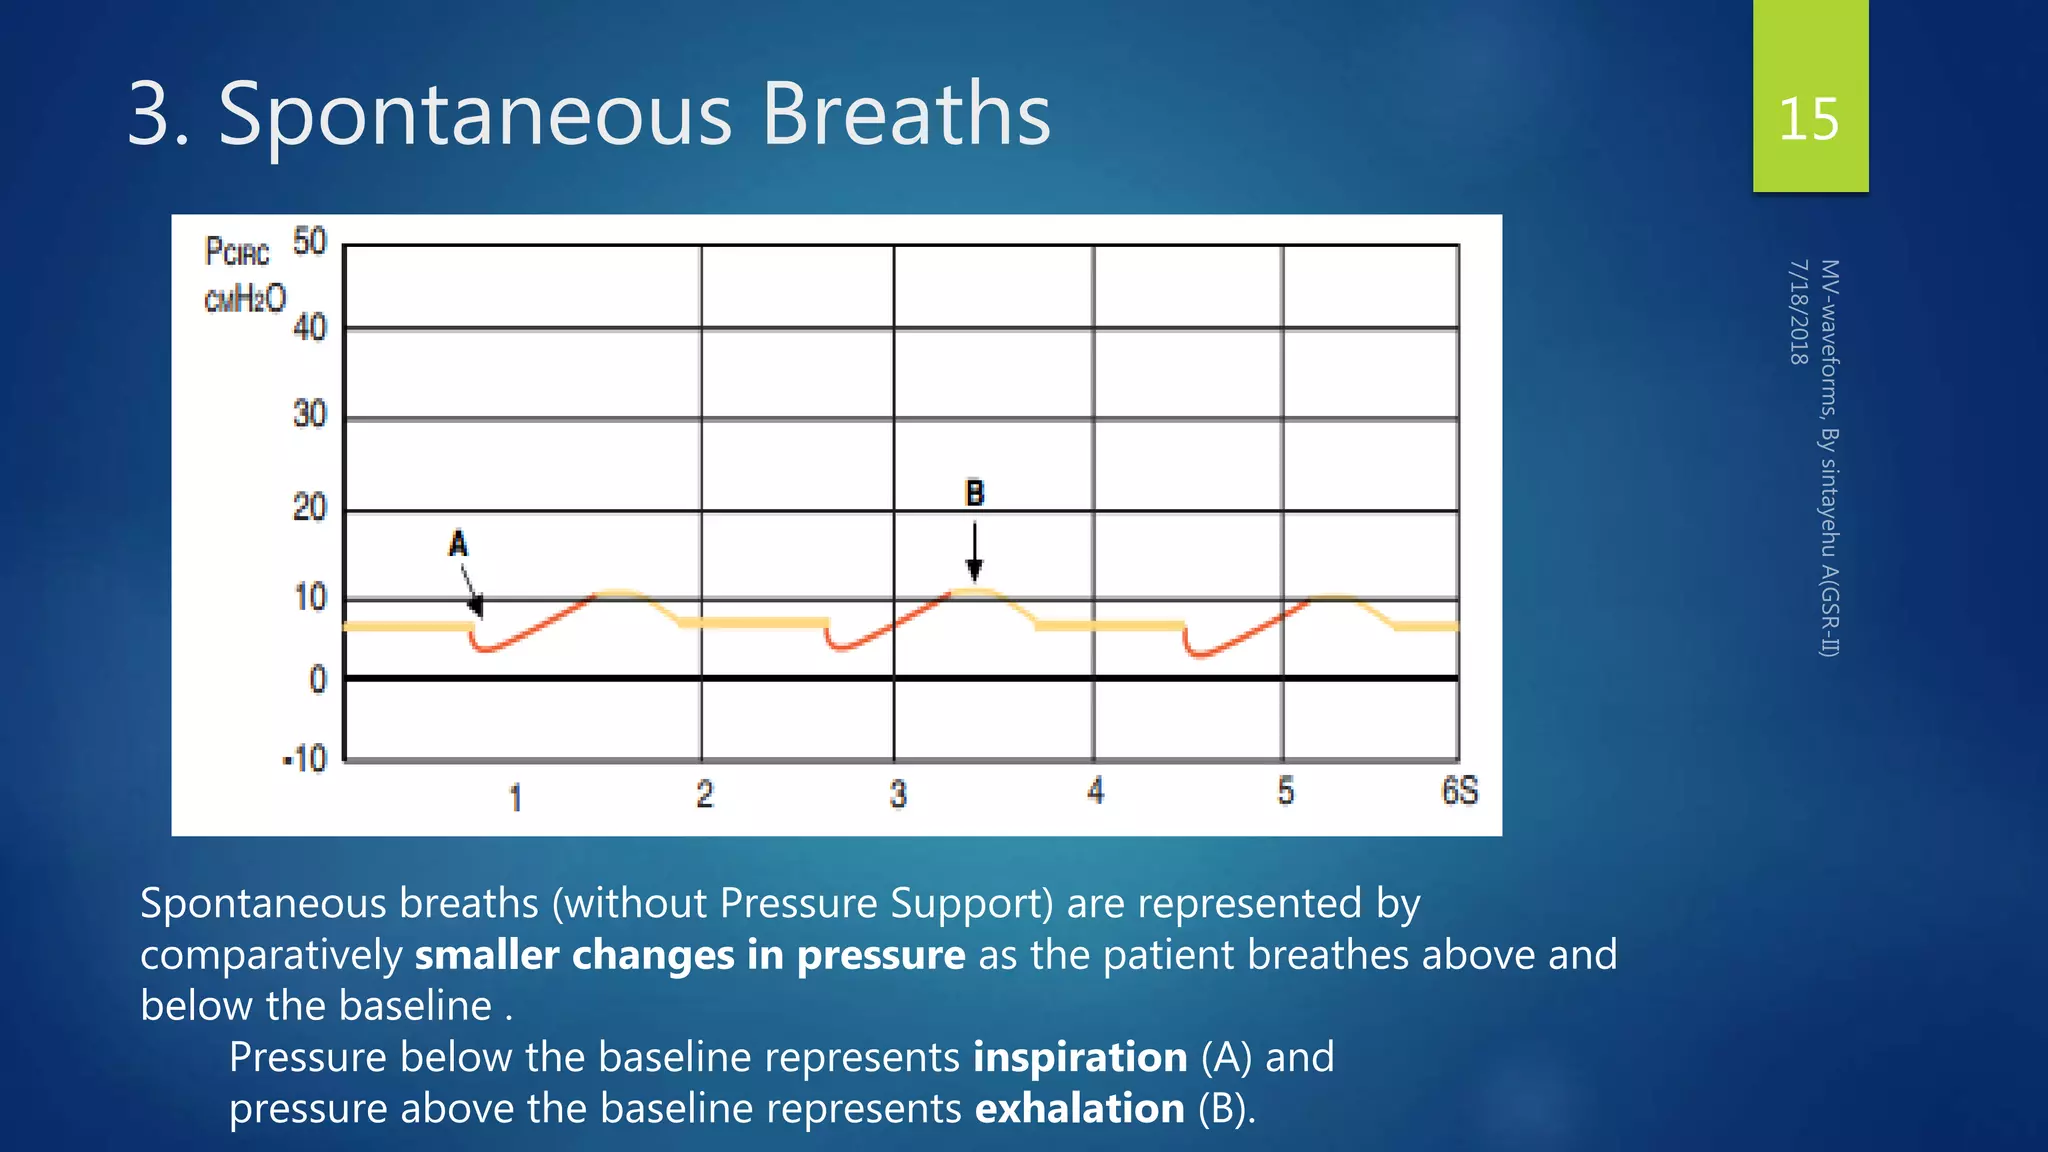
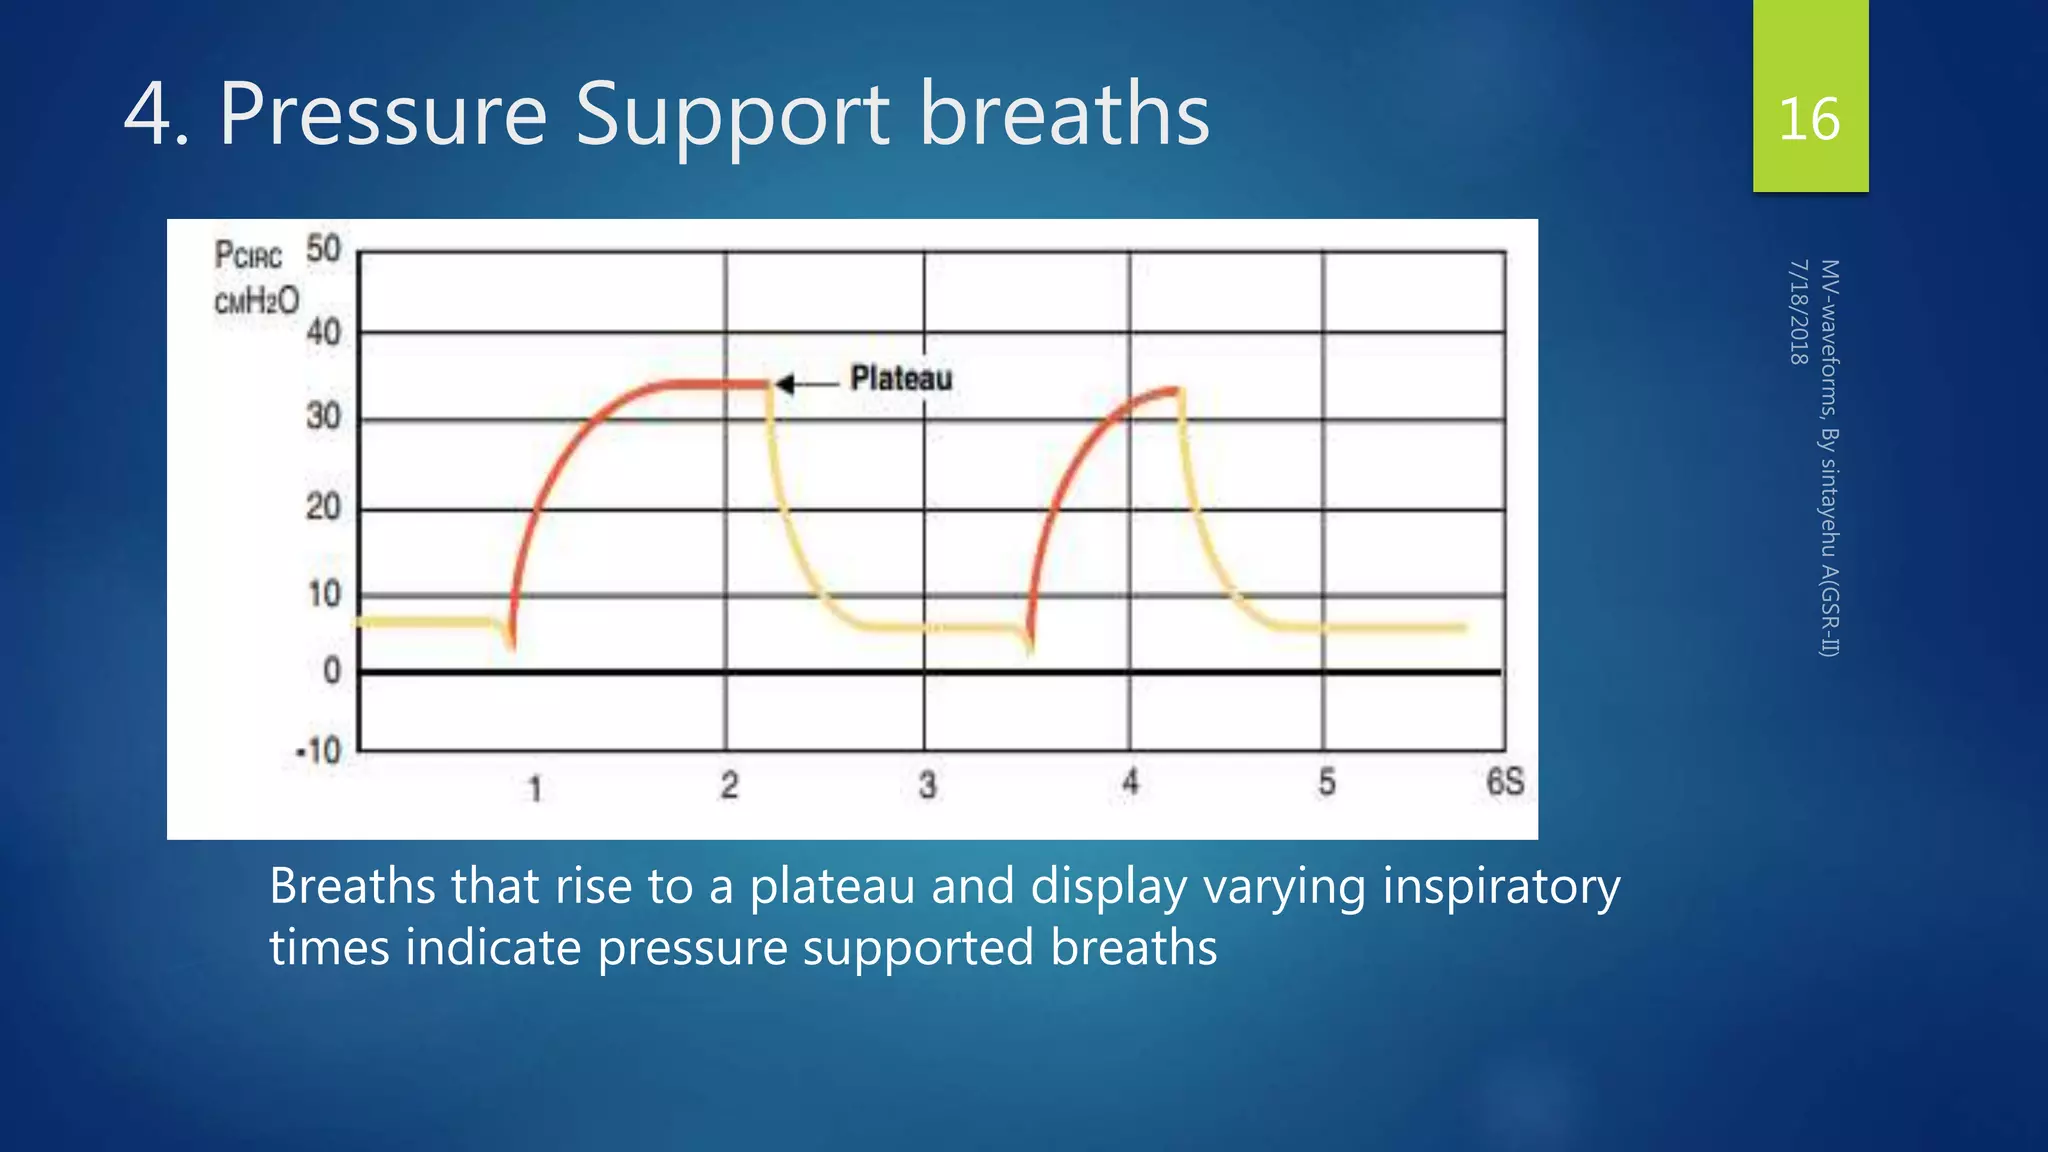
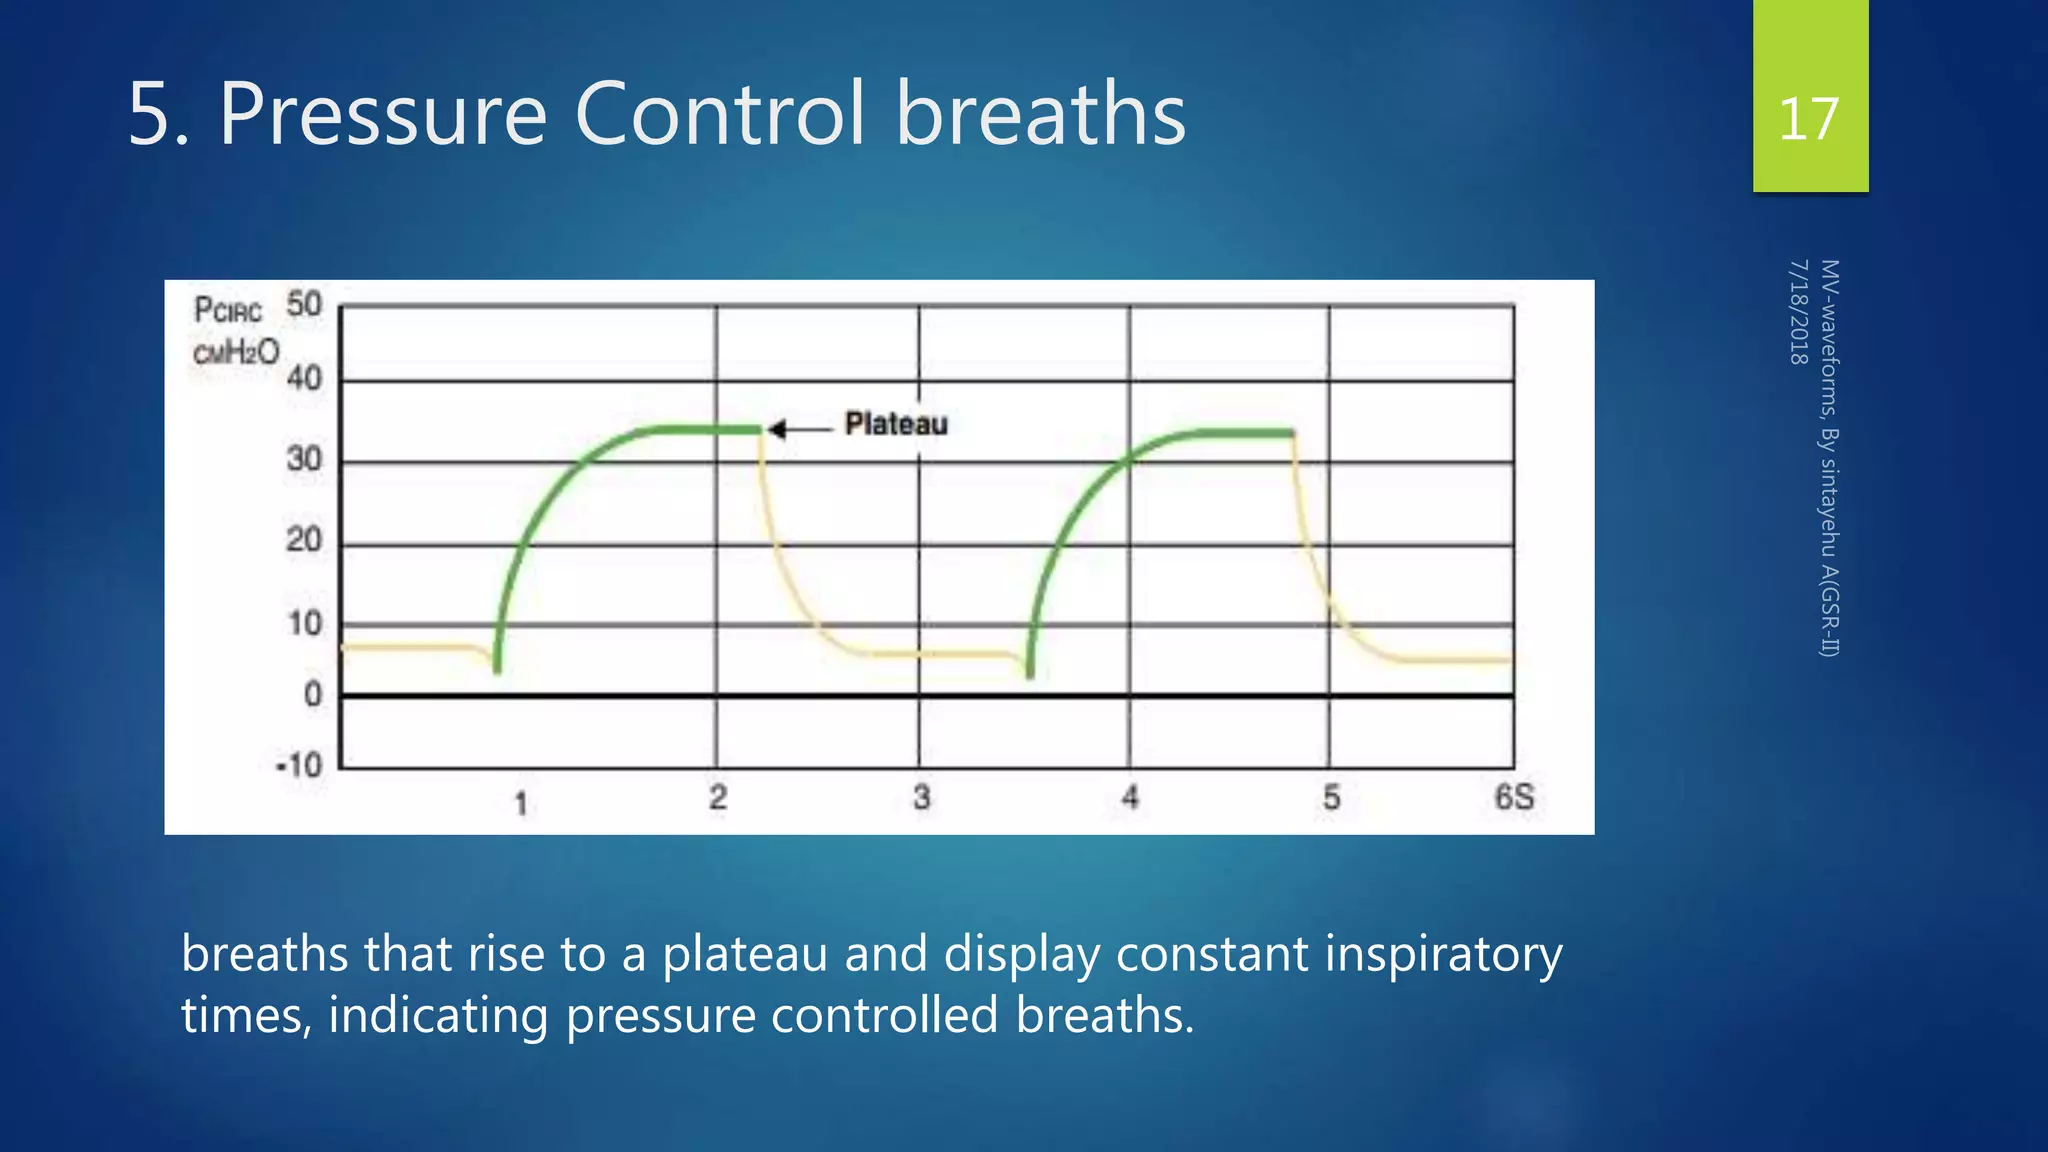
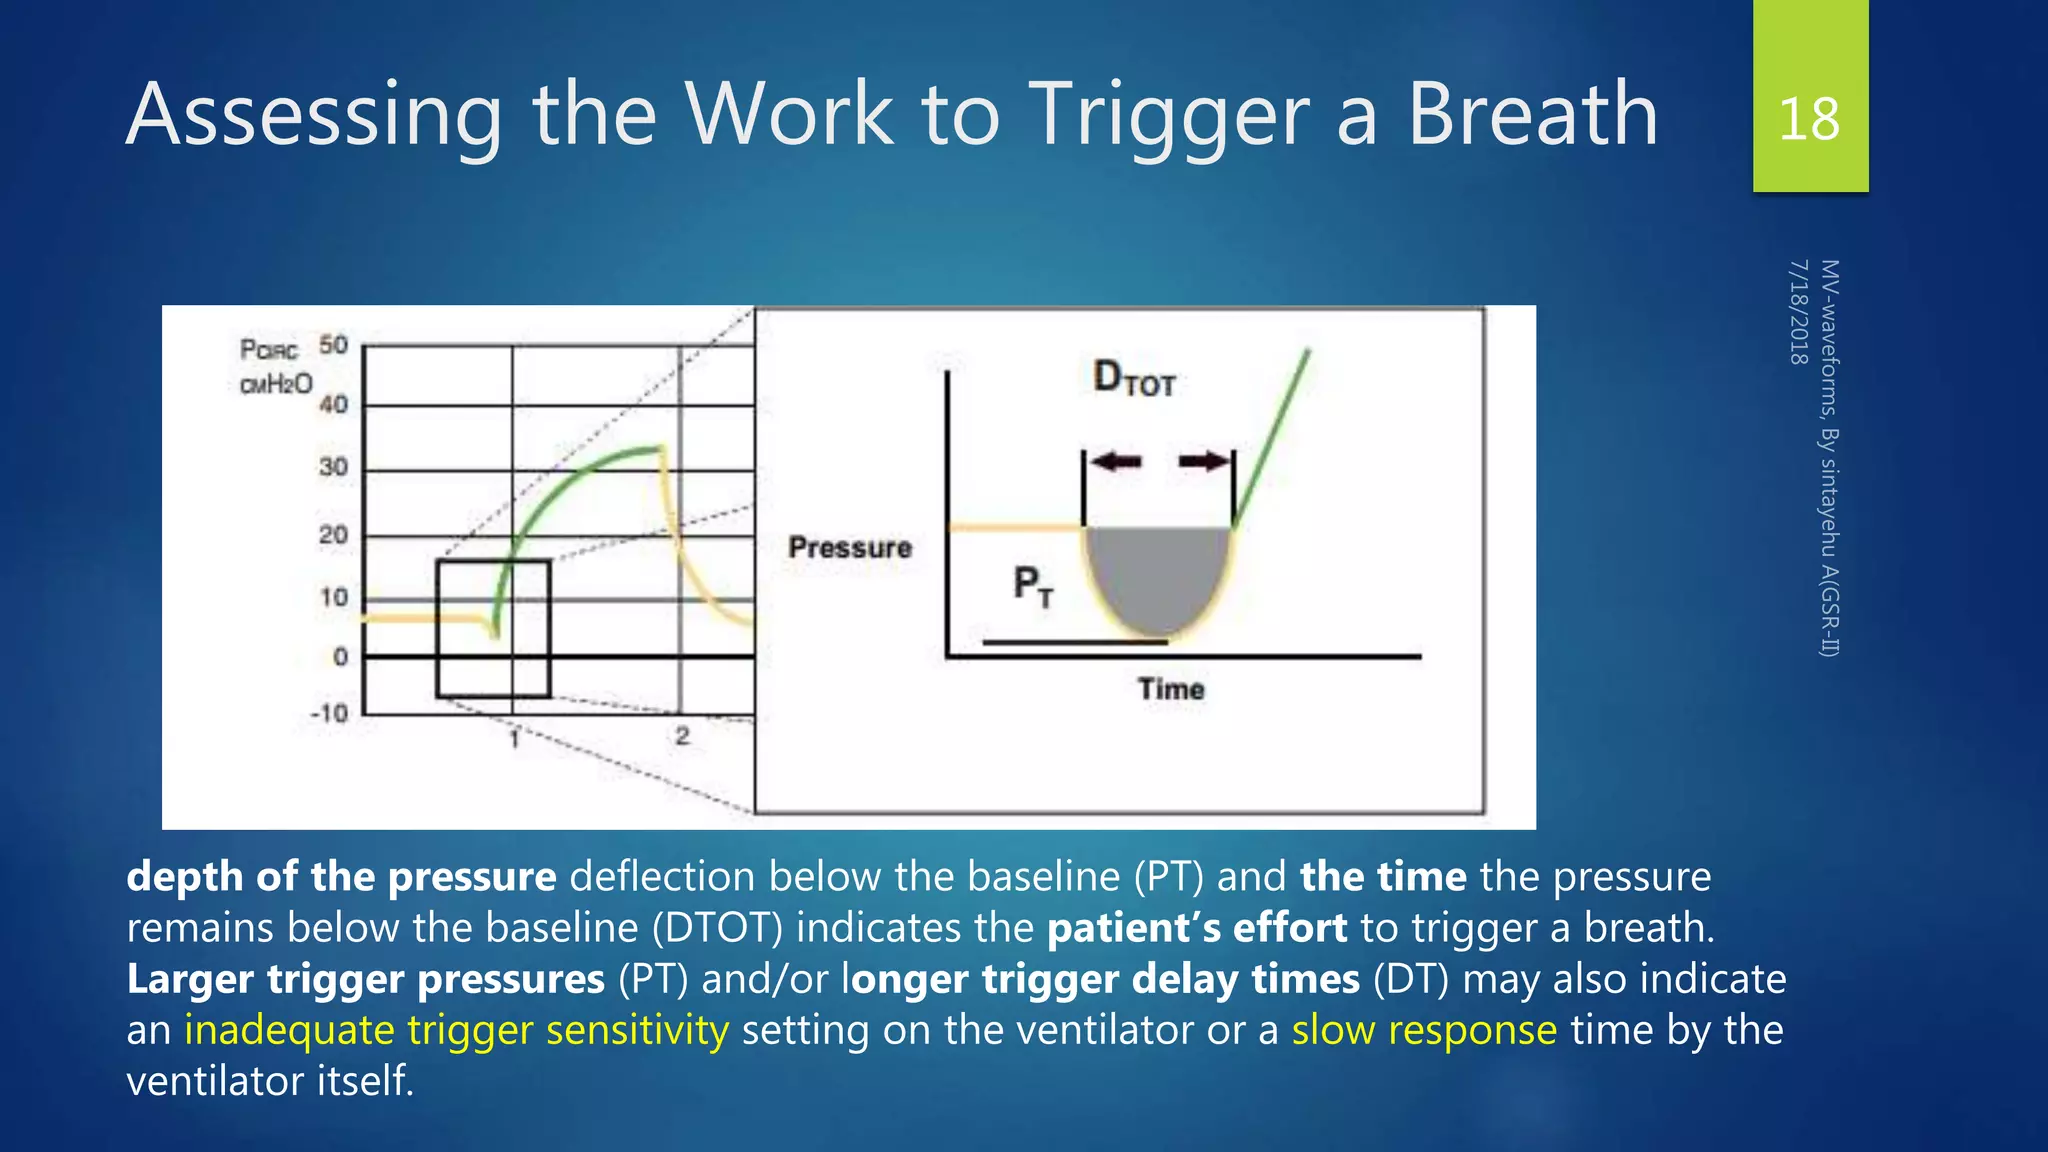
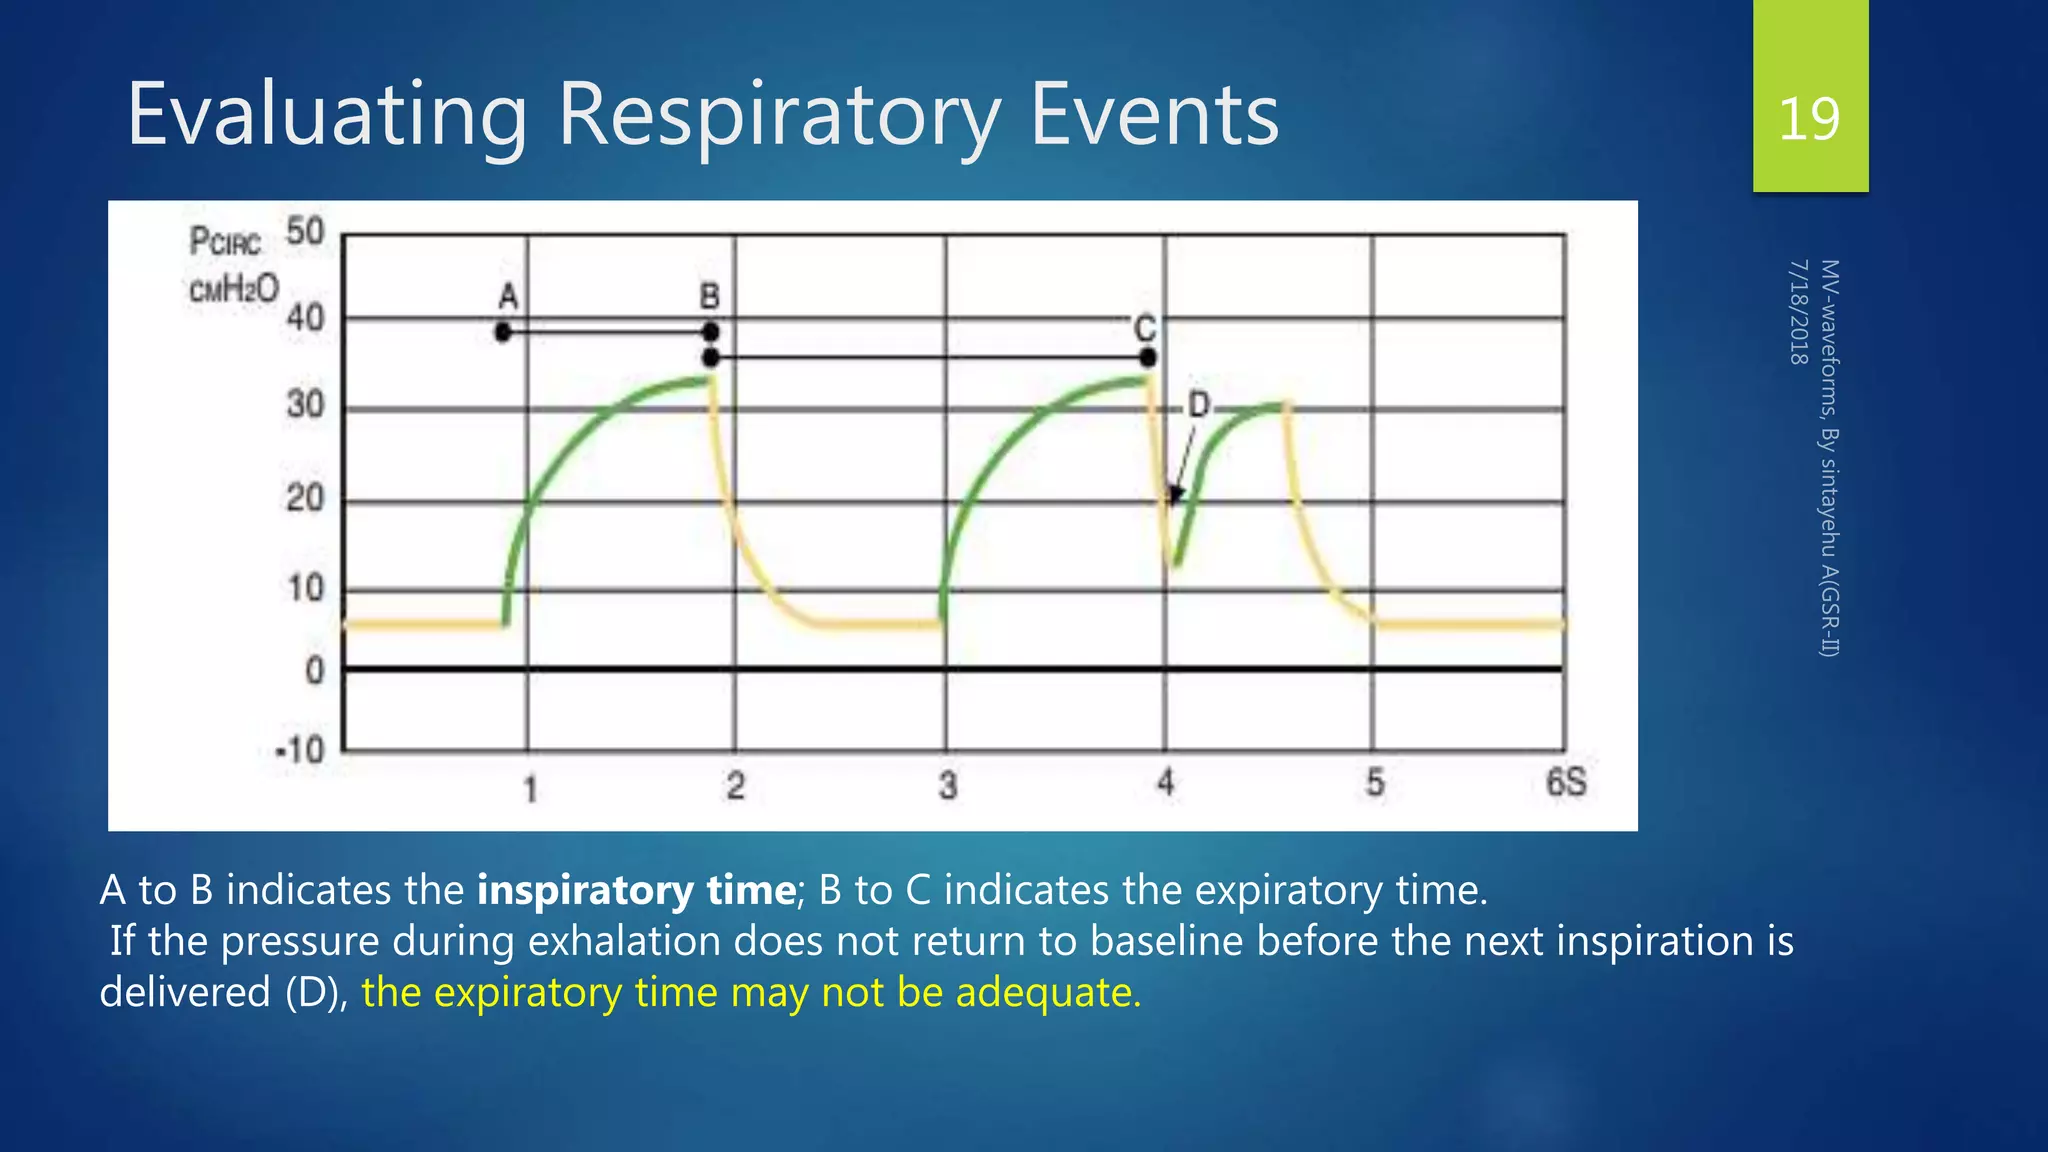
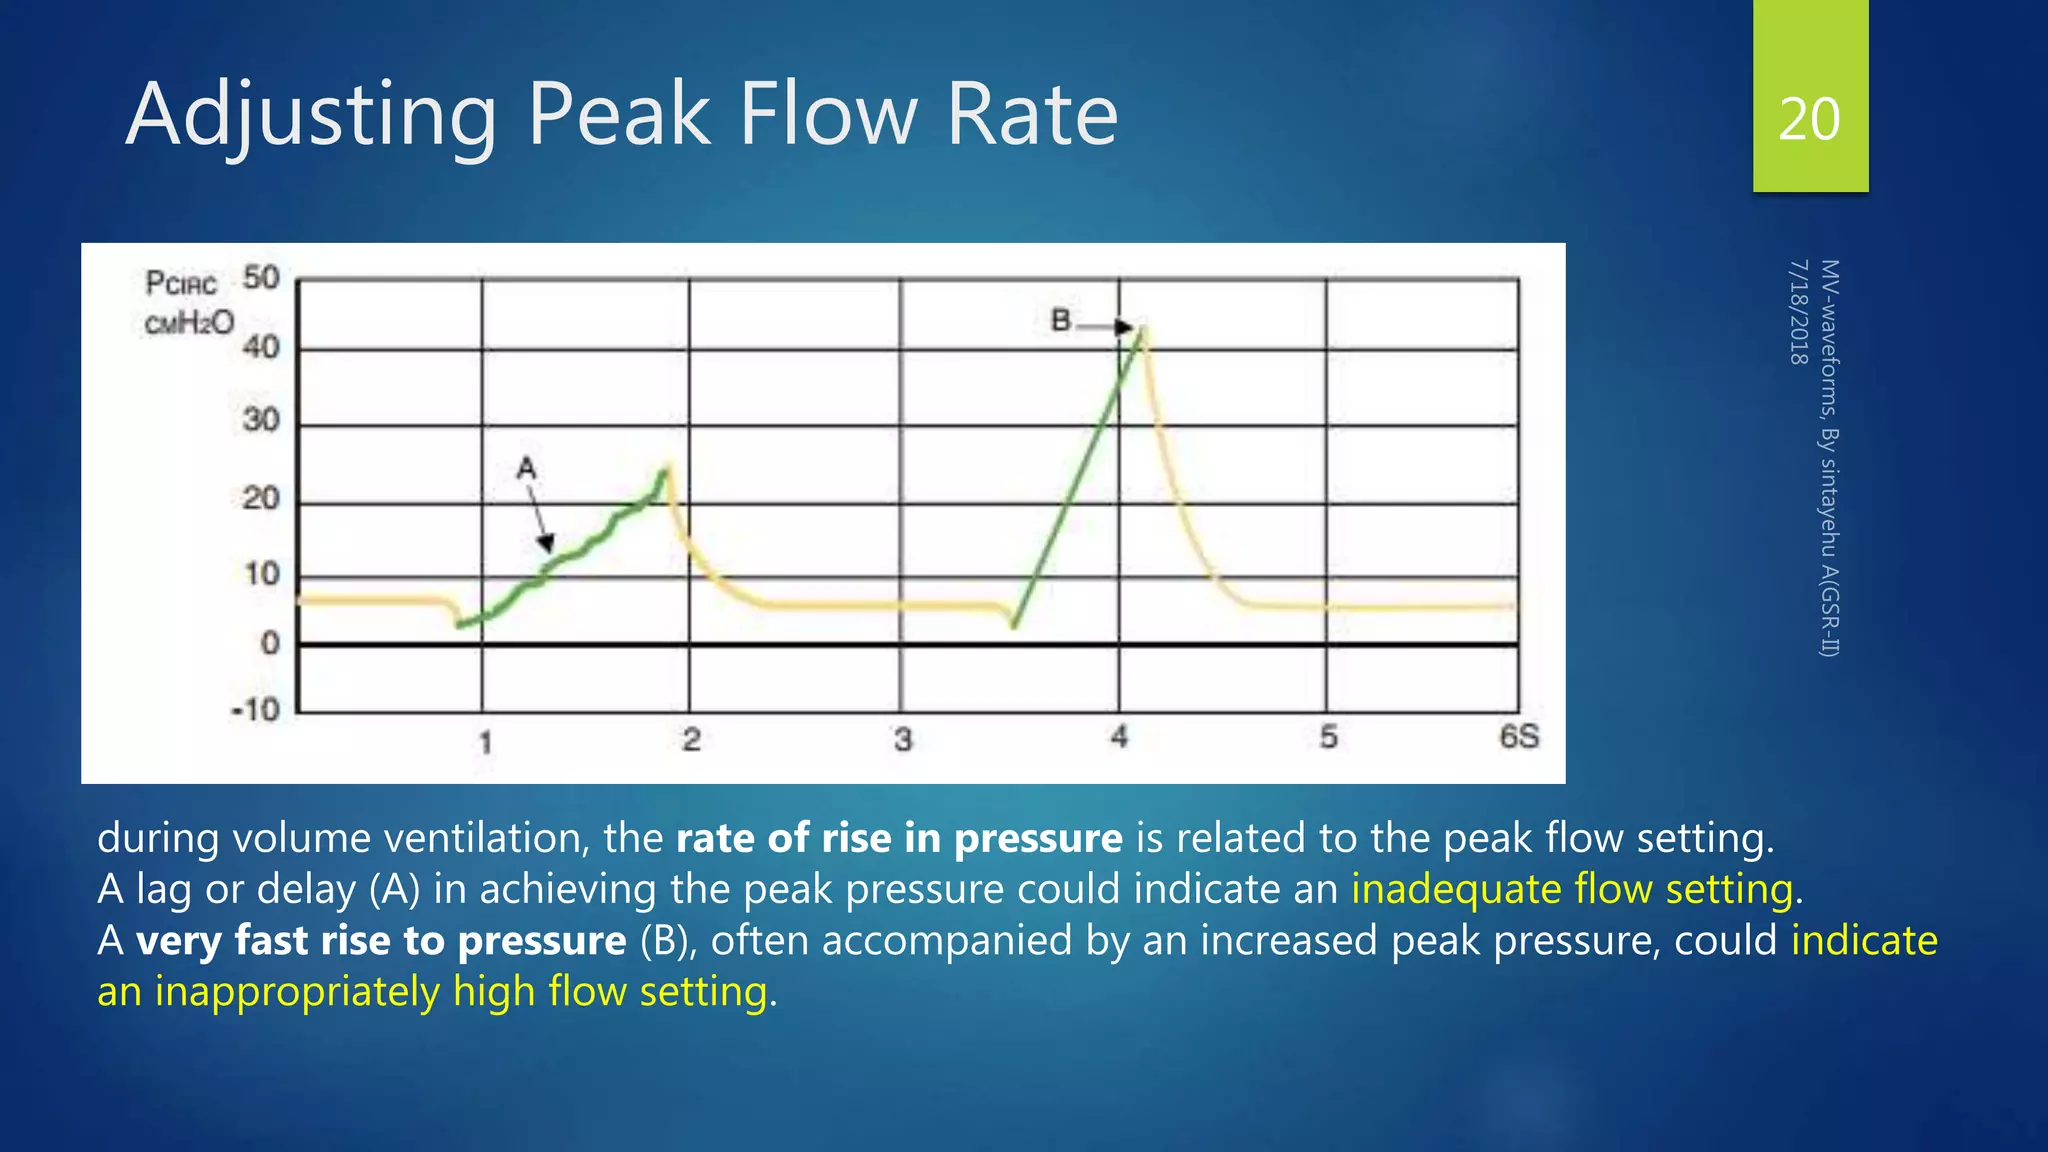
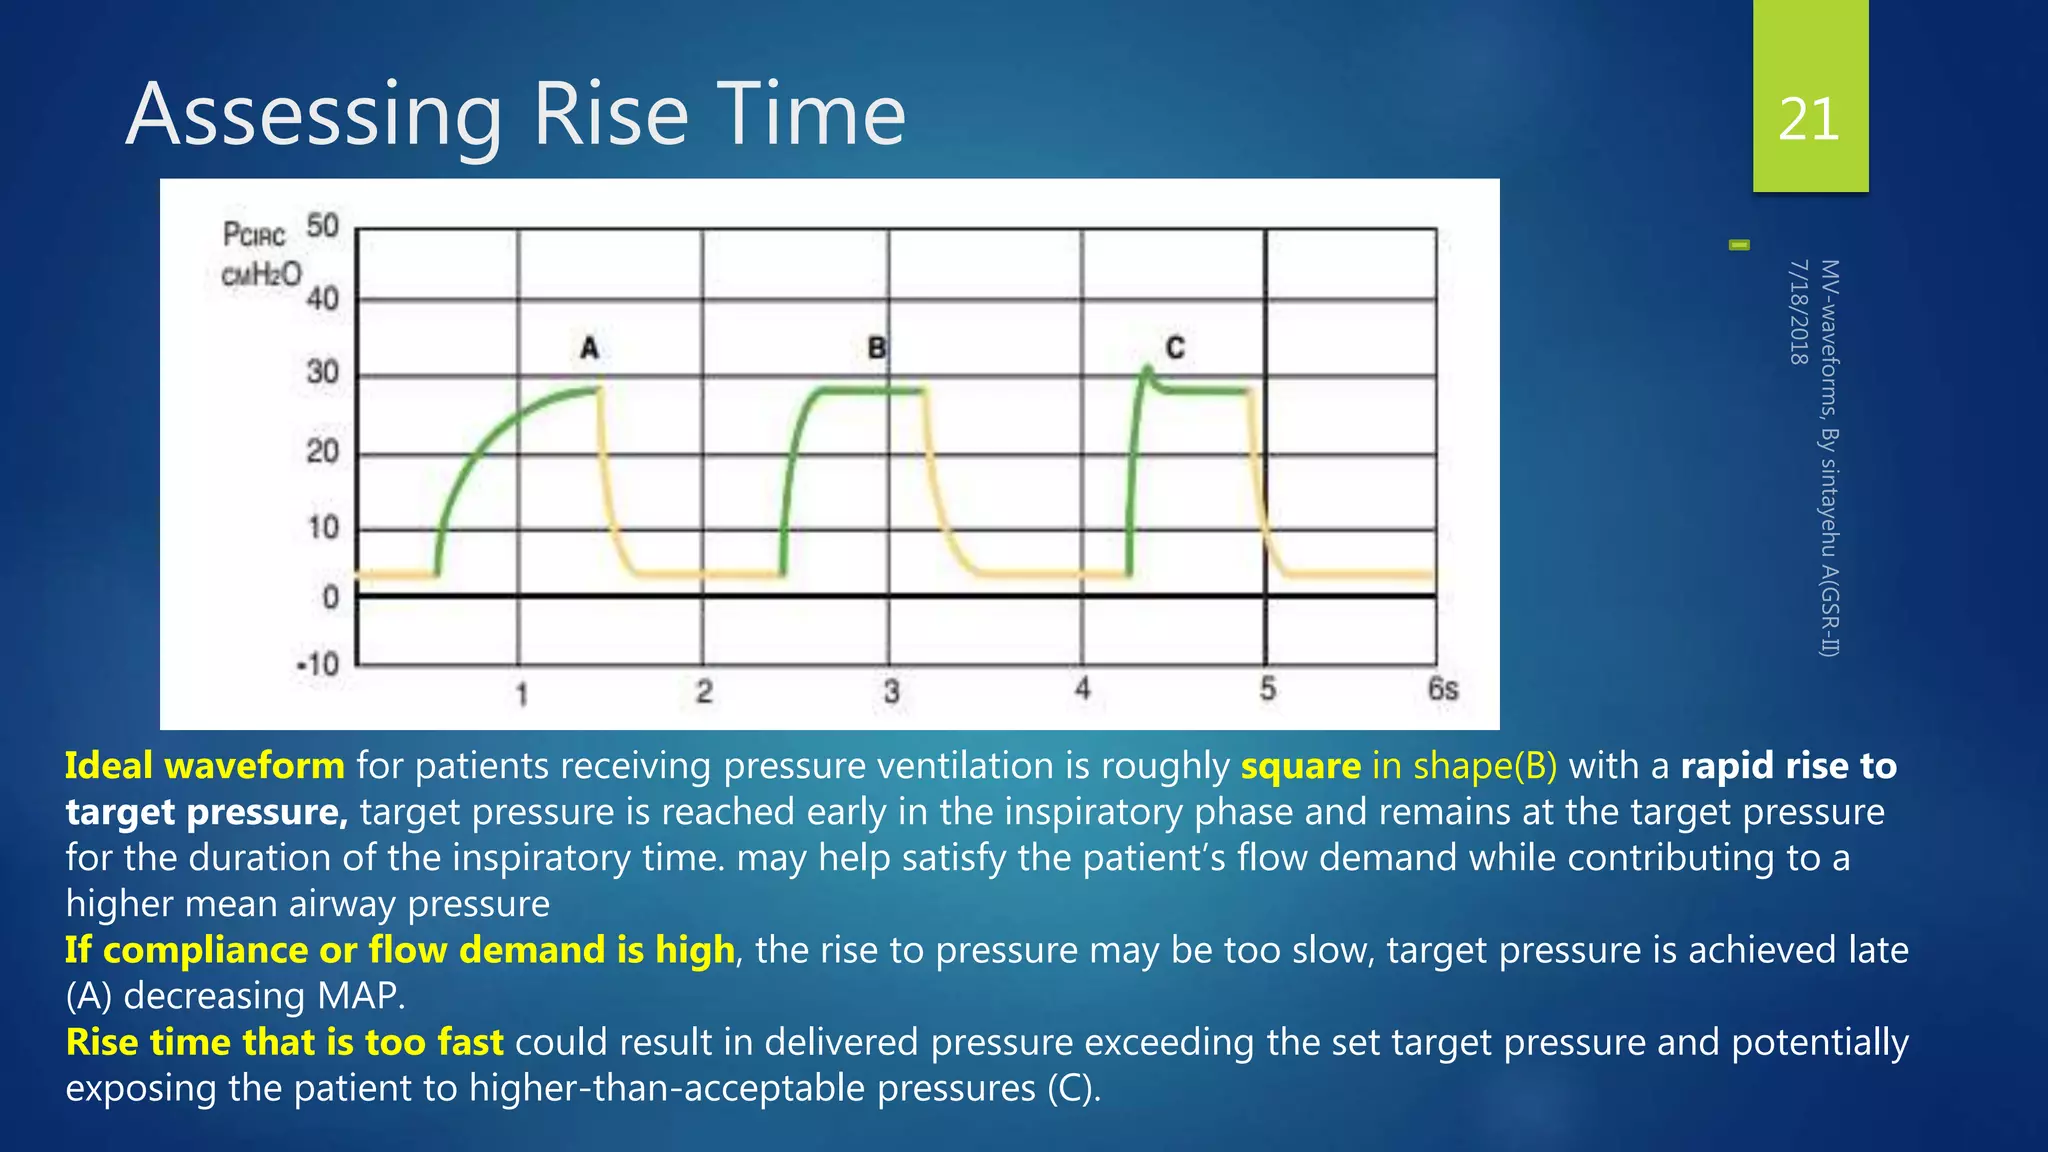
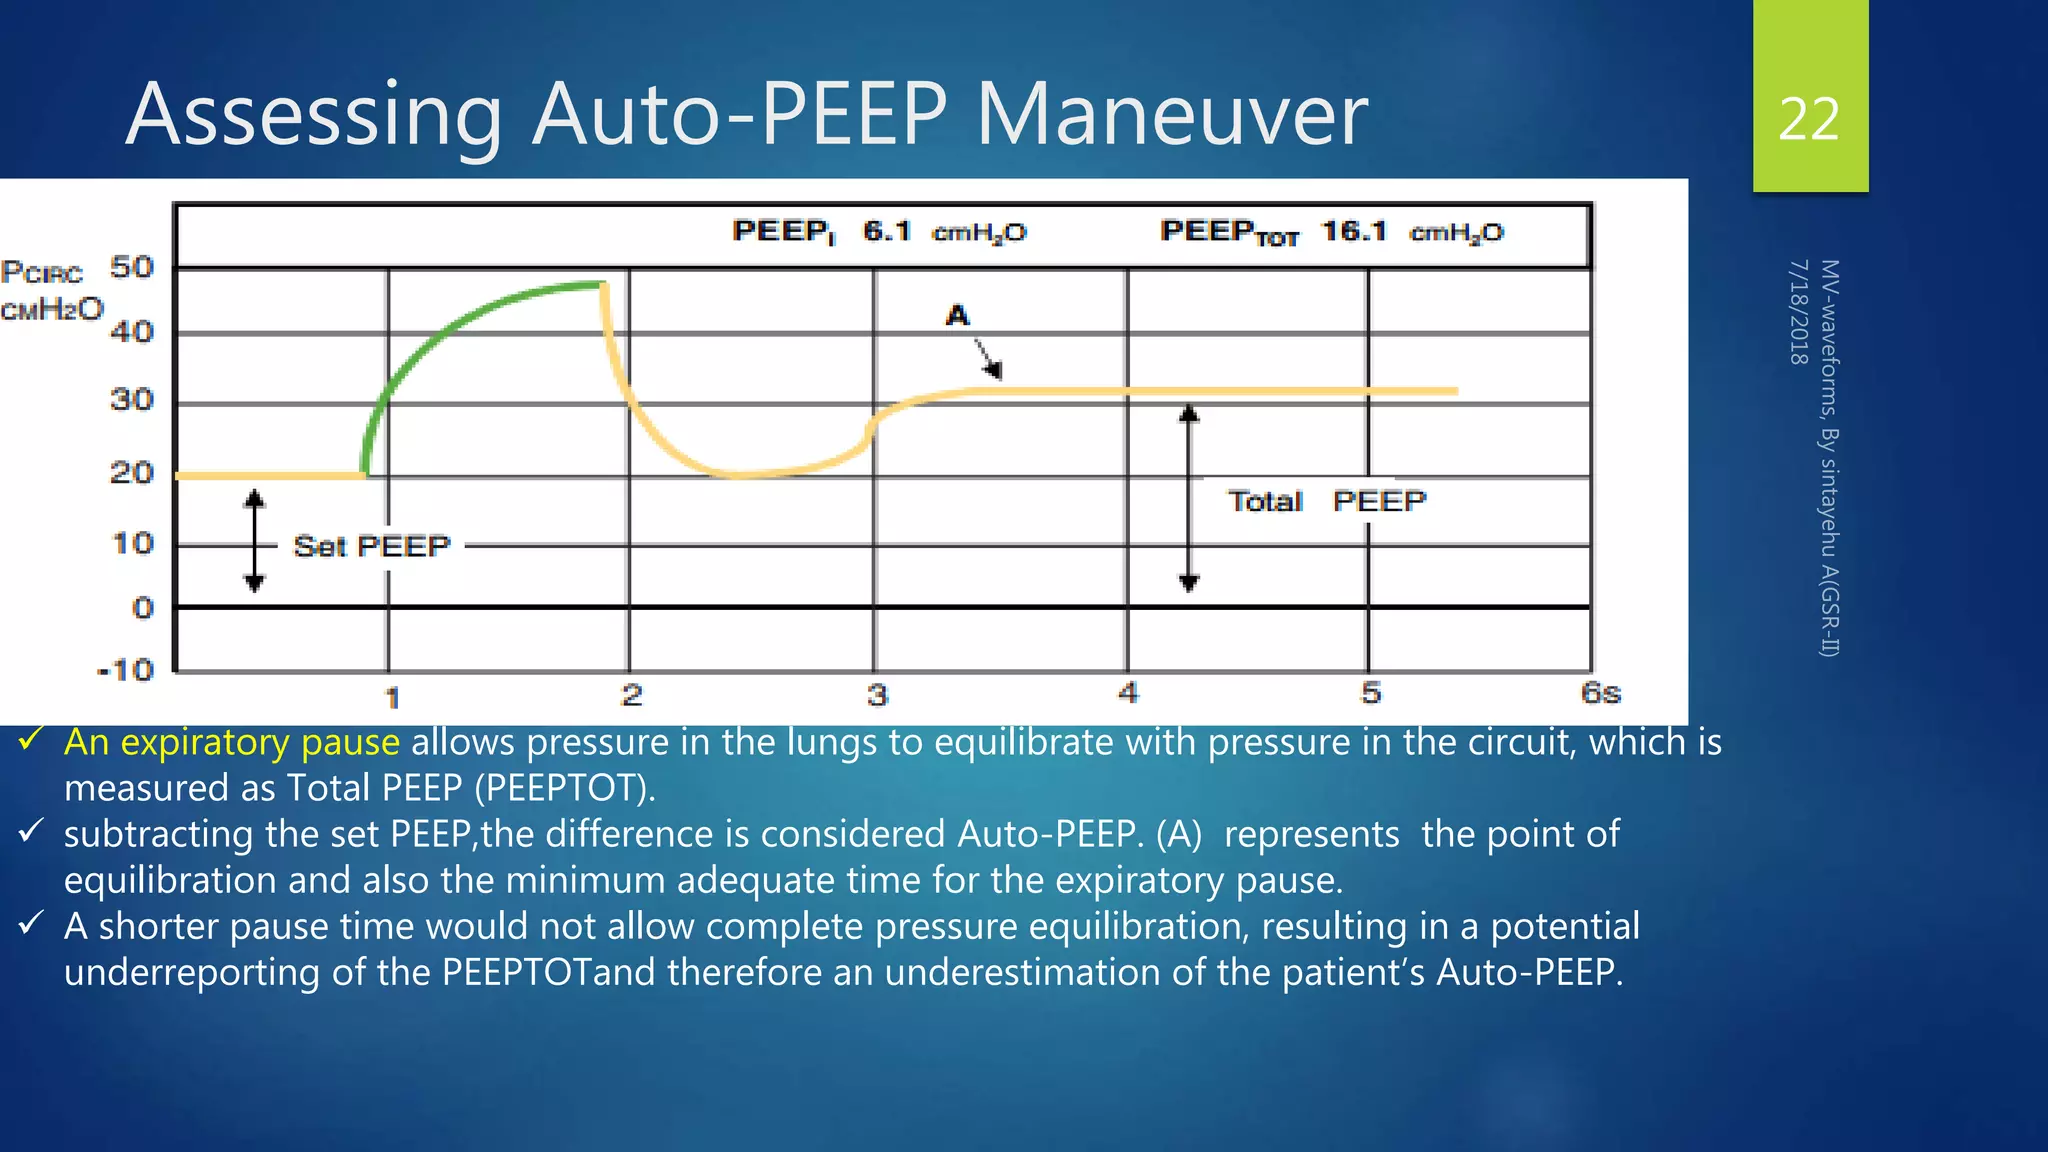
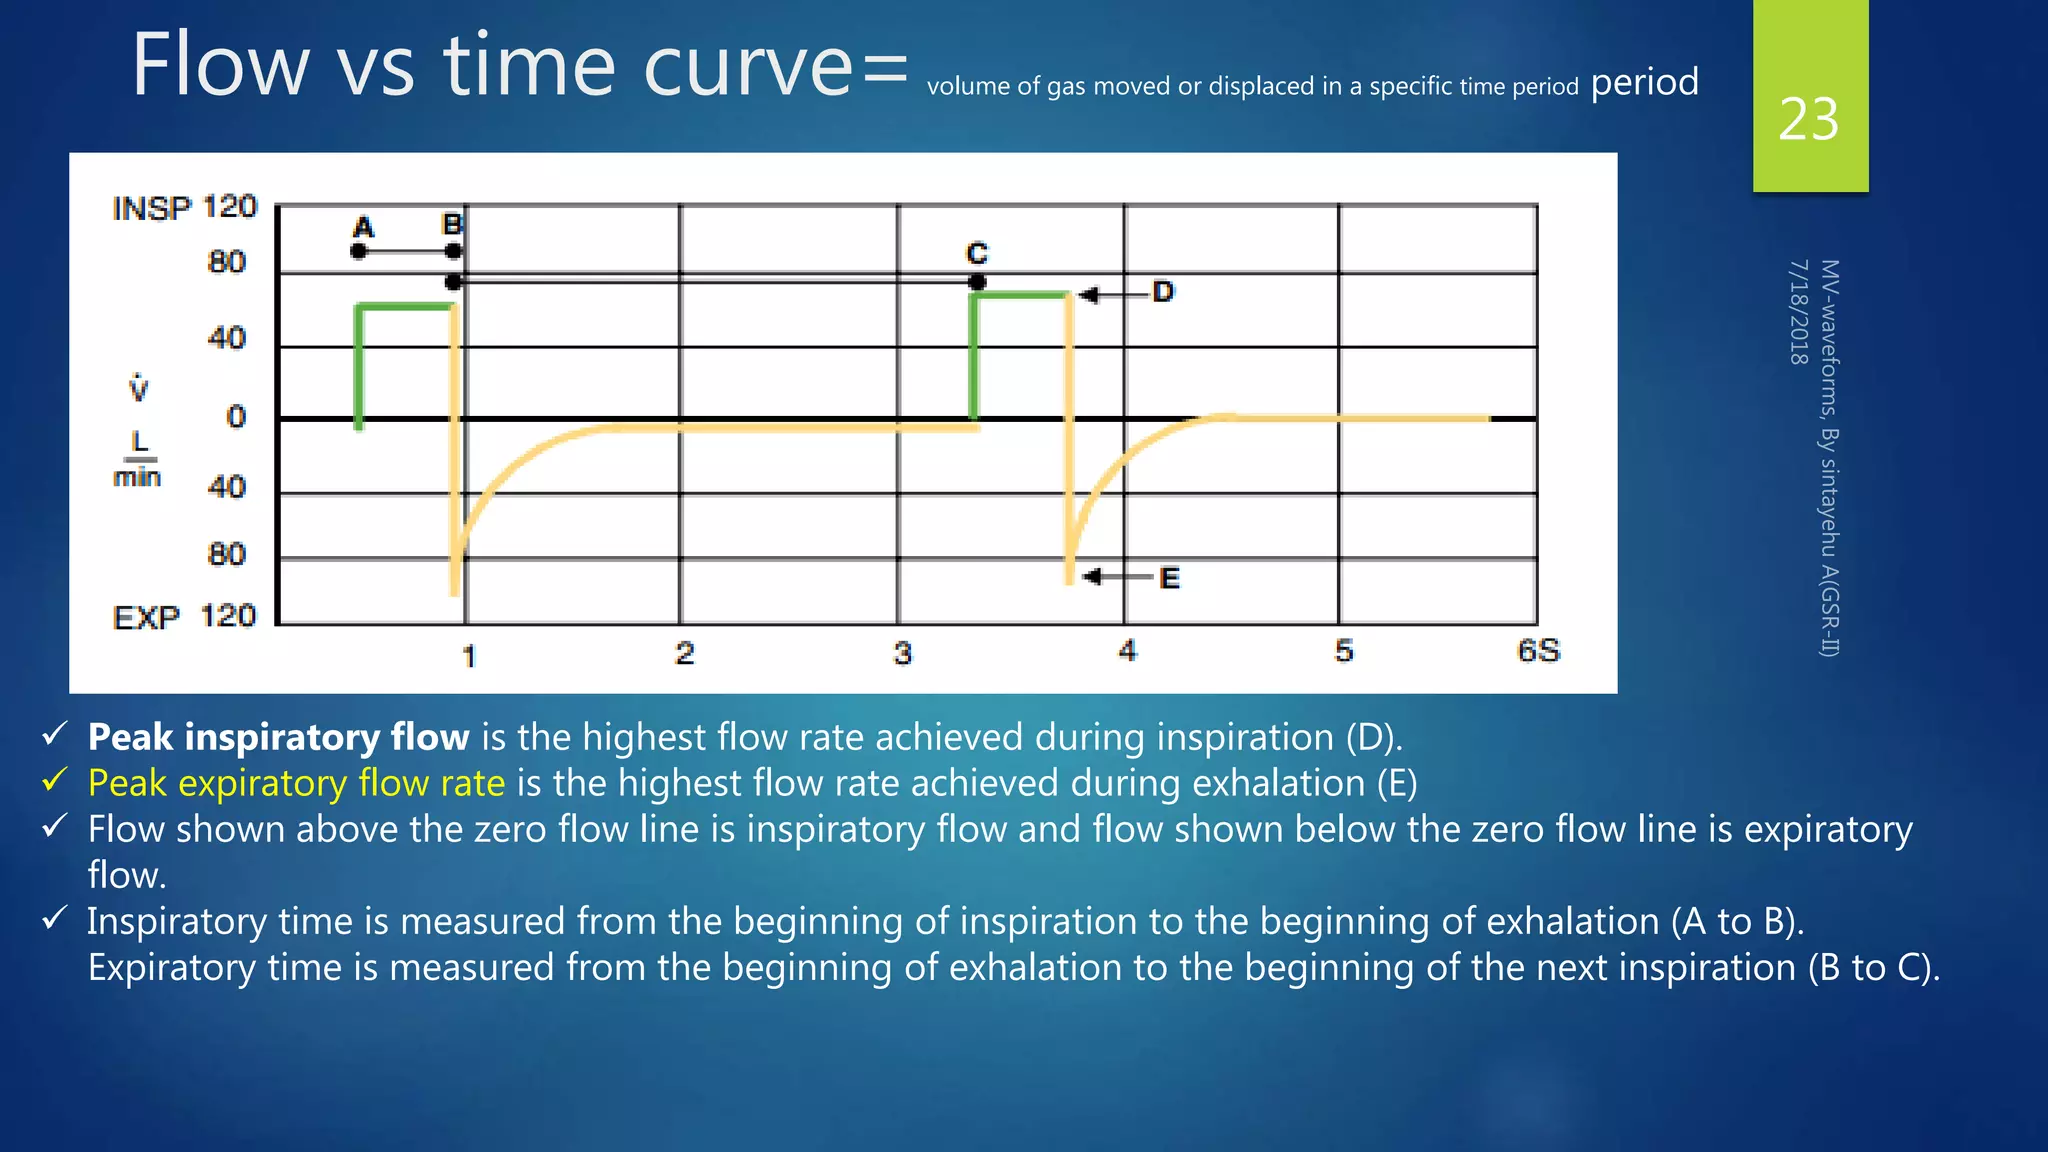
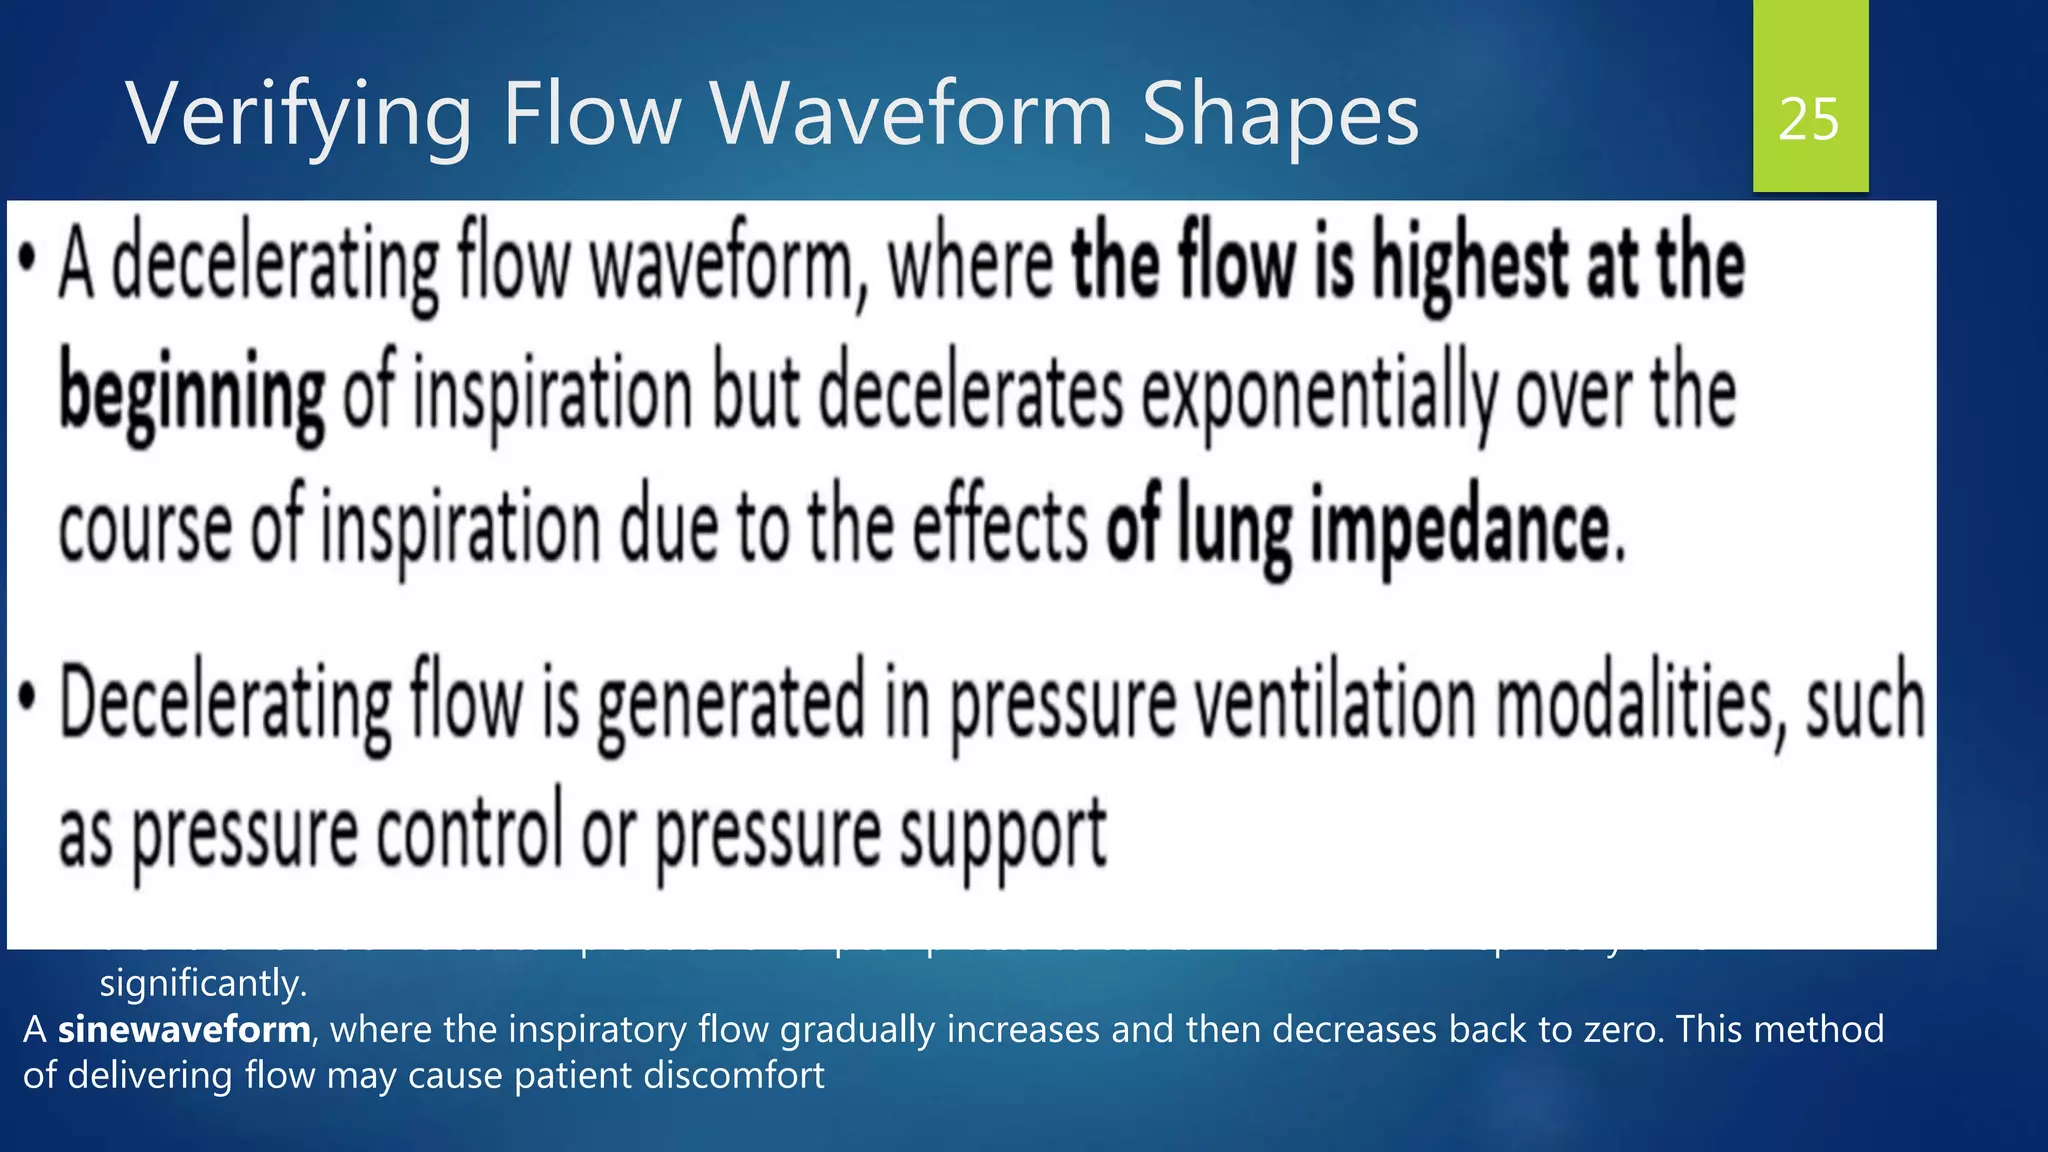
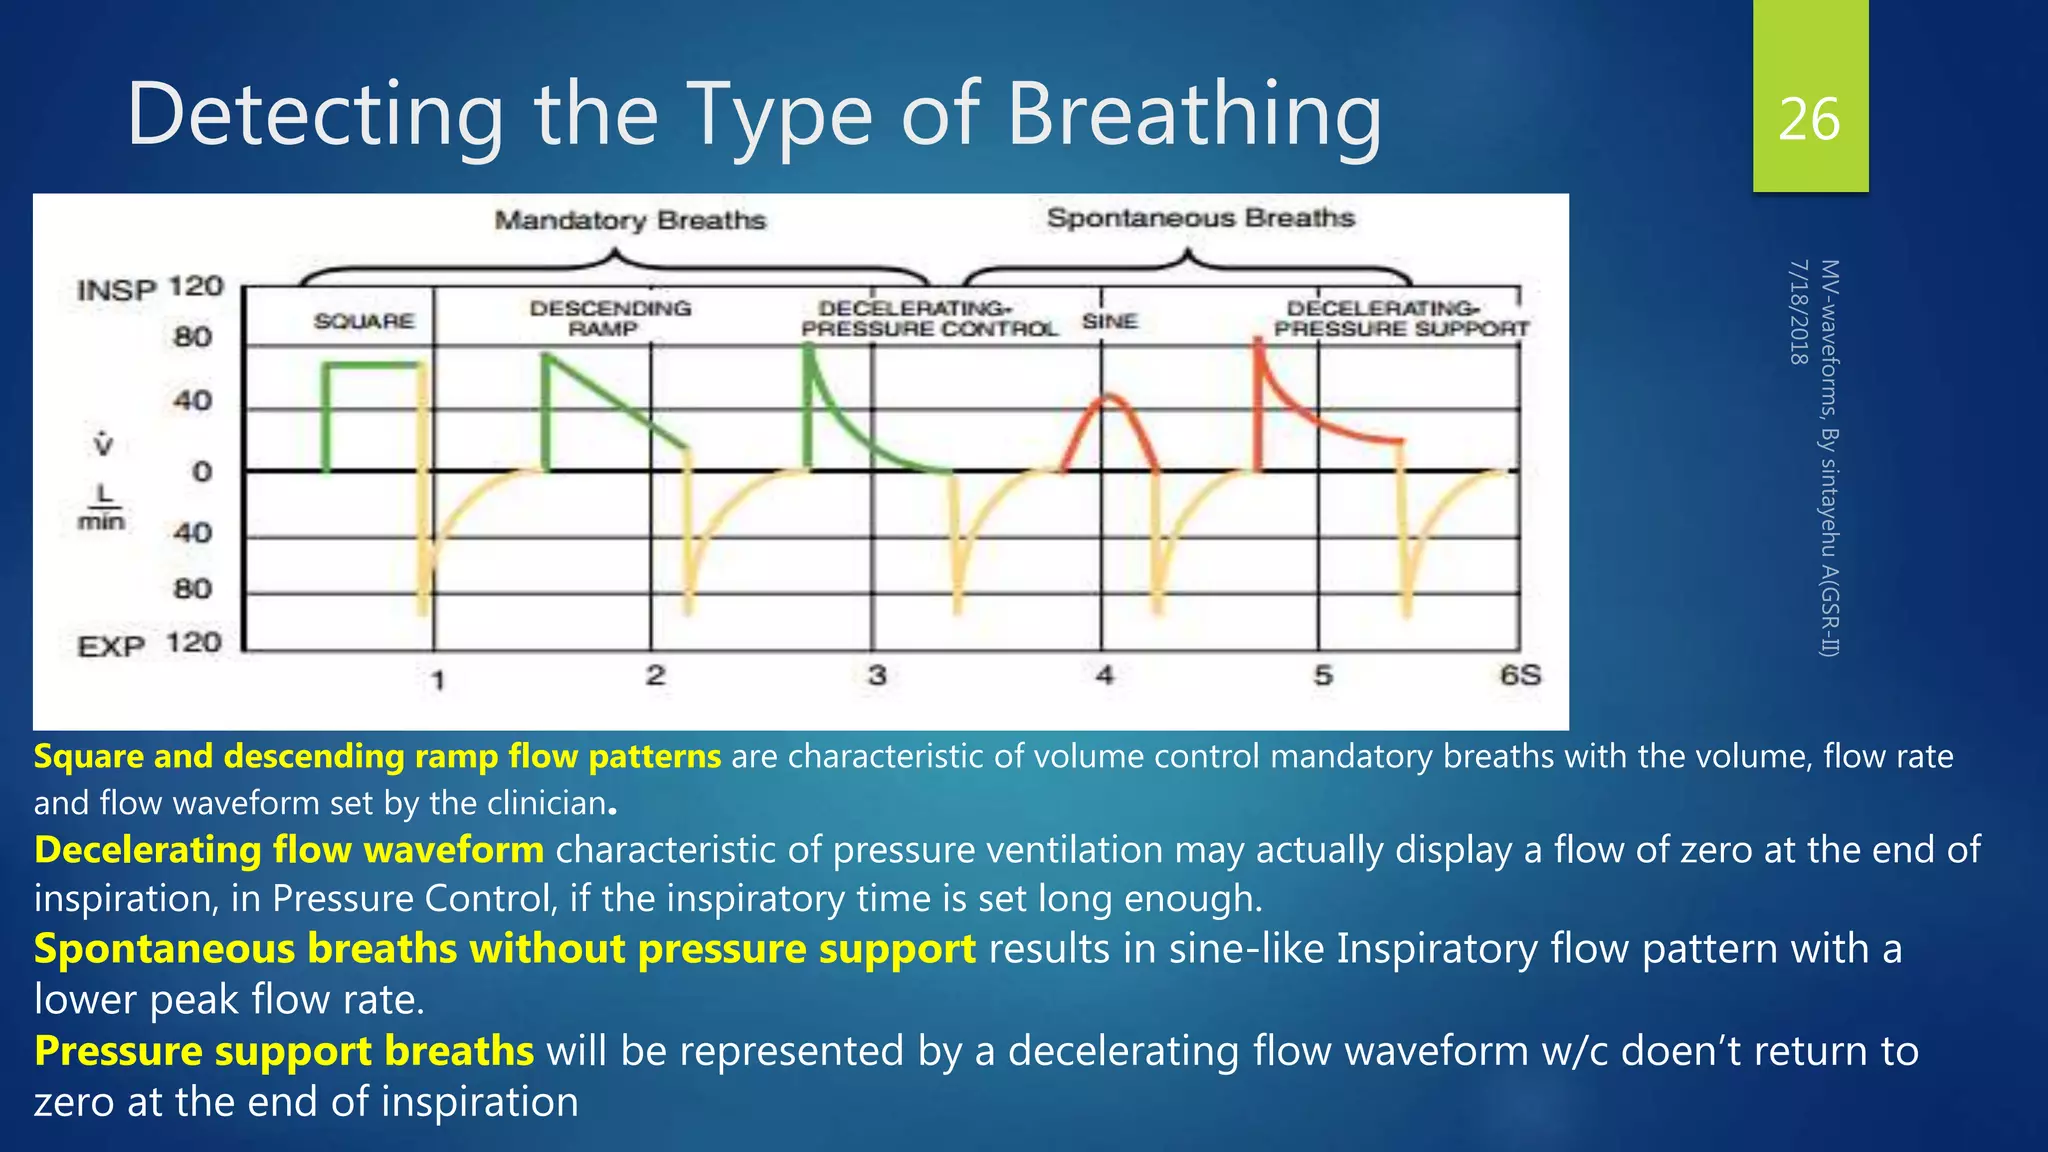
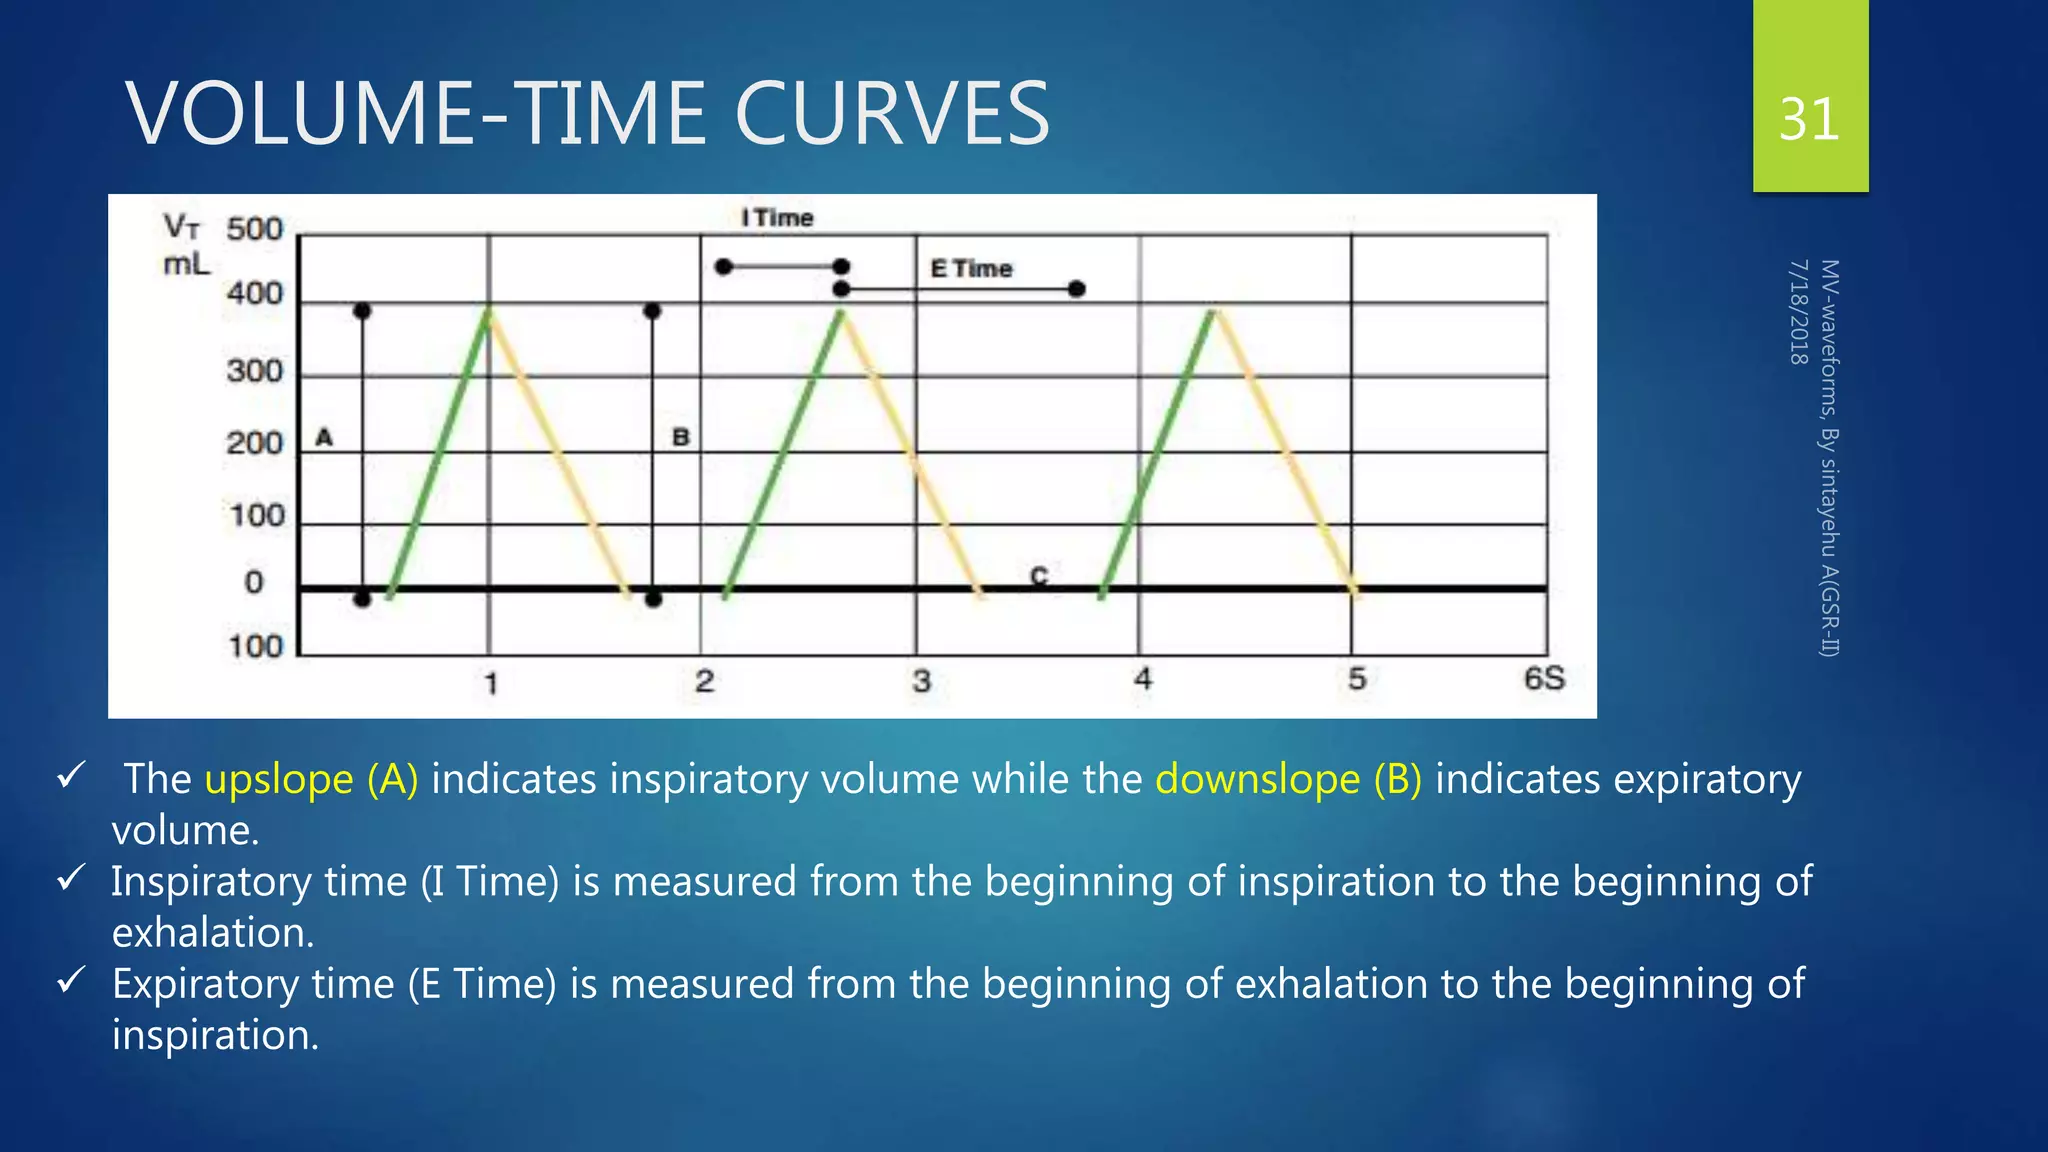
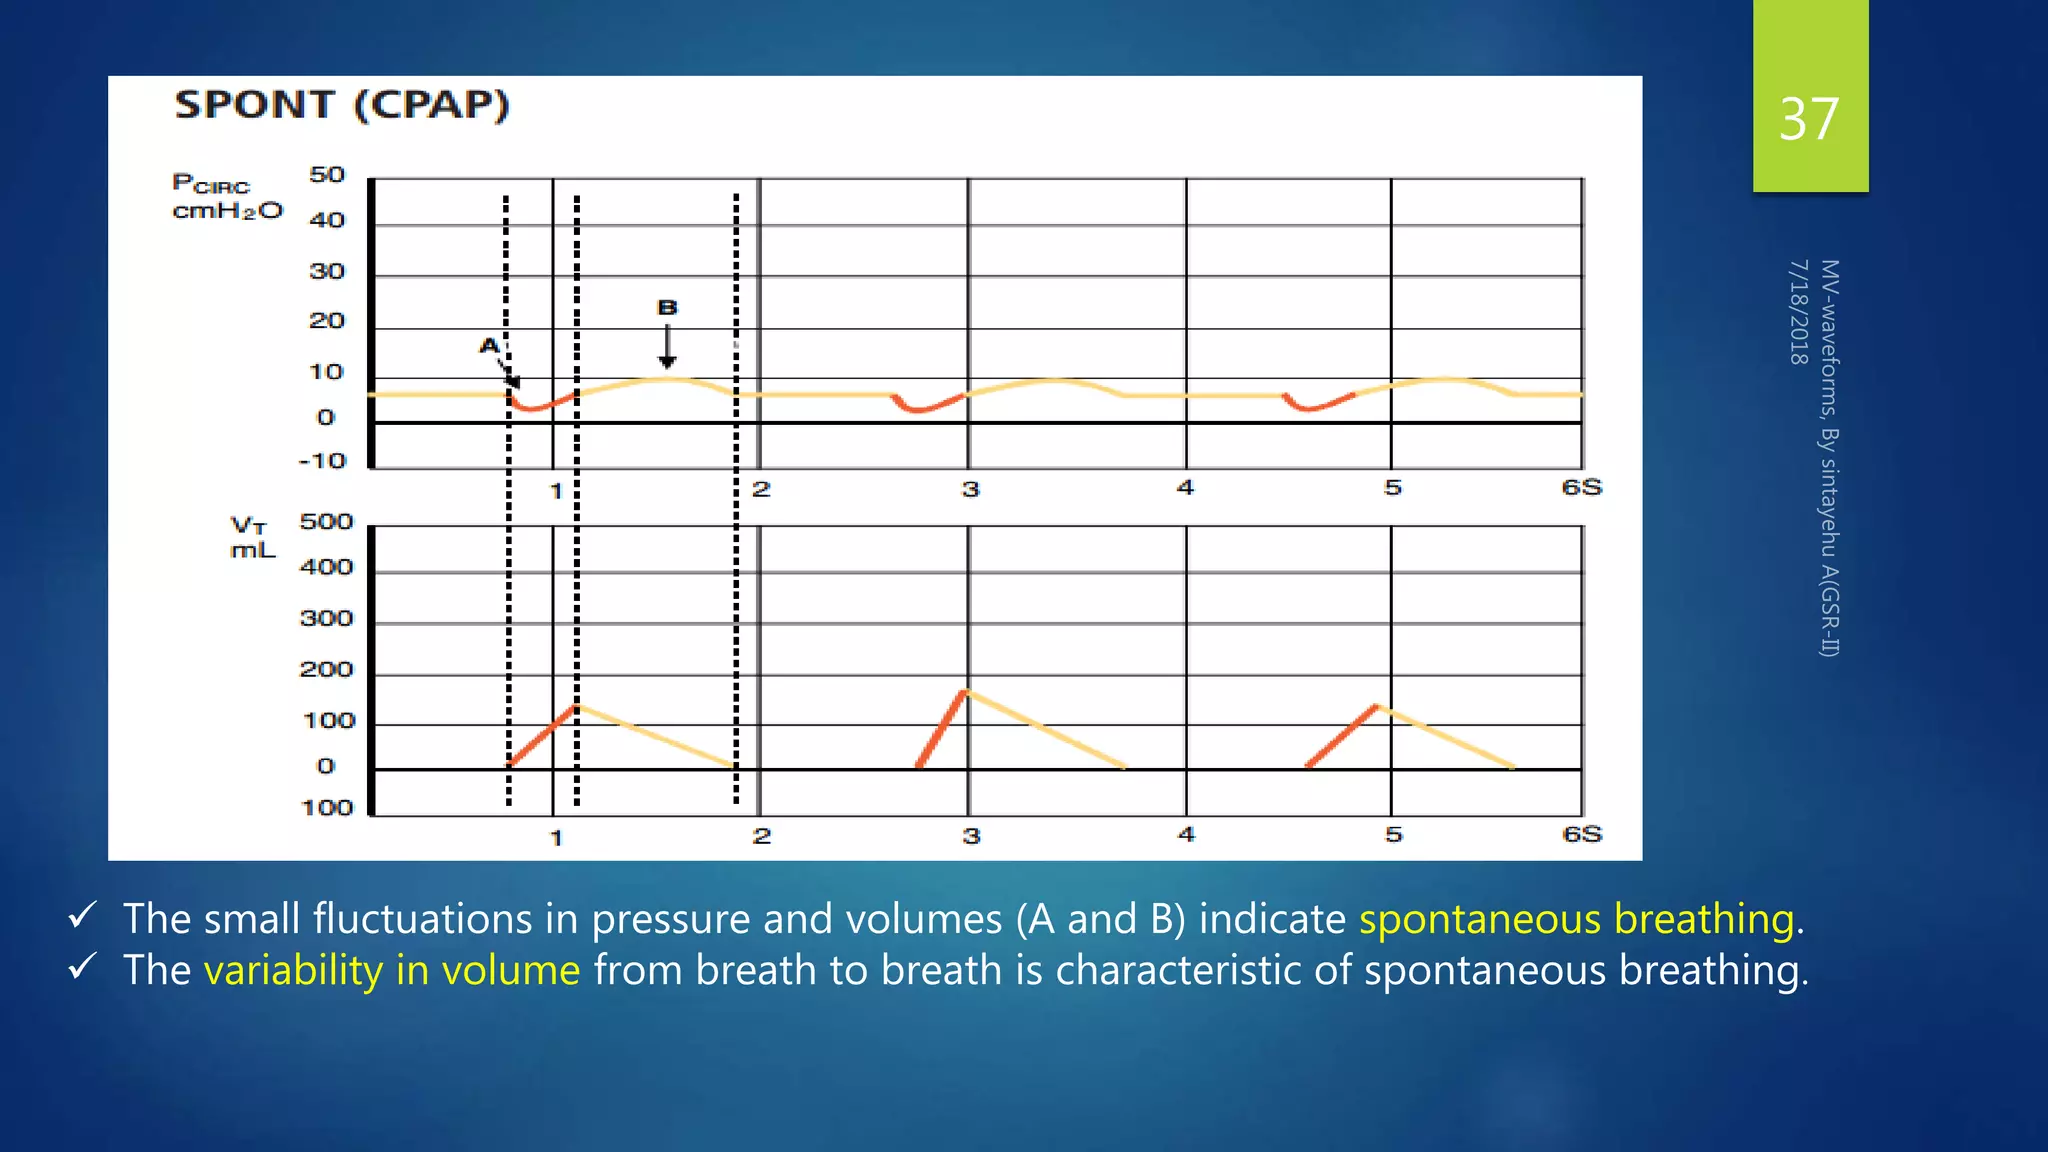
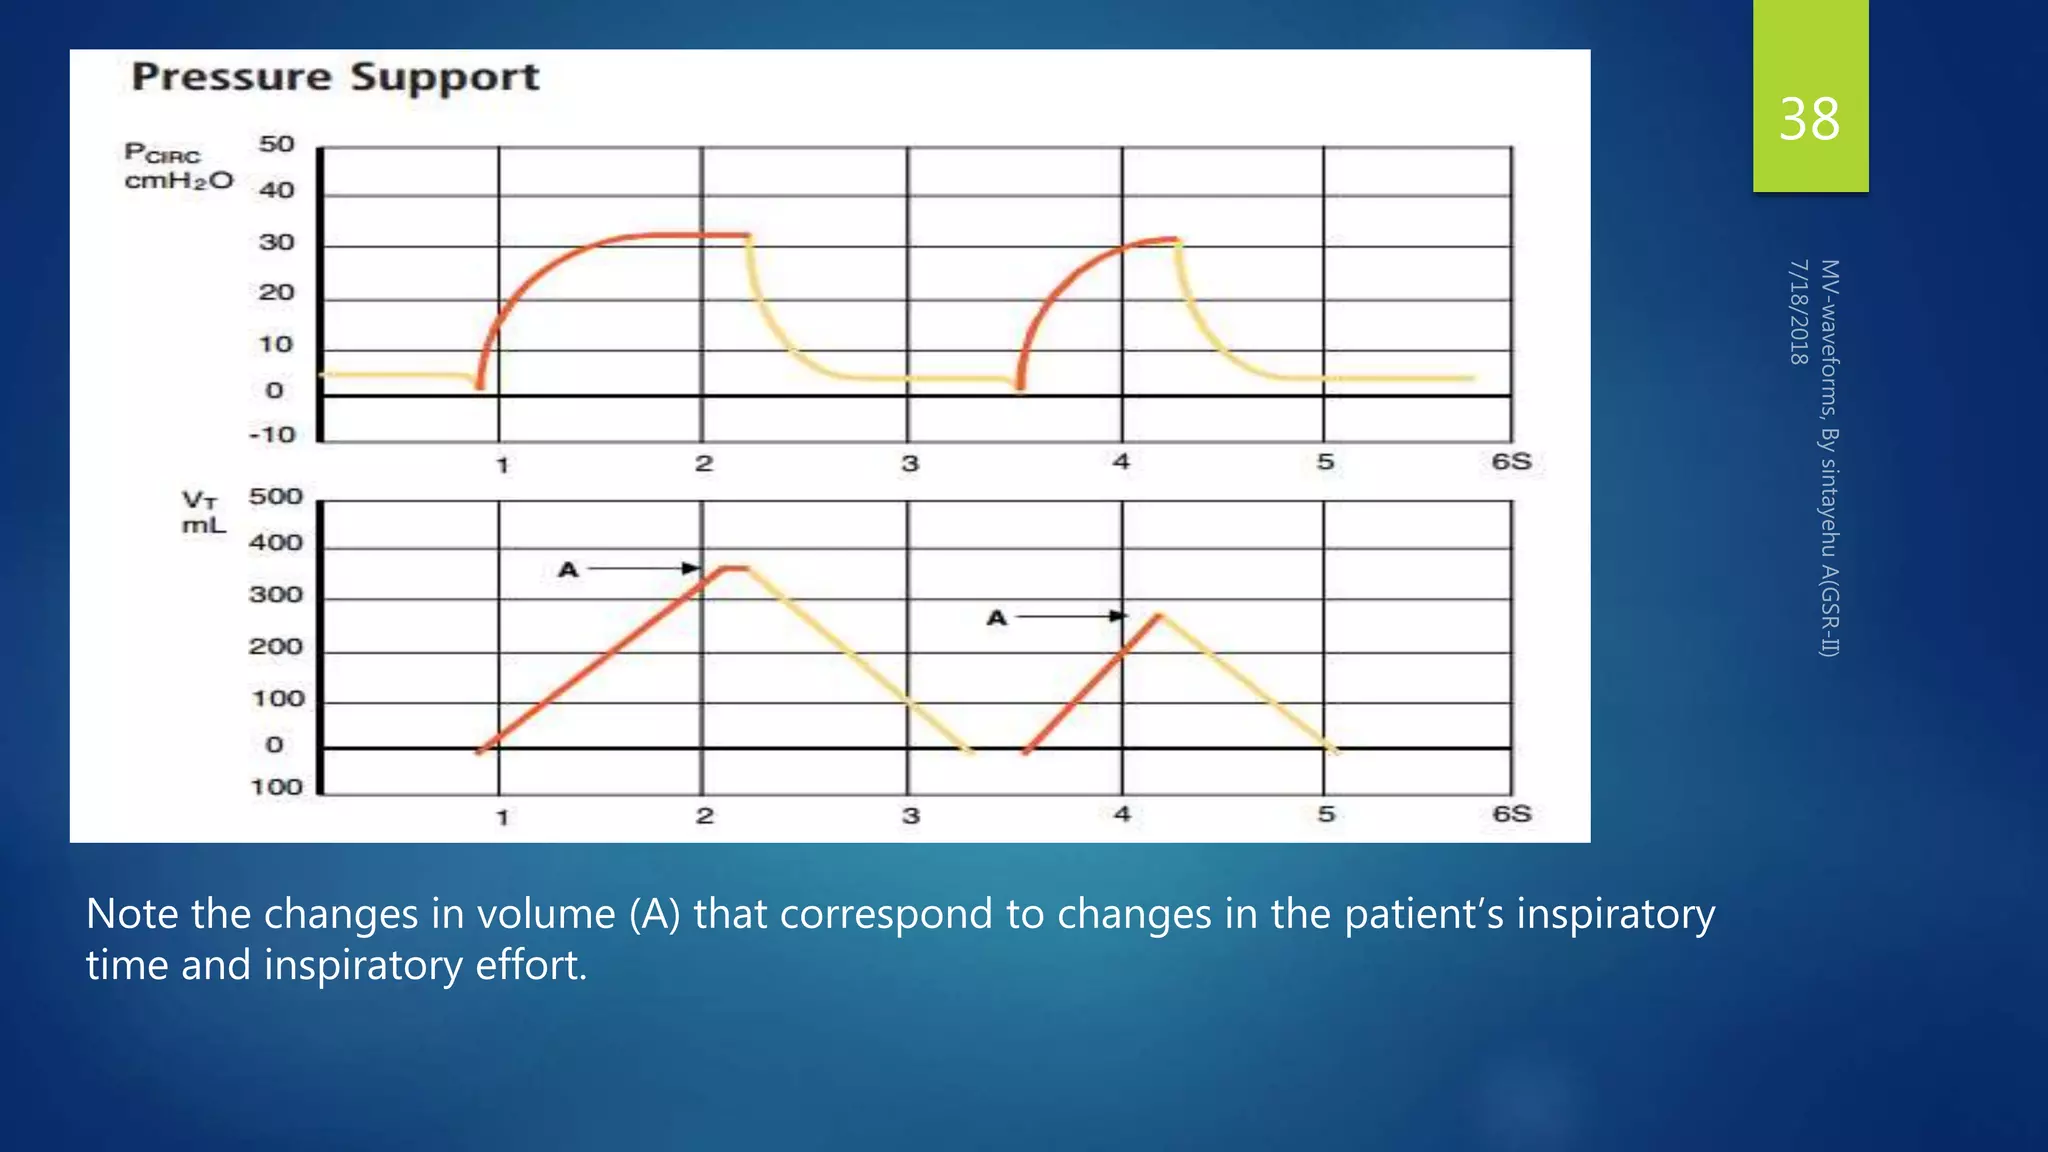
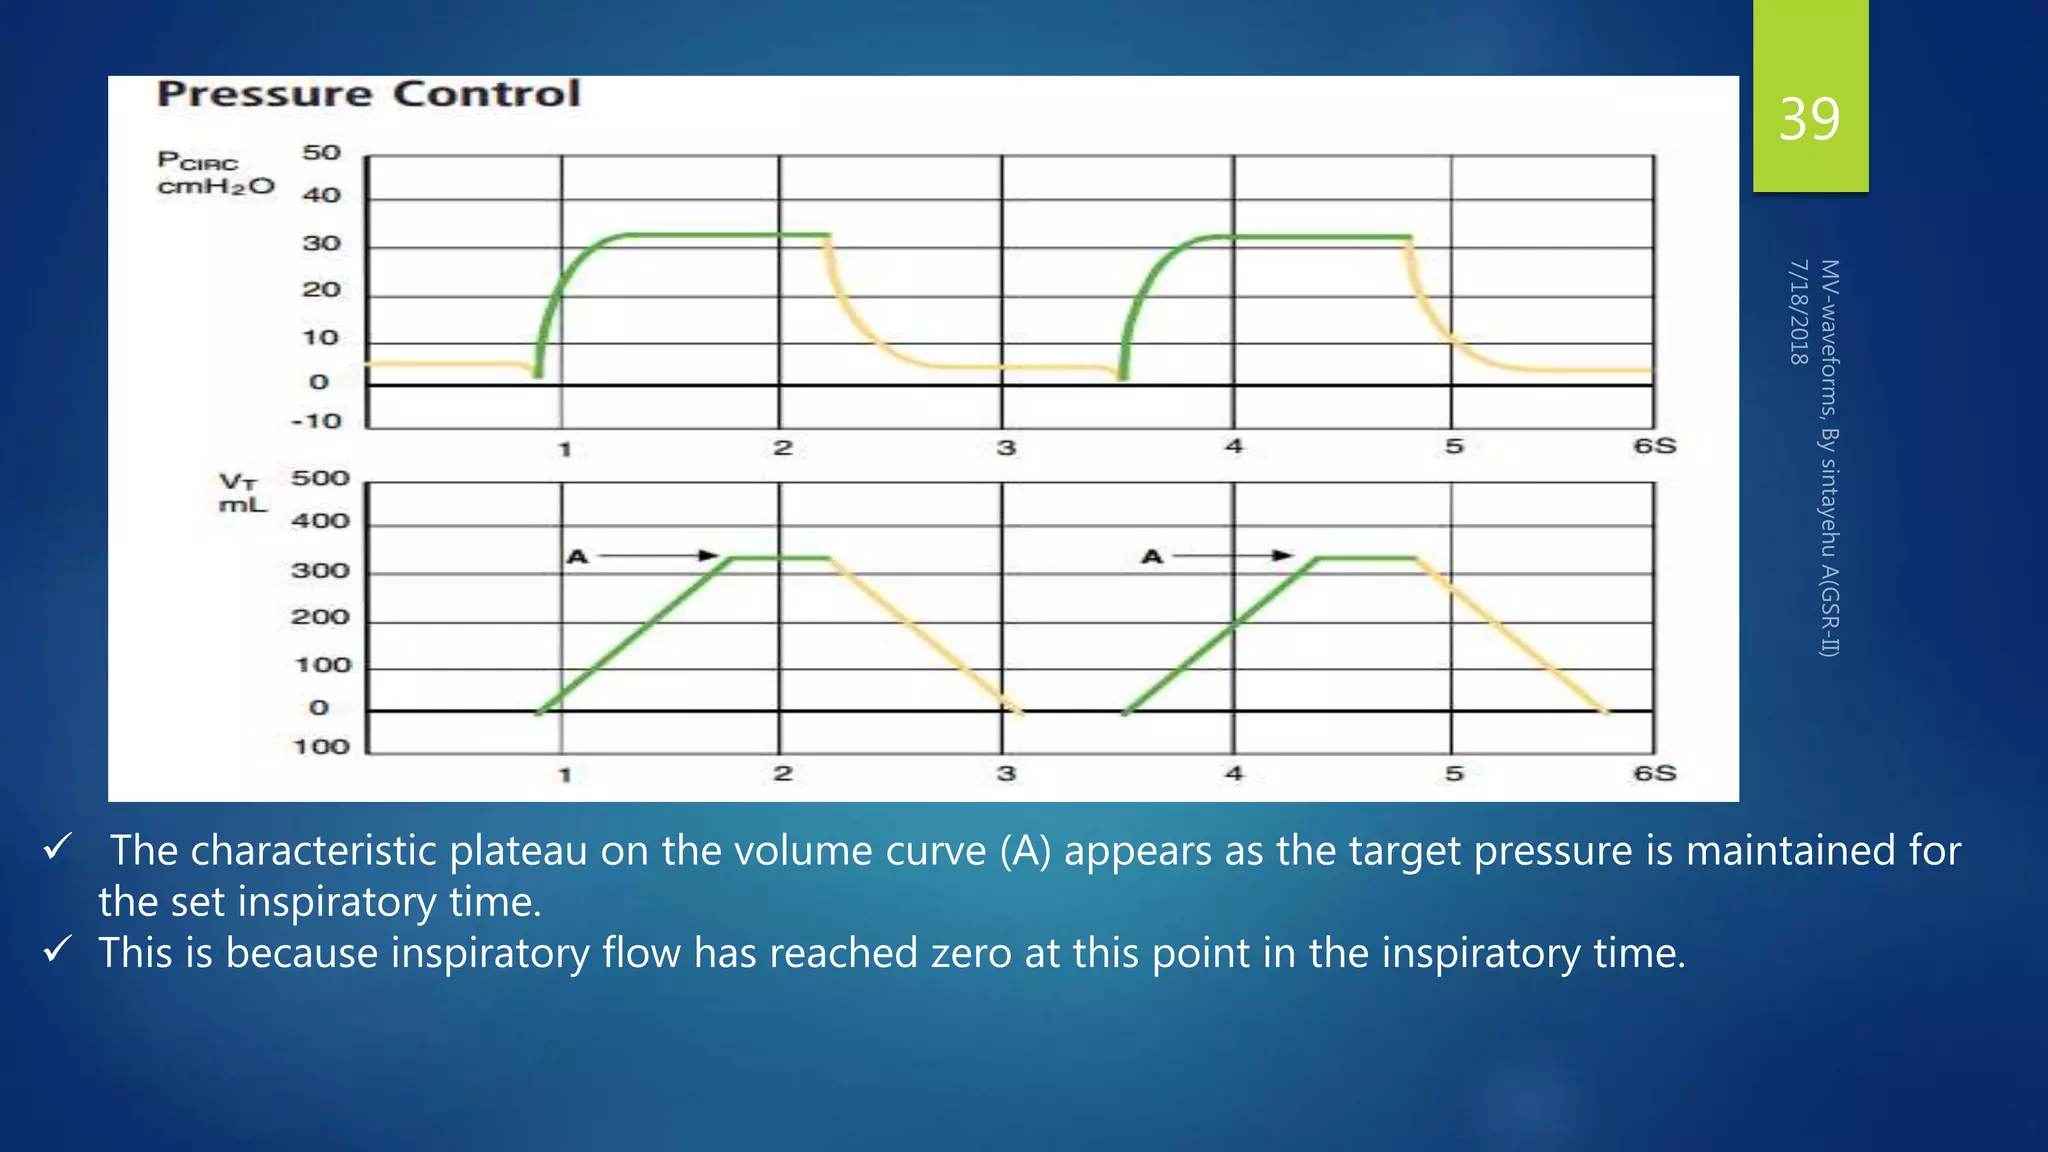
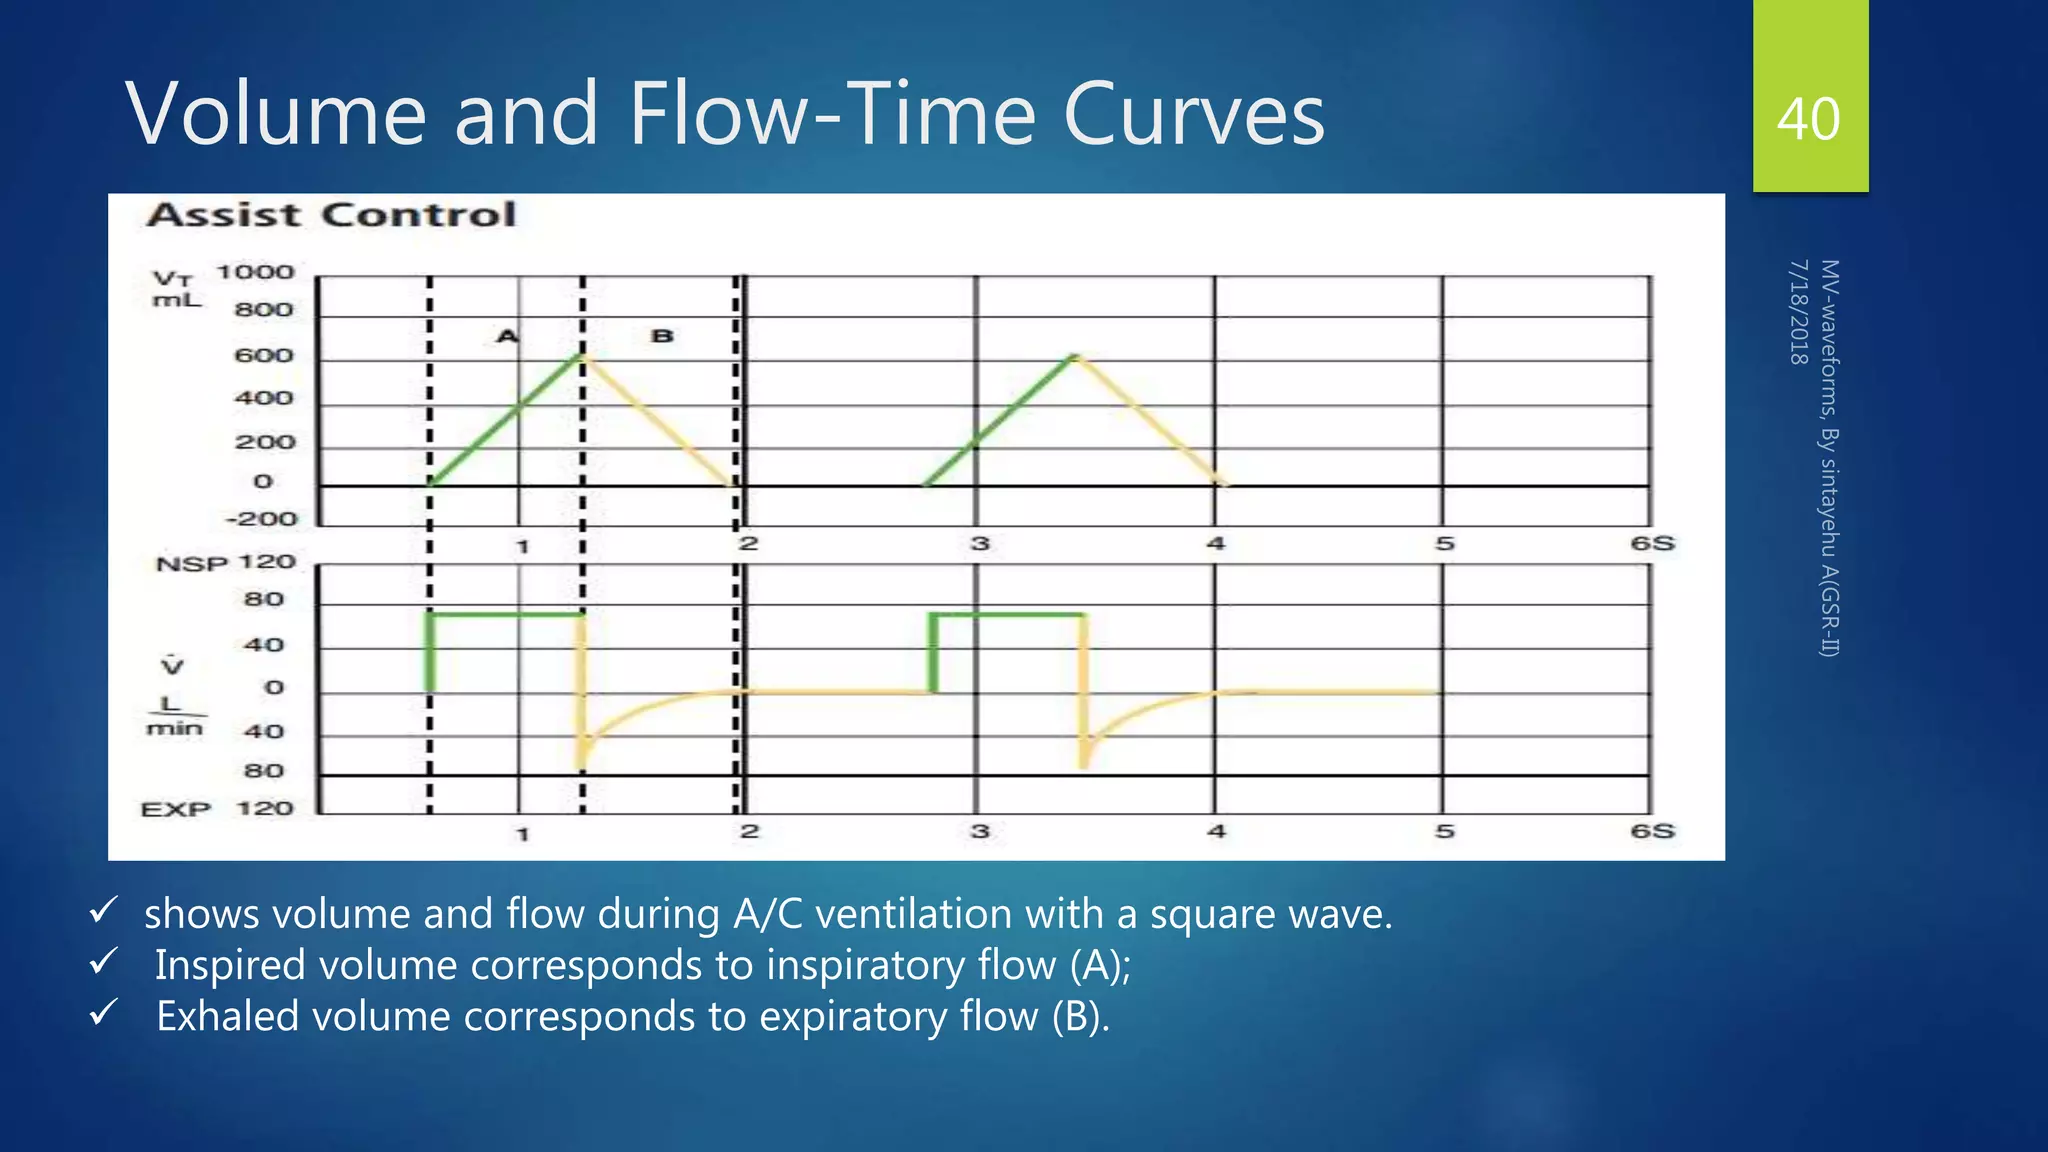
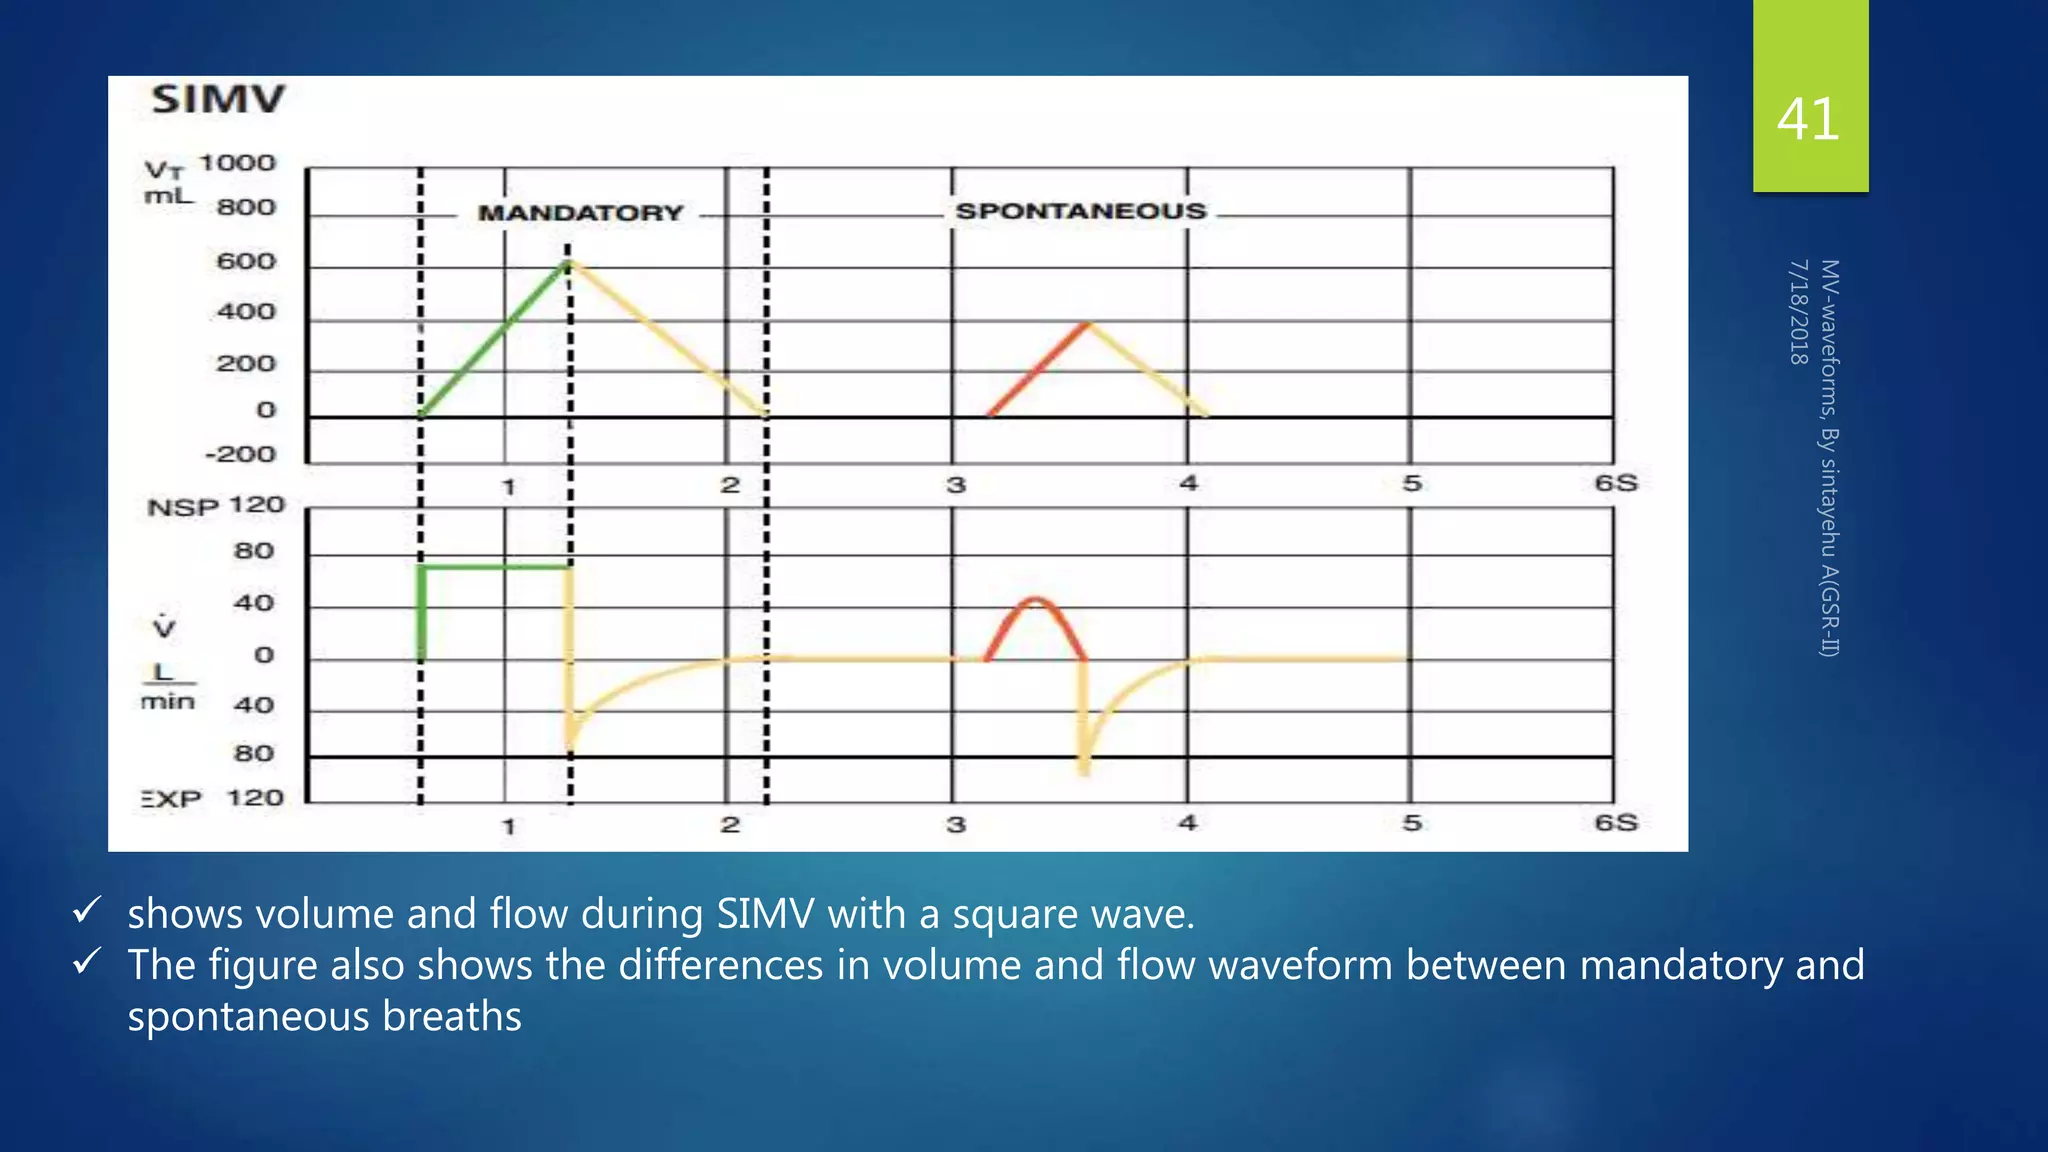
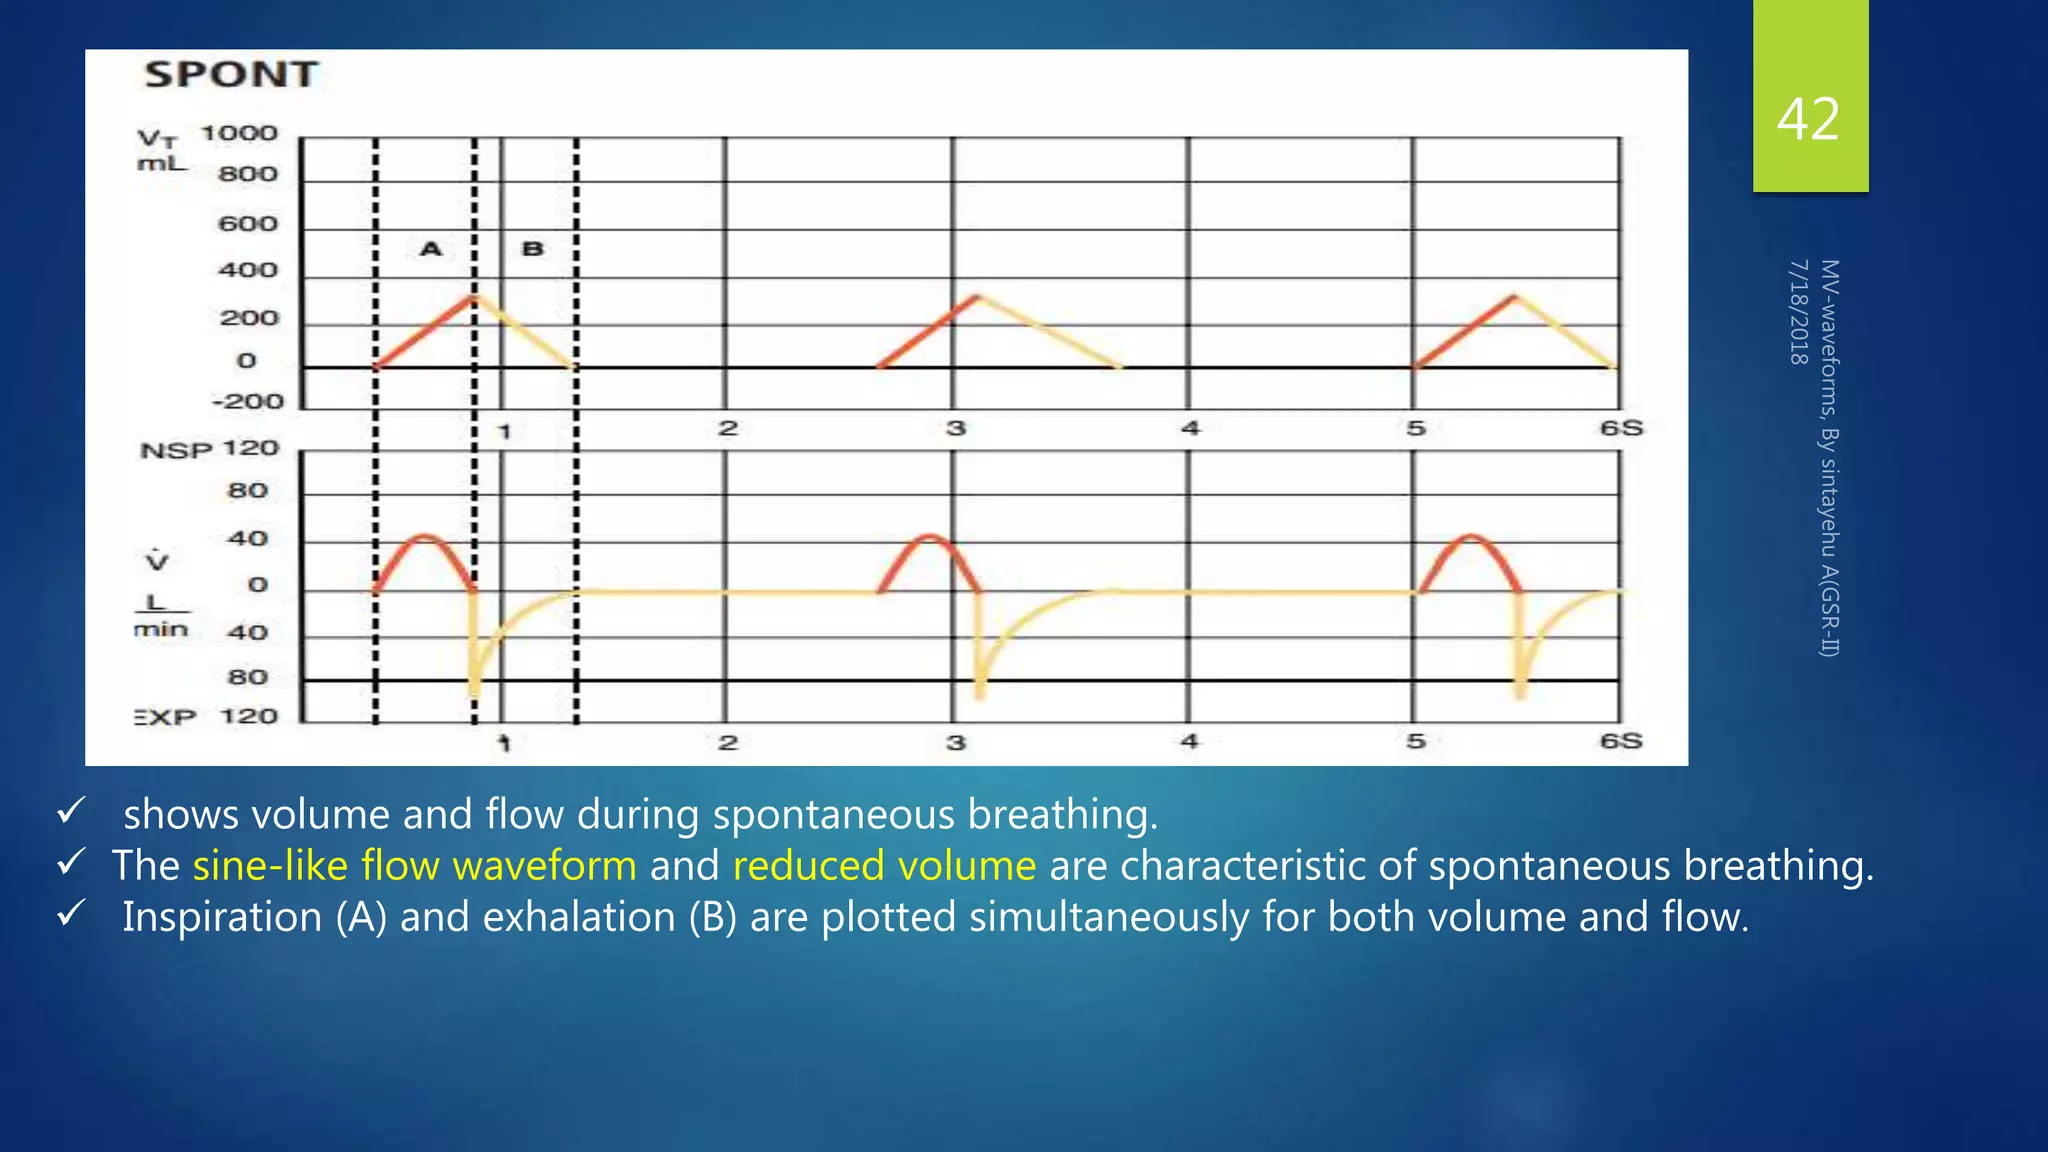
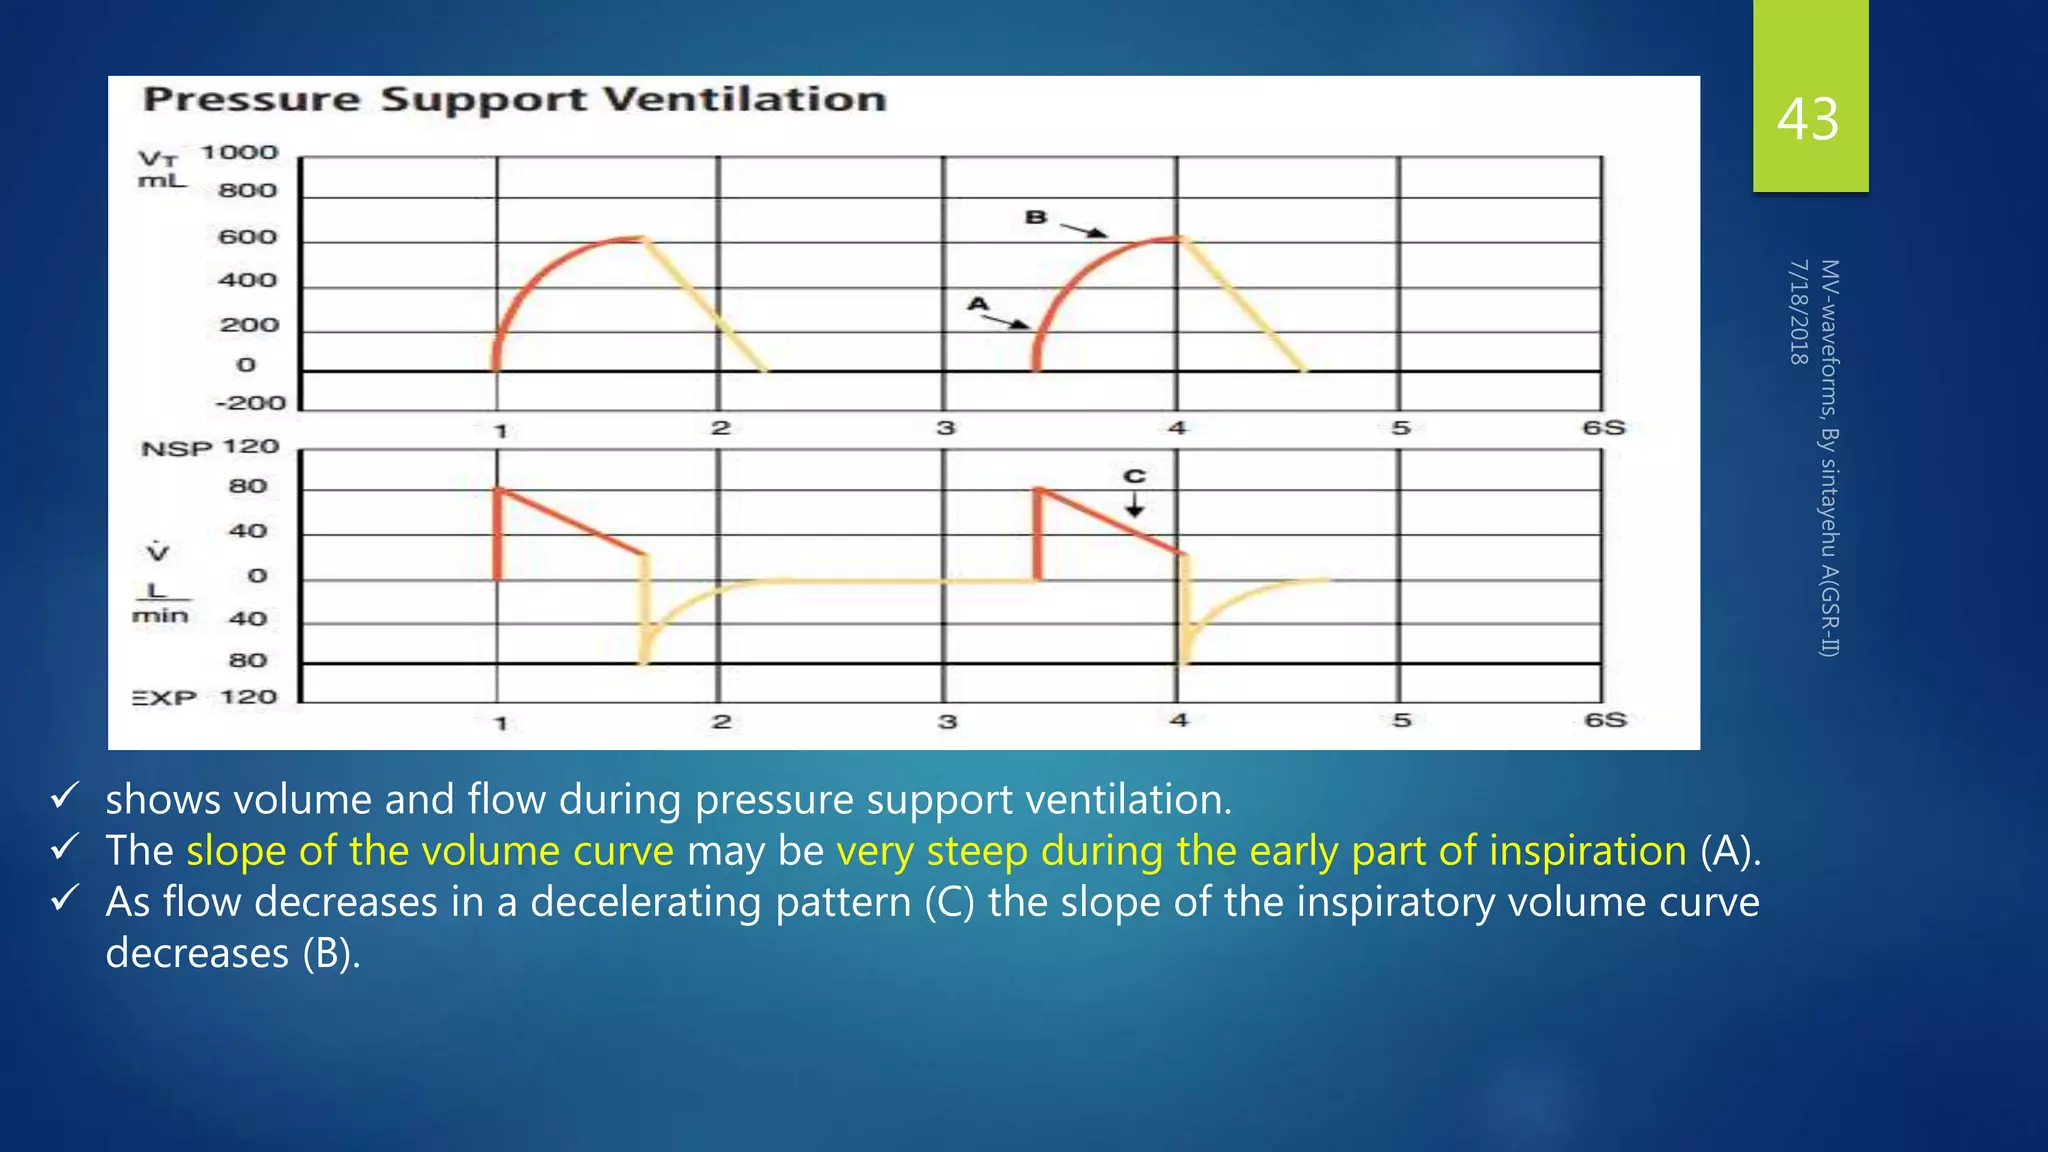
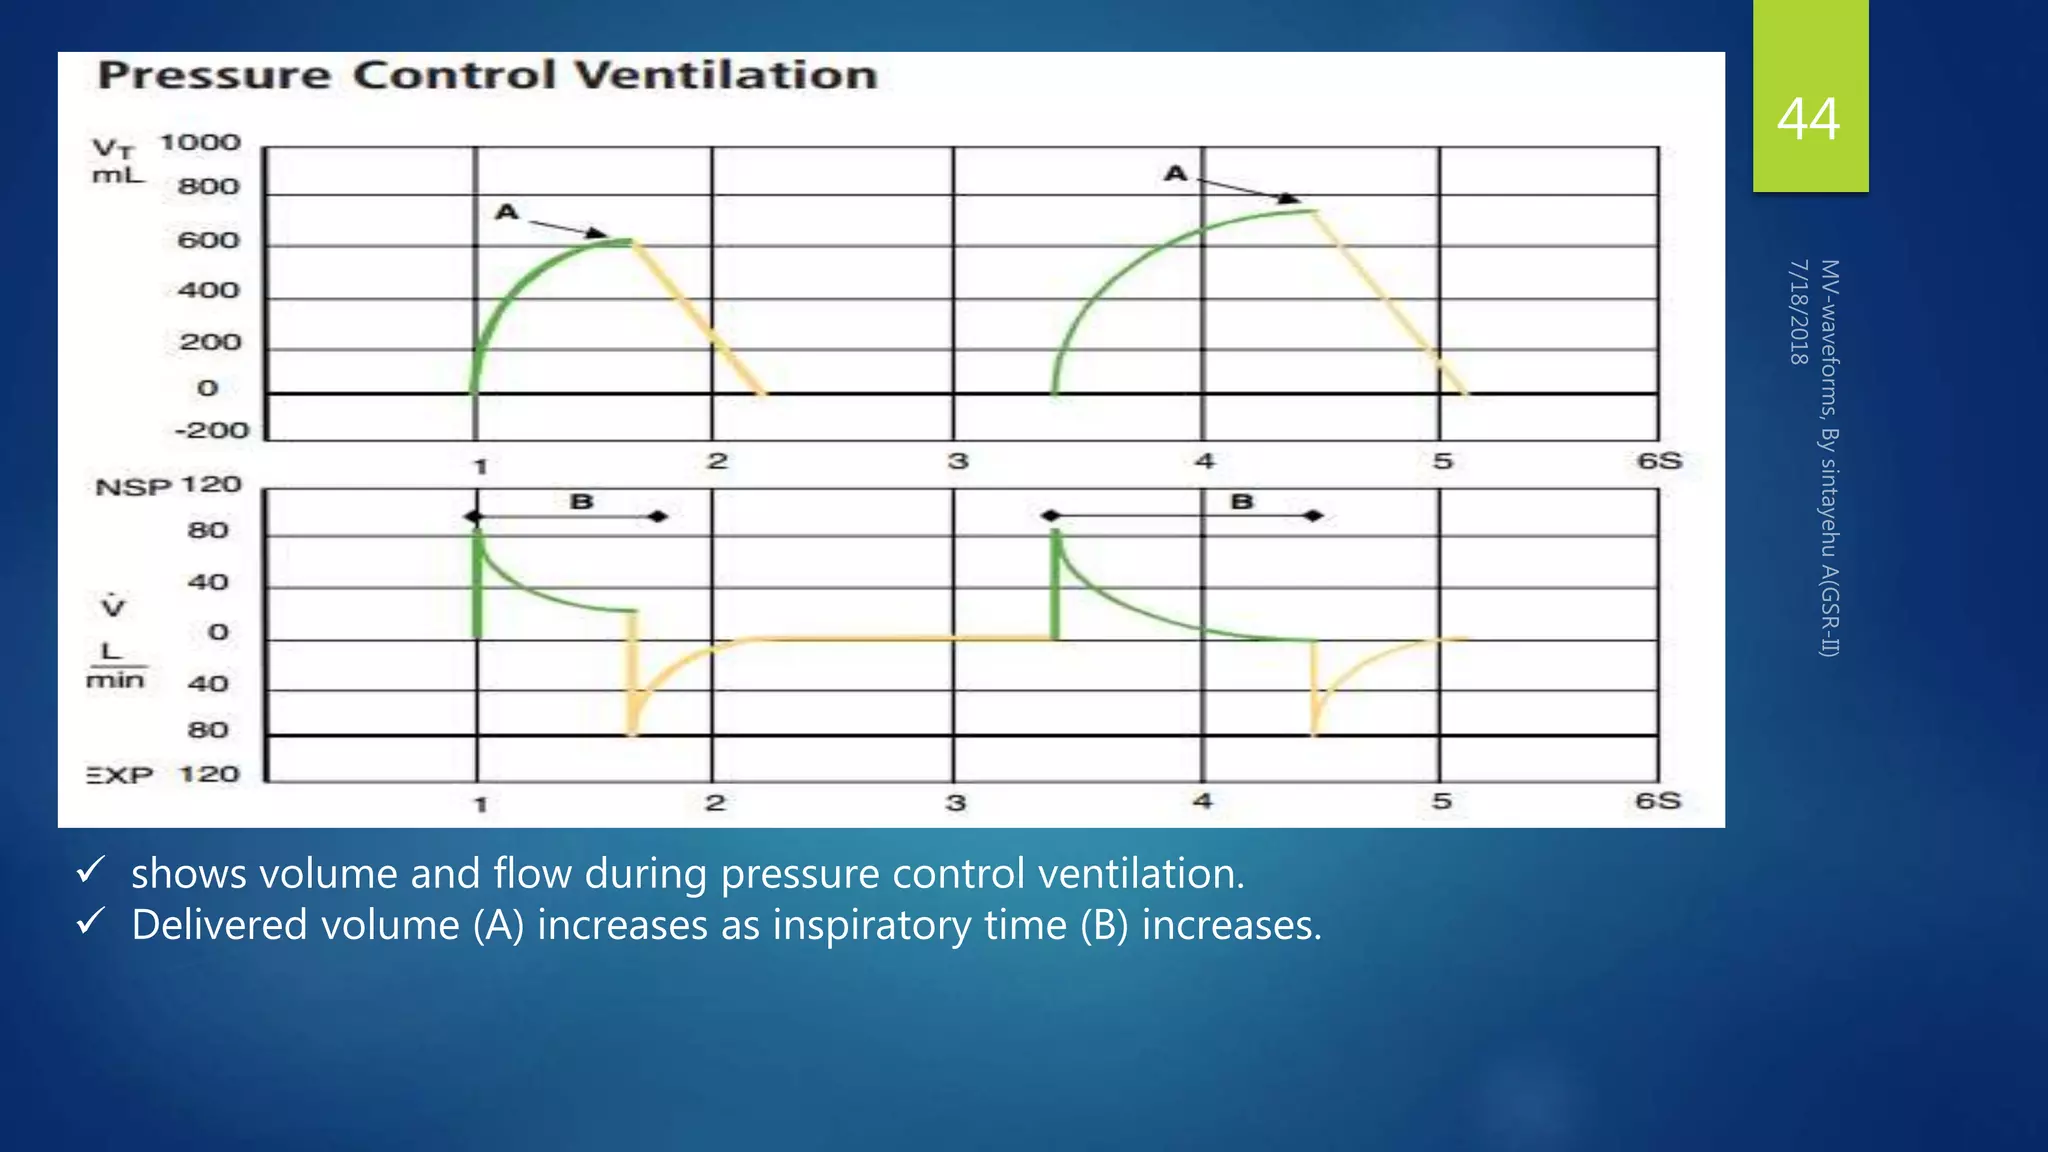
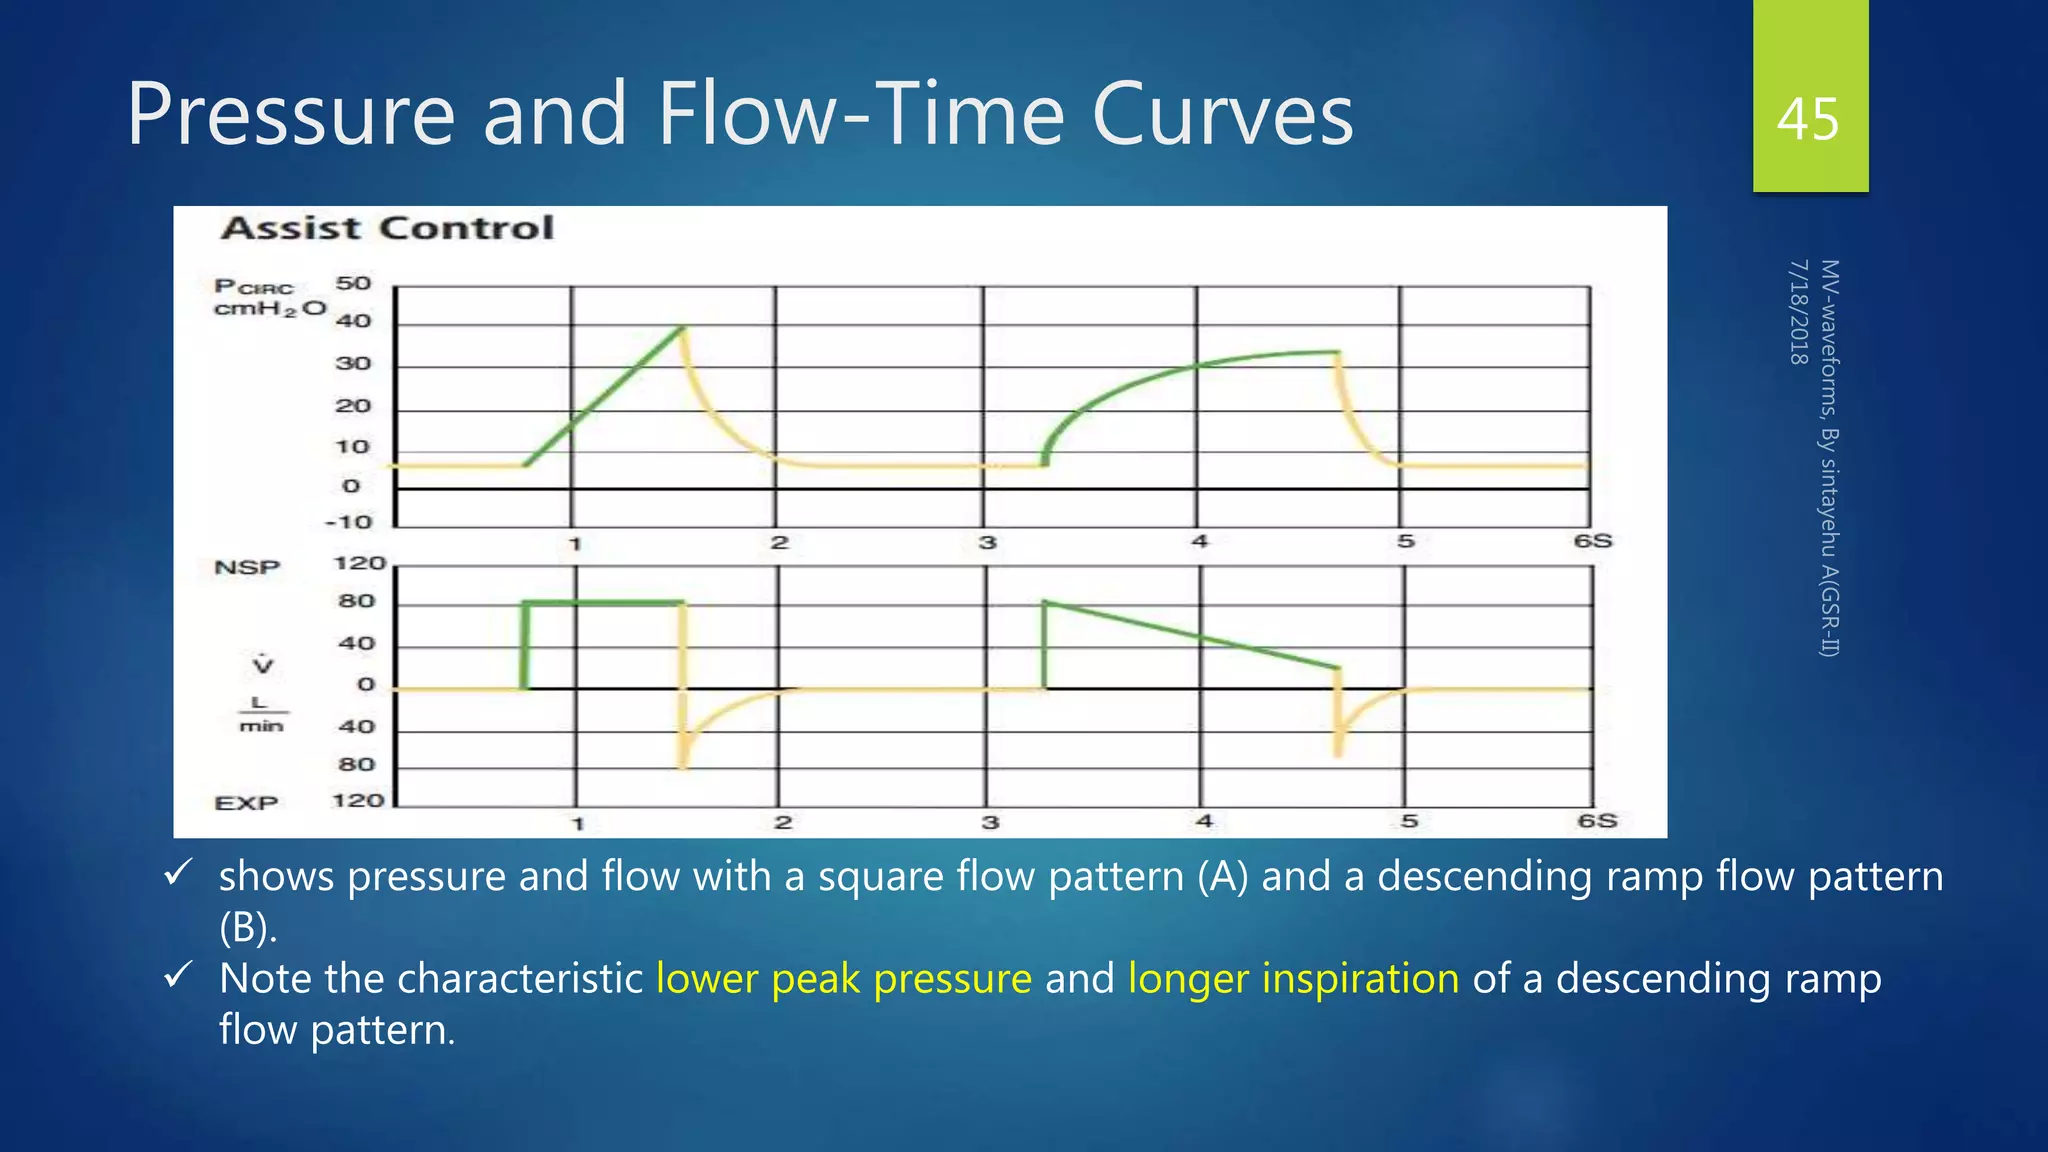
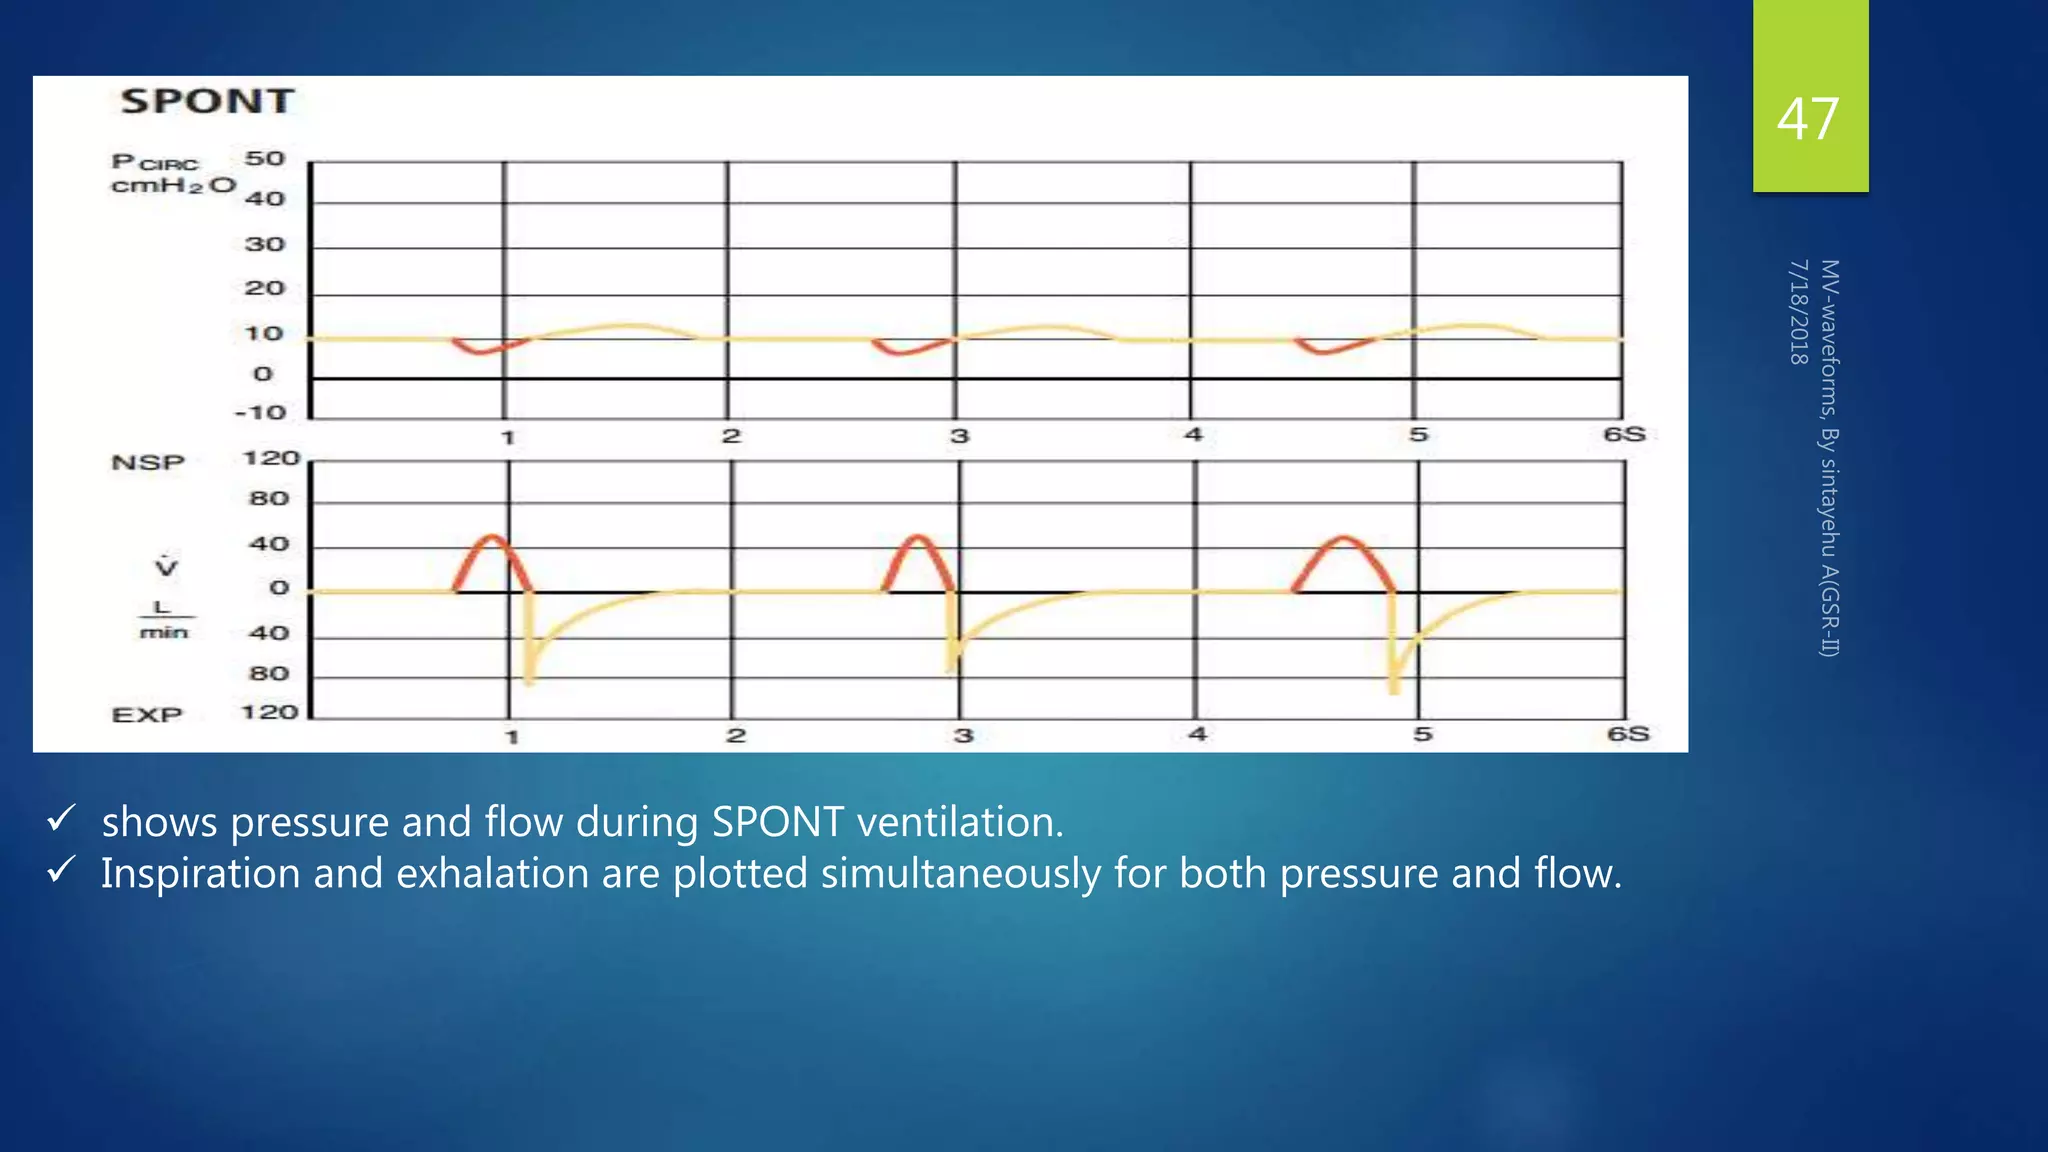
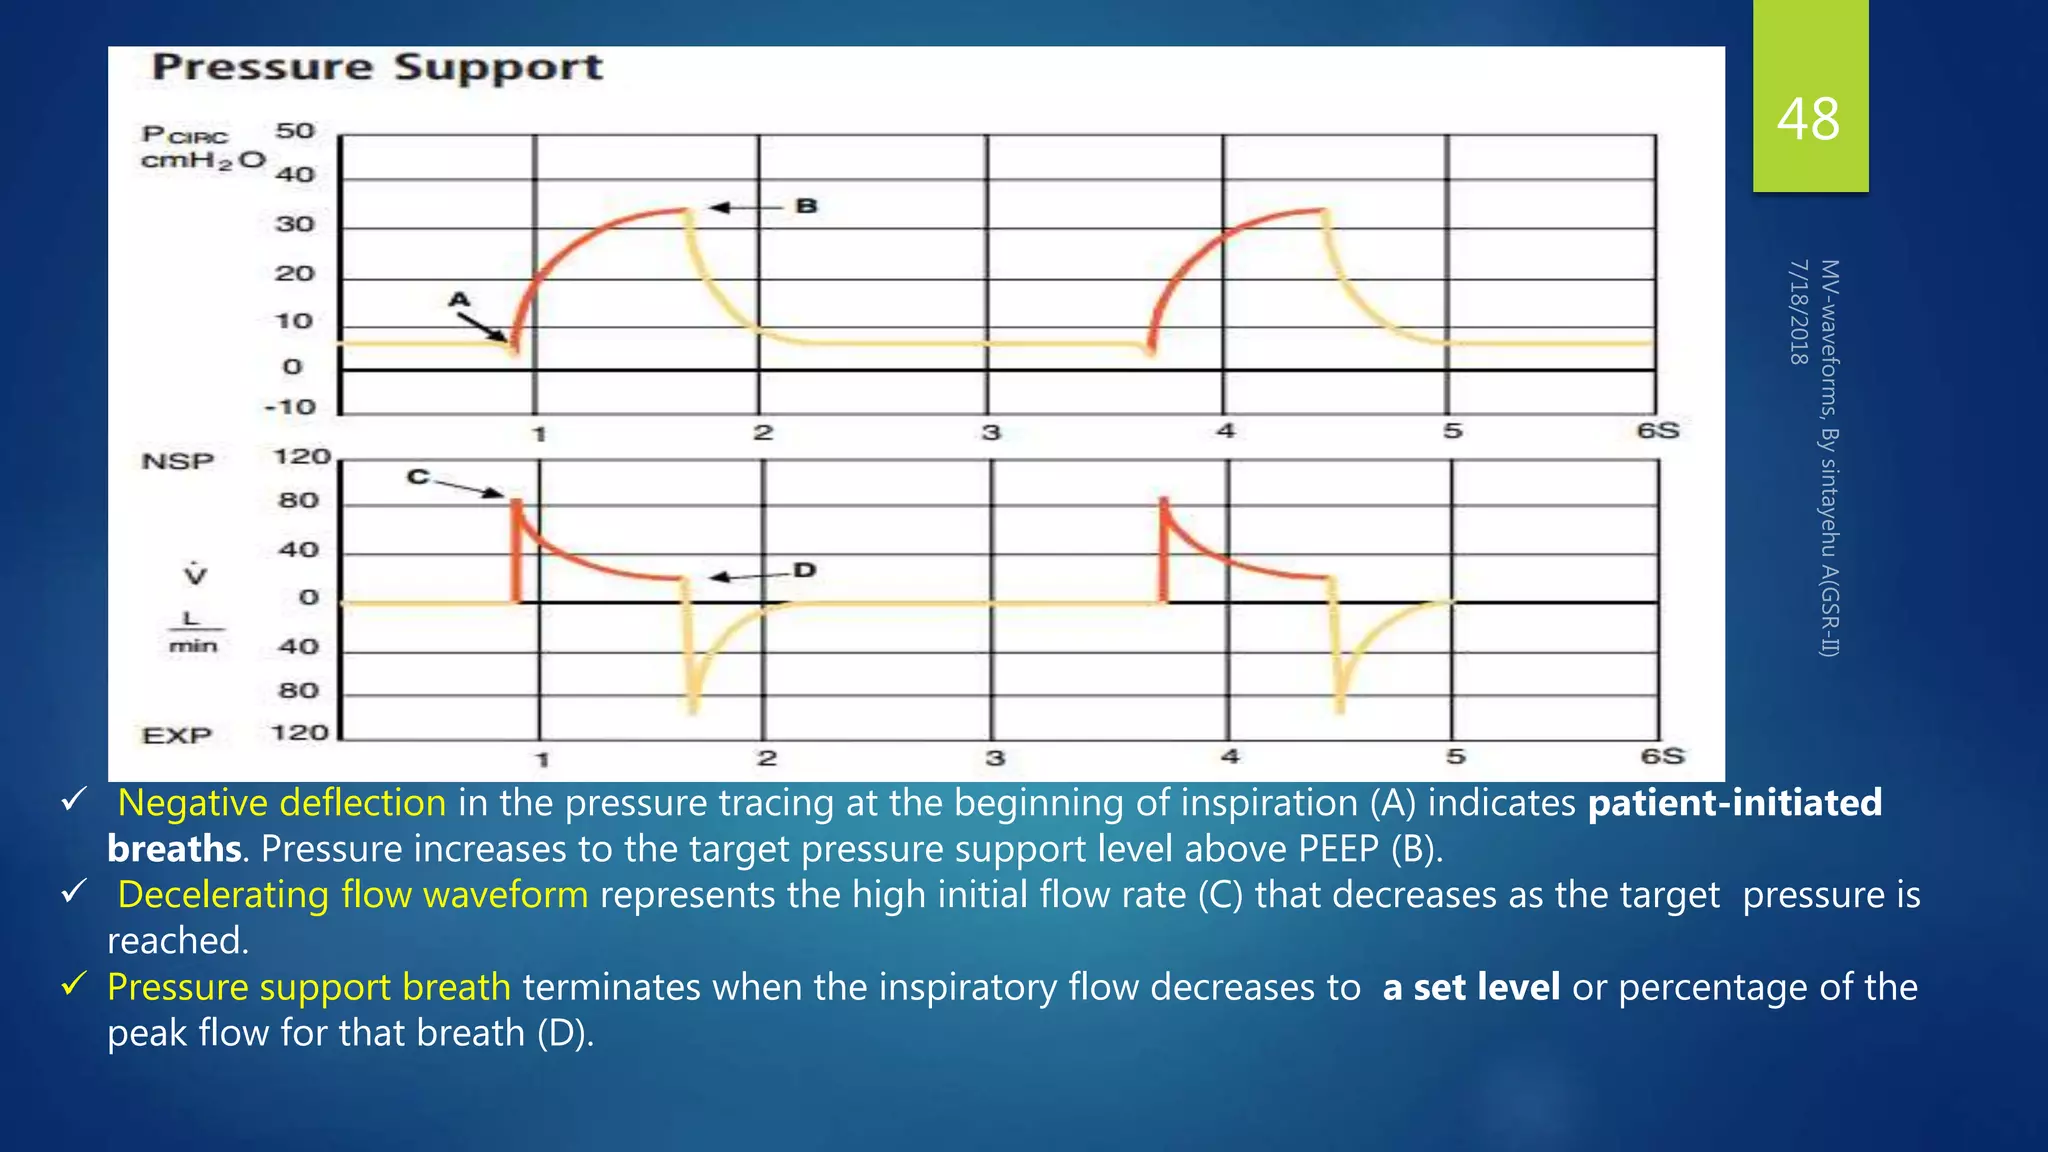
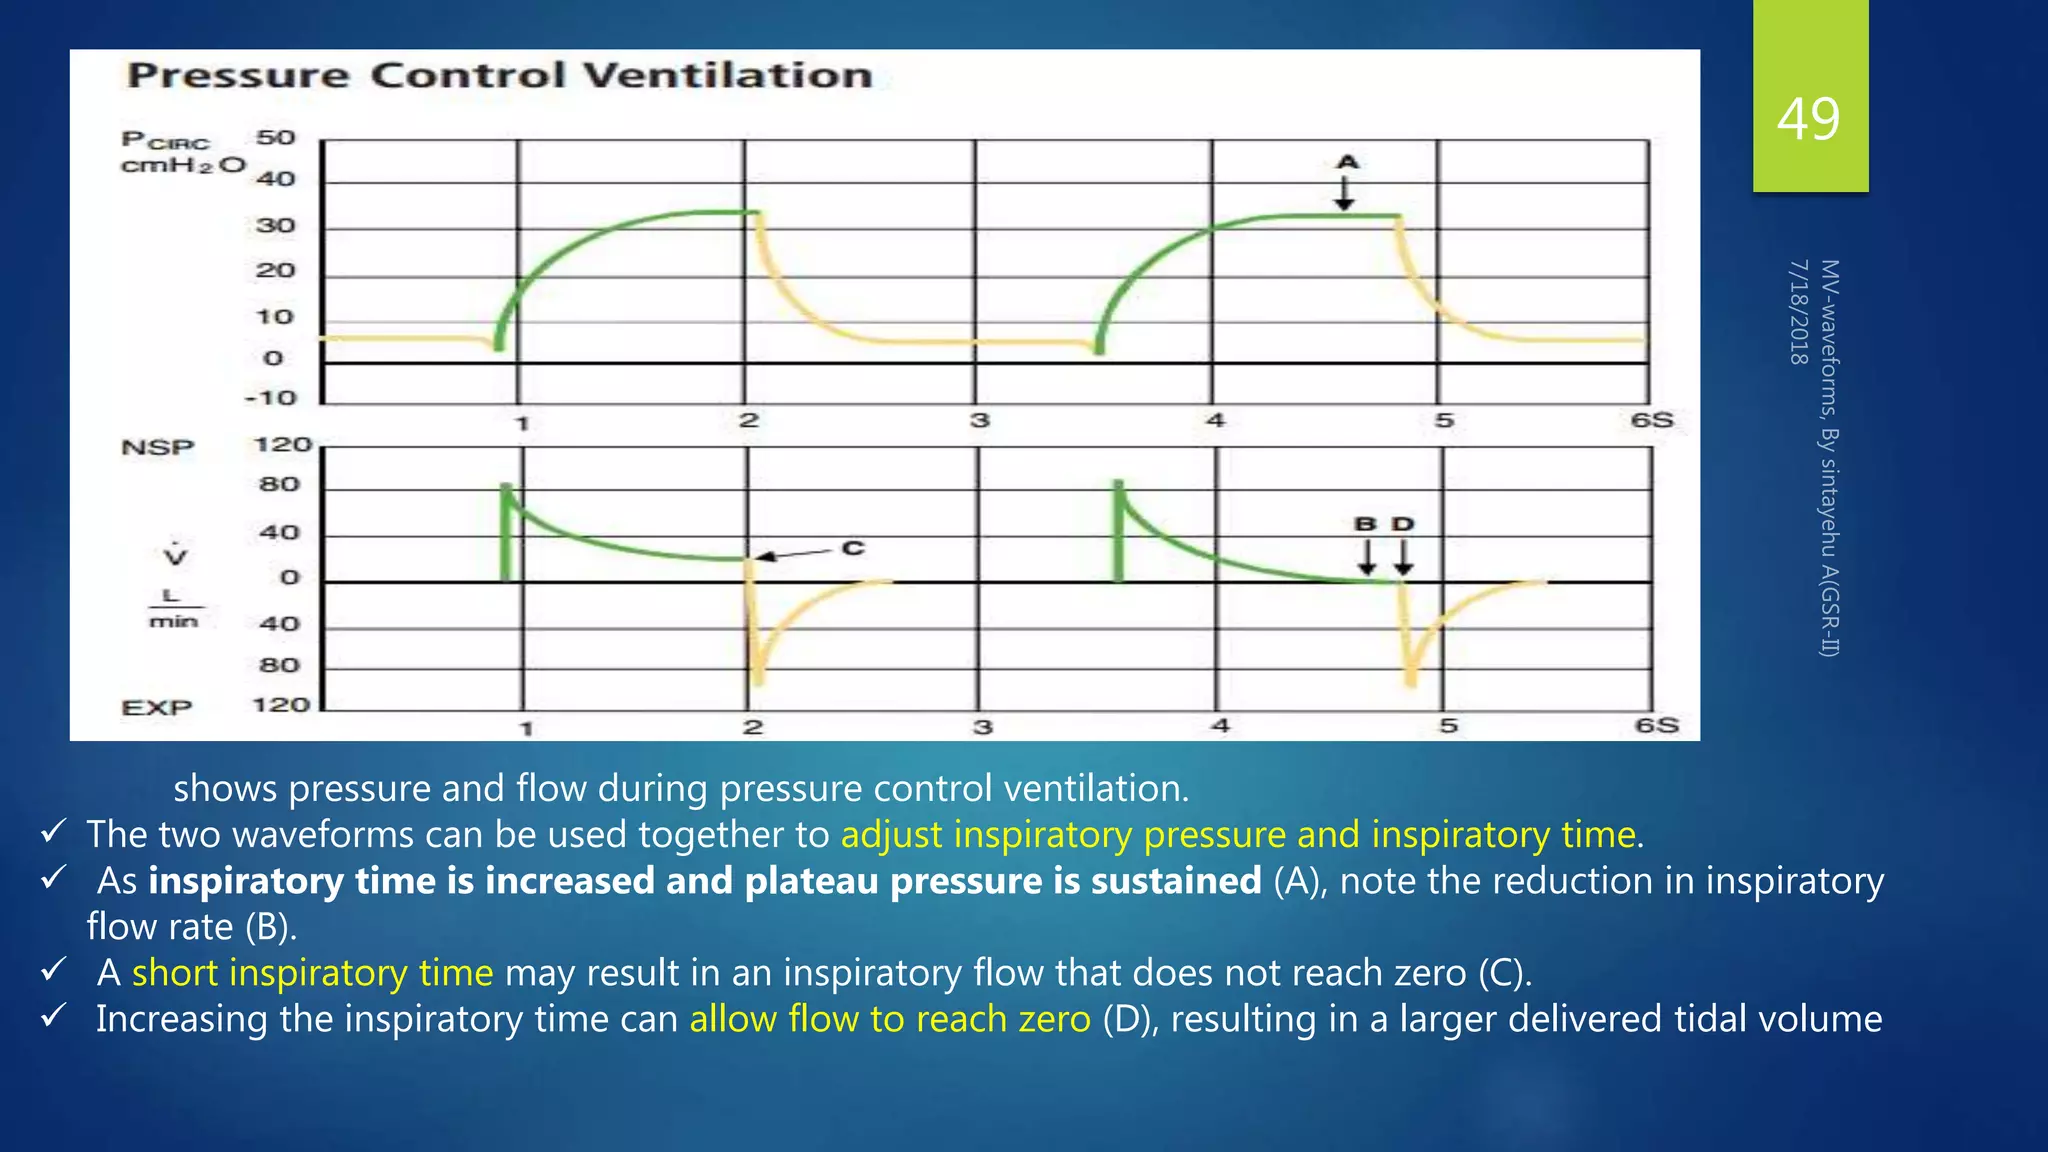
Mechanical ventilation
wave forms
BY SINTAYEHU( GSR=II)
1
Objectives
 To discuss mechanical ventilation waveforms
 To discuss most commonly used waveforms
 To discuss applications of most commonly used waveforms
 To discuss combined waveforms
2
Outline
 Introduction
 Pressure vs time curves
 Volume vs time curves
 Flow vs time curves
 Combined curves
3
Introduction
 Waveforms are graphical representations of data collected by the
ventilator
 Either integrated with changes in time as in
 Pressure-Time,
 Flow-Time or
 Volume-Time curves) or
 with one another as in
 Pressure-Volume or
 Flow-Volume loops)
 Waveforms offer the user a “window” into what is happening to the patient
in real-time in the form of pictures
4
Contd.
 Waveforms can help the clinician:
 detect circuit and airway leaks,
 estimate imposed ventilatory work, and
 aid in assessing the efficacy of bronchodilator therapy.
 Lung damage secondary to mechanical ventilation (barotraumas/volutrauma
5
Contd.
 The graphic display of flow, pressure and volume is generally visualized in
two formats:
 Waveforms: a graphic display of a variable against time
 Progression of the event always in one direction Lt to Rt
 Loops : are graphic display of two variables against each other
 Progression of the event always returns to its origin
 Modes of ventilation directly affect flow, pressure and volume patterns
 During MV generated breaths ,the inspiratory profile is affected by the
mode of ventilation
 The set inspiratory time can affect the duration of the expiratory profile as
in I:E ratio
6
Contd.
 Most ventilators can operate as a volume controller or pressure controller
 As a volume controller:
 The ventilator can deliver a mechanical breath with a constant volume pattern
 Only pressure varies according to the dynamic characteristic of the respiratory
system
 As a pressure controller:
 The ventilator delivers mechanical ventilation with a constant pressure pattern
 Both flow and volume vary according to the dynamic characteristic of the
respiratory system.
7
Triggers 8
Breath Termination (Cycling): 9
Most Commonly Used Waveforms
(Scalars)
 Pressure vs. Time
 Flow vs. Time
 Volume vs. Time
10
PRESSURE-TIME CURVES
 graphic representation of pressure changes over time
11
APPLICATIONS OF PRESSURE-TIME
CURVES
Provides these information:
• Breath type delivered to the patient
• Work required to trigger the breath
• Breath timing (inspiration vs exhalation)
• Pressure waveform shape
• Adequacy of inspiration
 Adequacy of inspiratory plateau
• Adequacy of inspiratory flow
• Adequacy of the Rise Time setting
12
Identifying Breath Types
1. Ventilator-initiated mandatory breaths
13
With no flow-triggering applied, a pressure rise without a pressure deflection
below baseline (A) indicates a ventilator-initiated breath
2. Patient-Initiated Mandatory Breaths 14
A pressure deflection below baseline (A) just before a rise in pressure
indicates a patient’s inspiratory effort resulting in a delivered breath
3. Spontaneous Breaths 15
Spontaneous breaths (without Pressure Support) are represented by
comparatively smaller changes in pressure as the patient breathes above and
below the baseline .
Pressure below the baseline represents inspiration (A) and
pressure above the baseline represents exhalation (B).
4. Pressure Support breaths 16
Breaths that rise to a plateau and display varying inspiratory
times indicate pressure supported breaths
5. Pressure Control breaths 17
breaths that rise to a plateau and display constant inspiratory
times, indicating pressure controlled breaths.
Assessing the Work to Trigger a Breath 18
depth of the pressure deflection below the baseline (PT) and the time the pressure
remains below the baseline (DTOT) indicates the patient’s effort to trigger a breath.
Larger trigger pressures (PT) and/or longer trigger delay times (DT) may also indicate
an inadequate trigger sensitivity setting on the ventilator or a slow response time by the
ventilator itself.
Evaluating Respiratory Events 19
A to B indicates the inspiratory time; B to C indicates the expiratory time.
If the pressure during exhalation does not return to baseline before the next inspiration is
delivered (D), the expiratory time may not be adequate.
Adjusting Peak Flow Rate 20
during volume ventilation, the rate of rise in pressure is related to the peak flow setting.
A lag or delay (A) in achieving the peak pressure could indicate an inadequate flow setting.
A very fast rise to pressure (B), often accompanied by an increased peak pressure, could indicate
an inappropriately high flow setting.
Assessing Rise Time 21
Ideal waveform for patients receiving pressure ventilation is roughly square in shape(B) with a rapid rise to
target pressure, target pressure is reached early in the inspiratory phase and remains at the target pressure
for the duration of the inspiratory time. may help satisfy the patient’s flow demand while contributing to a
higher mean airway pressure
If compliance or flow demand is high, the rise to pressure may be too slow, target pressure is achieved late
(A) decreasing MAP.
Rise time that is too fast could result in delivered pressure exceeding the set target pressure and potentially
exposing the patient to higher-than-acceptable pressures (C).
Assessing Auto-PEEP Maneuver 22
 An expiratory pause allows pressure in the lungs to equilibrate with pressure in the circuit, which is
measured as Total PEEP (PEEPTOT).
 subtracting the set PEEP,the difference is considered Auto-PEEP. (A) represents the point of
equilibration and also the minimum adequate time for the expiratory pause.
 A shorter pause time would not allow complete pressure equilibration, resulting in a potential
underreporting of the PEEPTOTand therefore an underestimation of the patient’s Auto-PEEP.
Flow vs time curve=volume of gas moved or displaced in a specific time period period
23
 Peak inspiratory flow is the highest flow rate achieved during inspiration (D).
 Peak expiratory flow rate is the highest flow rate achieved during exhalation (E)
 Flow shown above the zero flow line is inspiratory flow and flow shown below the zero flow line is expiratory
flow.
 Inspiratory time is measured from the beginning of inspiration to the beginning of exhalation (A to B).
Expiratory time is measured from the beginning of exhalation to the beginning of the next inspiration (B to C).
Applications of FLOW-TIME CURVES
 The flow-time curve can be used to detect:
• Waveform shape
• Type of breathing
• Presence of Auto-PEEP (Intrinsic PEEP)
• Patient’s response to bronchodilators
• Adequacy of inspiratory time in pressure control ventilation
• Presence and rate of continuous air leaks
24
Verifying Flow Waveform Shapes 25
In volume control ventilation, the ventilator can be set to deliver flow in:
• A square wave pattern,
where the peak flow rate is set and the flow is constant through the inspiratory phase. can produce higher
peak pressure
• A descending ramp flow wave,
where the set peak flow is delivered at the beginning of the breath and decreases in a linear fashion until
the volume is delivered. can produce lower peak pressures but can increase the inspiratory time
significantly.
A sinewaveform, where the inspiratory flow gradually increases and then decreases back to zero. This method
of delivering flow may cause patient discomfort
Detecting the Type of Breathing 26
Square and descending ramp flow patterns are characteristic of volume control mandatory breaths with the volume, flow rate
and flow waveform set by the clinician.
Decelerating flow waveform characteristic of pressure ventilation may actually display a flow of zero at the end of
inspiration, in Pressure Control, if the inspiratory time is set long enough.
Spontaneous breaths without pressure support results in sine-like Inspiratory flow pattern with a
lower peak flow rate.
Pressure support breaths will be represented by a decelerating flow waveform w/c doen’t return to
zero at the end of inspiration
Determining the Presence of Auto-PEEP 27
Auto-PEEP, or Intrinsic PEEP (PEEPI) refers to the presence of positive pressure in the lungs at the end
of exhalation (air trapping).
 Indicated by an expiratory flow that doesn’t return to zero before the next inspiration begins(A).
 Is most often the result of insufficient expiratory time.
 A higher end-expiratory flow generally corresponds to a higher level of Auto-PEEP (B).
 A lower end-expiratory flow generally corresponds to a lower level of Auto-PEEP (C).
Missed Inspiratory Efforts Due to Auto-PEEP
= Patient inspiratory efforts that did not trigger a breath.
28
This occurs when the patient has not been able to finish exhaling when an inspiratory effort
is made (A)
 To trigger a breath, the patient must inspire through the Auto-PEEP and meet the set
trigger threshold to trigger the ventilator.
 Patients with weak inspiratory efforts are often unable to trigger breaths when
significant Auto-PEEP is present
Evaluating Bronchodilator Response 29
Compare the peak expiratory flow rates (A) and the time to reach zero flow (B).
 The post-bronchodilator curve shows an increased peak expiratory flow rate and a reduced
time to reach zero flow, potentially indicating improvement following bronchodilator
therapy.
 This improvement in expiratory air flow may also be seen after the patient is suctioned
Evaluating Inspiratory Time Setting in Pressure Control 30
 Shorter inspiratory times may terminate inspiration before the inspiratory flow reaches zero (A).
 Increasing the inspiratory time so the inspiratory flow reaches zero before transitioning into
exhalation (B) can result in the delivery of larger tidal volumes without increasing the pressure.
 Further increasing the inspiratory time beyond the zero flow point will generally not deliver any
additional tidal volume but results in a pressure plateau (C)
VOLUME-TIME CURVES 31
 The upslope (A) indicates inspiratory volume while the downslope (B) indicates expiratory
volume.
 Inspiratory time (I Time) is measured from the beginning of inspiration to the beginning of
exhalation.
 Expiratory time (E Time) is measured from the beginning of exhalation to the beginning of
inspiration.
Applications
 The volume-time curves may be used to detect:
• Air trapping
• Leaks in the patient circuit
32
Detecting Air Trapping or Leaks 33
shows exhalations that do not return to zero (A). Volume in and volume out are not always
equal.
 Air leaks or air trapping often result in an expiratory volume that is lower than the
inspired volume.
 The plateau displayed during exhalation (A) is the expired volume until the start of the
next inspiration.
COMBINED CURVES
 Many conditions can be identified by viewing two curves simultaneously.
 Examples of combined pressure, flow and volume time curves in in
different ventilatory modalities:
 Assist Control (A/C or CMV)
 Synchronized Intermittent Mandatory Ventilation (SIMV)
 Spontaneous (SPONT or CPAP)
 Pressure Support
 Pressure Control
34
Pressure and Volume-Time Curves 35
volume and pressure rise simultaneously. A patient-initiated breath is indicated by a slight
negative deflection in pressure (A).
36
 The small pressure fluctuations and concurrent volume changes indicate
spontaneous breathing (A).
 Negative pressure deflections just before a pressure rise indicate a patient-initiated
breath(B)
37
 The small fluctuations in pressure and volumes (A and B) indicate spontaneous breathing.
 The variability in volume from breath to breath is characteristic of spontaneous breathing.
38
Note the changes in volume (A) that correspond to changes in the patient’s inspiratory
time and inspiratory effort.
39
 The characteristic plateau on the volume curve (A) appears as the target pressure is maintained for
the set inspiratory time.
 This is because inspiratory flow has reached zero at this point in the inspiratory time.
Volume and Flow-Time Curves 40
 shows volume and flow during A/C ventilation with a square wave.
 Inspired volume corresponds to inspiratory flow (A);
 Exhaled volume corresponds to expiratory flow (B).
41
 shows volume and flow during SIMV with a square wave.
 The figure also shows the differences in volume and flow waveform between mandatory and
spontaneous breaths
42
 shows volume and flow during spontaneous breathing.
 The sine-like flow waveform and reduced volume are characteristic of spontaneous breathing.
 Inspiration (A) and exhalation (B) are plotted simultaneously for both volume and flow.
43
 shows volume and flow during pressure support ventilation.
 The slope of the volume curve may be very steep during the early part of inspiration (A).
 As flow decreases in a decelerating pattern (C) the slope of the inspiratory volume curve
decreases (B).
44
 shows volume and flow during pressure control ventilation.
 Delivered volume (A) increases as inspiratory time (B) increases.
Pressure and Flow-Time Curves 45
 shows pressure and flow with a square flow pattern (A) and a descending ramp flow pattern
(B).
 Note the characteristic lower peak pressure and longer inspiration of a descending ramp
flow pattern.
46
 shows pressure and flow in a square flow wave mandatory breath (A) and
 A non-pressure supported, spontaneous breath (B).
47
 shows pressure and flow during SPONT ventilation.
 Inspiration and exhalation are plotted simultaneously for both pressure and flow.
48
 Negative deflection in the pressure tracing at the beginning of inspiration (A) indicates patient-initiated
breaths. Pressure increases to the target pressure support level above PEEP (B).
 Decelerating flow waveform represents the high initial flow rate (C) that decreases as the target pressure is
reached.
 Pressure support breath terminates when the inspiratory flow decreases to a set level or percentage of the
peak flow for that breath (D).
49
shows pressure and flow during pressure control ventilation.
 The two waveforms can be used together to adjust inspiratory pressure and inspiratory time.
 As inspiratory time is increased and plateau pressure is sustained (A), note the reduction in inspiratory
flow rate (B).
 A short inspiratory time may result in an inspiratory flow that does not reach zero (C).
 Increasing the inspiratory time can allow flow to reach zero (D), resulting in a larger delivered tidal volume
References
 Paul Ouellet, BA,RRT waveform and loop analysis in MV
 Guide to Understand Mechanical Ventilation Waveforms, Middle East
Critical Care Assembly 1/30/201
 2003 Nellcor Puritan Bennett
 Curves and Loops in Mechanical Ventilation Frank Rittner,Martin Döring
50
51

Mechanical ventilation wave forms

  • 1.
  • 2.
    Objectives  To discussmechanical ventilation waveforms  To discuss most commonly used waveforms  To discuss applications of most commonly used waveforms  To discuss combined waveforms 2
  • 3.
    Outline  Introduction  Pressurevs time curves  Volume vs time curves  Flow vs time curves  Combined curves 3
  • 4.
    Introduction  Waveforms aregraphical representations of data collected by the ventilator  Either integrated with changes in time as in  Pressure-Time,  Flow-Time or  Volume-Time curves) or  with one another as in  Pressure-Volume or  Flow-Volume loops)  Waveforms offer the user a “window” into what is happening to the patient in real-time in the form of pictures 4
  • 5.
    Contd.  Waveforms canhelp the clinician:  detect circuit and airway leaks,  estimate imposed ventilatory work, and  aid in assessing the efficacy of bronchodilator therapy.  Lung damage secondary to mechanical ventilation (barotraumas/volutrauma 5
  • 6.
    Contd.  The graphicdisplay of flow, pressure and volume is generally visualized in two formats:  Waveforms: a graphic display of a variable against time  Progression of the event always in one direction Lt to Rt  Loops : are graphic display of two variables against each other  Progression of the event always returns to its origin  Modes of ventilation directly affect flow, pressure and volume patterns  During MV generated breaths ,the inspiratory profile is affected by the mode of ventilation  The set inspiratory time can affect the duration of the expiratory profile as in I:E ratio 6
  • 7.
    Contd.  Most ventilatorscan operate as a volume controller or pressure controller  As a volume controller:  The ventilator can deliver a mechanical breath with a constant volume pattern  Only pressure varies according to the dynamic characteristic of the respiratory system  As a pressure controller:  The ventilator delivers mechanical ventilation with a constant pressure pattern  Both flow and volume vary according to the dynamic characteristic of the respiratory system. 7
  • 8.
  • 9.
  • 10.
    Most Commonly UsedWaveforms (Scalars)  Pressure vs. Time  Flow vs. Time  Volume vs. Time 10
  • 11.
    PRESSURE-TIME CURVES  graphicrepresentation of pressure changes over time 11
  • 12.
    APPLICATIONS OF PRESSURE-TIME CURVES Providesthese information: • Breath type delivered to the patient • Work required to trigger the breath • Breath timing (inspiration vs exhalation) • Pressure waveform shape • Adequacy of inspiration  Adequacy of inspiratory plateau • Adequacy of inspiratory flow • Adequacy of the Rise Time setting 12
  • 13.
    Identifying Breath Types 1.Ventilator-initiated mandatory breaths 13 With no flow-triggering applied, a pressure rise without a pressure deflection below baseline (A) indicates a ventilator-initiated breath
  • 14.
    2. Patient-Initiated MandatoryBreaths 14 A pressure deflection below baseline (A) just before a rise in pressure indicates a patient’s inspiratory effort resulting in a delivered breath
  • 15.
    3. Spontaneous Breaths15 Spontaneous breaths (without Pressure Support) are represented by comparatively smaller changes in pressure as the patient breathes above and below the baseline . Pressure below the baseline represents inspiration (A) and pressure above the baseline represents exhalation (B).
  • 16.
    4. Pressure Supportbreaths 16 Breaths that rise to a plateau and display varying inspiratory times indicate pressure supported breaths
  • 17.
    5. Pressure Controlbreaths 17 breaths that rise to a plateau and display constant inspiratory times, indicating pressure controlled breaths.
  • 18.
    Assessing the Workto Trigger a Breath 18 depth of the pressure deflection below the baseline (PT) and the time the pressure remains below the baseline (DTOT) indicates the patient’s effort to trigger a breath. Larger trigger pressures (PT) and/or longer trigger delay times (DT) may also indicate an inadequate trigger sensitivity setting on the ventilator or a slow response time by the ventilator itself.
  • 19.
    Evaluating Respiratory Events19 A to B indicates the inspiratory time; B to C indicates the expiratory time. If the pressure during exhalation does not return to baseline before the next inspiration is delivered (D), the expiratory time may not be adequate.
  • 20.
    Adjusting Peak FlowRate 20 during volume ventilation, the rate of rise in pressure is related to the peak flow setting. A lag or delay (A) in achieving the peak pressure could indicate an inadequate flow setting. A very fast rise to pressure (B), often accompanied by an increased peak pressure, could indicate an inappropriately high flow setting.
  • 21.
    Assessing Rise Time21 Ideal waveform for patients receiving pressure ventilation is roughly square in shape(B) with a rapid rise to target pressure, target pressure is reached early in the inspiratory phase and remains at the target pressure for the duration of the inspiratory time. may help satisfy the patient’s flow demand while contributing to a higher mean airway pressure If compliance or flow demand is high, the rise to pressure may be too slow, target pressure is achieved late (A) decreasing MAP. Rise time that is too fast could result in delivered pressure exceeding the set target pressure and potentially exposing the patient to higher-than-acceptable pressures (C).
  • 22.
    Assessing Auto-PEEP Maneuver22  An expiratory pause allows pressure in the lungs to equilibrate with pressure in the circuit, which is measured as Total PEEP (PEEPTOT).  subtracting the set PEEP,the difference is considered Auto-PEEP. (A) represents the point of equilibration and also the minimum adequate time for the expiratory pause.  A shorter pause time would not allow complete pressure equilibration, resulting in a potential underreporting of the PEEPTOTand therefore an underestimation of the patient’s Auto-PEEP.
  • 23.
    Flow vs timecurve=volume of gas moved or displaced in a specific time period period 23  Peak inspiratory flow is the highest flow rate achieved during inspiration (D).  Peak expiratory flow rate is the highest flow rate achieved during exhalation (E)  Flow shown above the zero flow line is inspiratory flow and flow shown below the zero flow line is expiratory flow.  Inspiratory time is measured from the beginning of inspiration to the beginning of exhalation (A to B). Expiratory time is measured from the beginning of exhalation to the beginning of the next inspiration (B to C).
  • 24.
    Applications of FLOW-TIMECURVES  The flow-time curve can be used to detect: • Waveform shape • Type of breathing • Presence of Auto-PEEP (Intrinsic PEEP) • Patient’s response to bronchodilators • Adequacy of inspiratory time in pressure control ventilation • Presence and rate of continuous air leaks 24
  • 25.
    Verifying Flow WaveformShapes 25 In volume control ventilation, the ventilator can be set to deliver flow in: • A square wave pattern, where the peak flow rate is set and the flow is constant through the inspiratory phase. can produce higher peak pressure • A descending ramp flow wave, where the set peak flow is delivered at the beginning of the breath and decreases in a linear fashion until the volume is delivered. can produce lower peak pressures but can increase the inspiratory time significantly. A sinewaveform, where the inspiratory flow gradually increases and then decreases back to zero. This method of delivering flow may cause patient discomfort
  • 26.
    Detecting the Typeof Breathing 26 Square and descending ramp flow patterns are characteristic of volume control mandatory breaths with the volume, flow rate and flow waveform set by the clinician. Decelerating flow waveform characteristic of pressure ventilation may actually display a flow of zero at the end of inspiration, in Pressure Control, if the inspiratory time is set long enough. Spontaneous breaths without pressure support results in sine-like Inspiratory flow pattern with a lower peak flow rate. Pressure support breaths will be represented by a decelerating flow waveform w/c doen’t return to zero at the end of inspiration
  • 27.
    Determining the Presenceof Auto-PEEP 27 Auto-PEEP, or Intrinsic PEEP (PEEPI) refers to the presence of positive pressure in the lungs at the end of exhalation (air trapping).  Indicated by an expiratory flow that doesn’t return to zero before the next inspiration begins(A).  Is most often the result of insufficient expiratory time.  A higher end-expiratory flow generally corresponds to a higher level of Auto-PEEP (B).  A lower end-expiratory flow generally corresponds to a lower level of Auto-PEEP (C).
  • 28.
    Missed Inspiratory EffortsDue to Auto-PEEP = Patient inspiratory efforts that did not trigger a breath. 28 This occurs when the patient has not been able to finish exhaling when an inspiratory effort is made (A)  To trigger a breath, the patient must inspire through the Auto-PEEP and meet the set trigger threshold to trigger the ventilator.  Patients with weak inspiratory efforts are often unable to trigger breaths when significant Auto-PEEP is present
  • 29.
    Evaluating Bronchodilator Response29 Compare the peak expiratory flow rates (A) and the time to reach zero flow (B).  The post-bronchodilator curve shows an increased peak expiratory flow rate and a reduced time to reach zero flow, potentially indicating improvement following bronchodilator therapy.  This improvement in expiratory air flow may also be seen after the patient is suctioned
  • 30.
    Evaluating Inspiratory TimeSetting in Pressure Control 30  Shorter inspiratory times may terminate inspiration before the inspiratory flow reaches zero (A).  Increasing the inspiratory time so the inspiratory flow reaches zero before transitioning into exhalation (B) can result in the delivery of larger tidal volumes without increasing the pressure.  Further increasing the inspiratory time beyond the zero flow point will generally not deliver any additional tidal volume but results in a pressure plateau (C)
  • 31.
    VOLUME-TIME CURVES 31 The upslope (A) indicates inspiratory volume while the downslope (B) indicates expiratory volume.  Inspiratory time (I Time) is measured from the beginning of inspiration to the beginning of exhalation.  Expiratory time (E Time) is measured from the beginning of exhalation to the beginning of inspiration.
  • 32.
    Applications  The volume-timecurves may be used to detect: • Air trapping • Leaks in the patient circuit 32
  • 33.
    Detecting Air Trappingor Leaks 33 shows exhalations that do not return to zero (A). Volume in and volume out are not always equal.  Air leaks or air trapping often result in an expiratory volume that is lower than the inspired volume.  The plateau displayed during exhalation (A) is the expired volume until the start of the next inspiration.
  • 34.
    COMBINED CURVES  Manyconditions can be identified by viewing two curves simultaneously.  Examples of combined pressure, flow and volume time curves in in different ventilatory modalities:  Assist Control (A/C or CMV)  Synchronized Intermittent Mandatory Ventilation (SIMV)  Spontaneous (SPONT or CPAP)  Pressure Support  Pressure Control 34
  • 35.
    Pressure and Volume-TimeCurves 35 volume and pressure rise simultaneously. A patient-initiated breath is indicated by a slight negative deflection in pressure (A).
  • 36.
    36  The smallpressure fluctuations and concurrent volume changes indicate spontaneous breathing (A).  Negative pressure deflections just before a pressure rise indicate a patient-initiated breath(B)
  • 37.
    37  The smallfluctuations in pressure and volumes (A and B) indicate spontaneous breathing.  The variability in volume from breath to breath is characteristic of spontaneous breathing.
  • 38.
    38 Note the changesin volume (A) that correspond to changes in the patient’s inspiratory time and inspiratory effort.
  • 39.
    39  The characteristicplateau on the volume curve (A) appears as the target pressure is maintained for the set inspiratory time.  This is because inspiratory flow has reached zero at this point in the inspiratory time.
  • 40.
    Volume and Flow-TimeCurves 40  shows volume and flow during A/C ventilation with a square wave.  Inspired volume corresponds to inspiratory flow (A);  Exhaled volume corresponds to expiratory flow (B).
  • 41.
    41  shows volumeand flow during SIMV with a square wave.  The figure also shows the differences in volume and flow waveform between mandatory and spontaneous breaths
  • 42.
    42  shows volumeand flow during spontaneous breathing.  The sine-like flow waveform and reduced volume are characteristic of spontaneous breathing.  Inspiration (A) and exhalation (B) are plotted simultaneously for both volume and flow.
  • 43.
    43  shows volumeand flow during pressure support ventilation.  The slope of the volume curve may be very steep during the early part of inspiration (A).  As flow decreases in a decelerating pattern (C) the slope of the inspiratory volume curve decreases (B).
  • 44.
    44  shows volumeand flow during pressure control ventilation.  Delivered volume (A) increases as inspiratory time (B) increases.
  • 45.
    Pressure and Flow-TimeCurves 45  shows pressure and flow with a square flow pattern (A) and a descending ramp flow pattern (B).  Note the characteristic lower peak pressure and longer inspiration of a descending ramp flow pattern.
  • 46.
    46  shows pressureand flow in a square flow wave mandatory breath (A) and  A non-pressure supported, spontaneous breath (B).
  • 47.
    47  shows pressureand flow during SPONT ventilation.  Inspiration and exhalation are plotted simultaneously for both pressure and flow.
  • 48.
    48  Negative deflectionin the pressure tracing at the beginning of inspiration (A) indicates patient-initiated breaths. Pressure increases to the target pressure support level above PEEP (B).  Decelerating flow waveform represents the high initial flow rate (C) that decreases as the target pressure is reached.  Pressure support breath terminates when the inspiratory flow decreases to a set level or percentage of the peak flow for that breath (D).
  • 49.
    49 shows pressure andflow during pressure control ventilation.  The two waveforms can be used together to adjust inspiratory pressure and inspiratory time.  As inspiratory time is increased and plateau pressure is sustained (A), note the reduction in inspiratory flow rate (B).  A short inspiratory time may result in an inspiratory flow that does not reach zero (C).  Increasing the inspiratory time can allow flow to reach zero (D), resulting in a larger delivered tidal volume
  • 50.
    References  Paul Ouellet,BA,RRT waveform and loop analysis in MV  Guide to Understand Mechanical Ventilation Waveforms, Middle East Critical Care Assembly 1/30/201  2003 Nellcor Puritan Bennett  Curves and Loops in Mechanical Ventilation Frank Rittner,Martin Döring 50
  • 51.