Downloaded 1,106 times
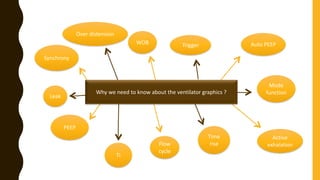
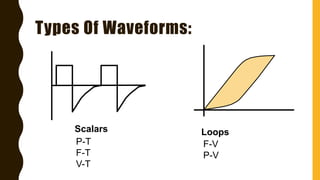
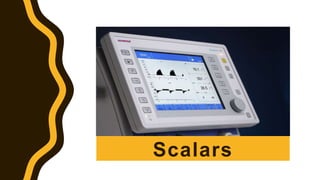
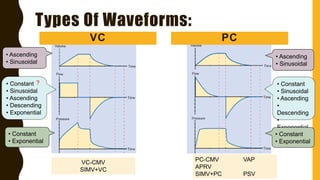
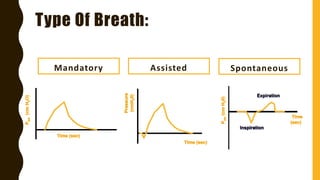
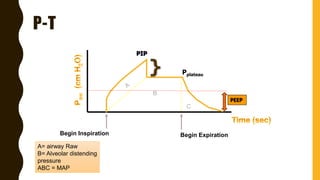
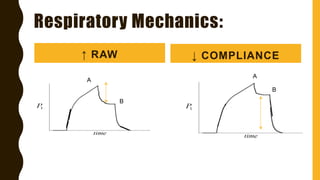
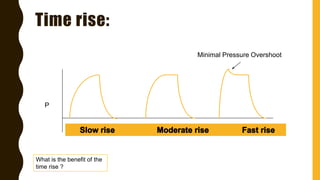
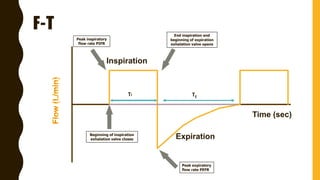
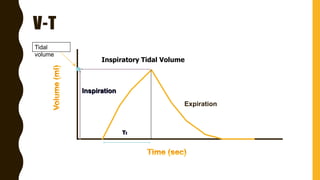
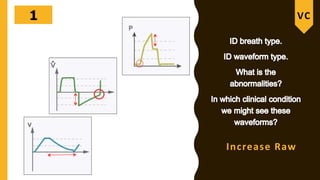
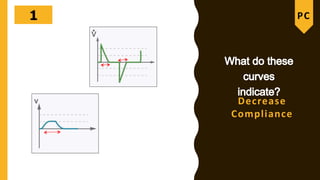
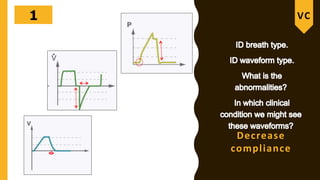
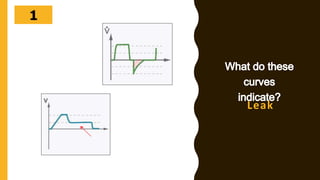
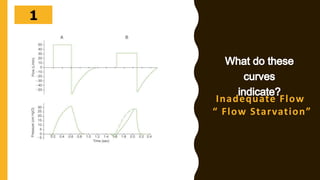
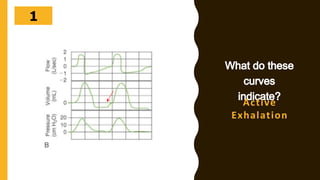

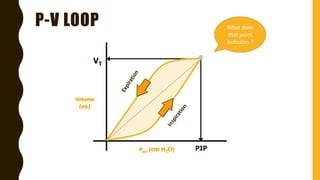
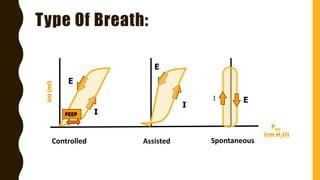
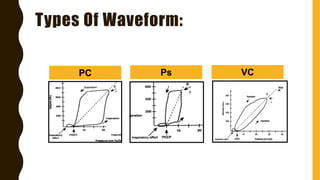
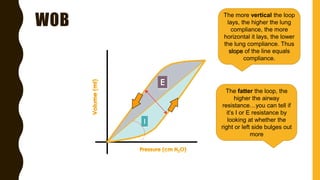
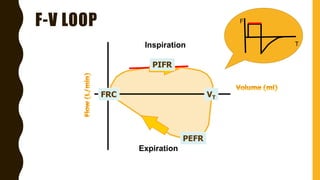
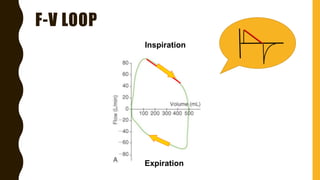

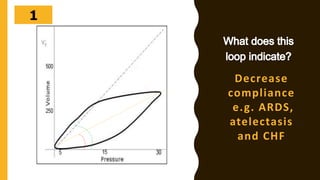
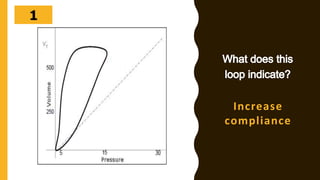
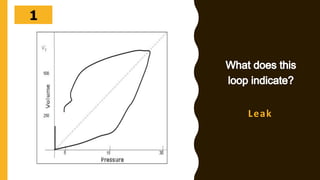
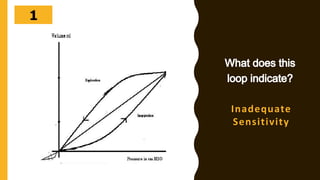
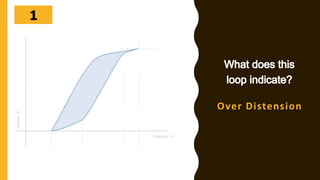
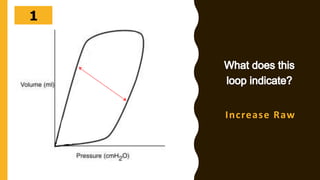
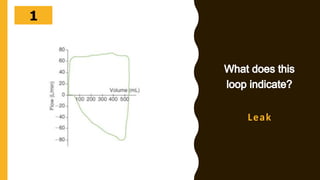
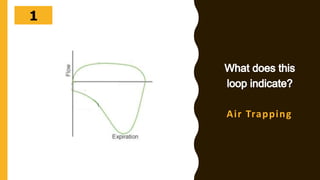
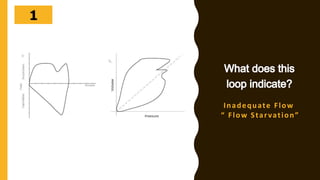
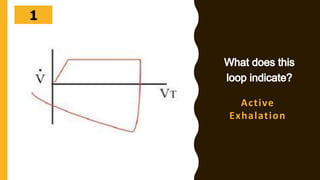
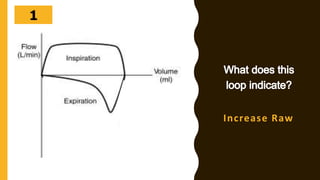
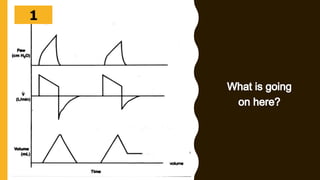


The document discusses the importance of analyzing ventilator graphics to assess patient ventilation and detect problems. It describes common waveform types including scalars, loops, and graphs of pressure, flow, tidal volume. Normal and abnormal waveforms are shown, such as those indicating decreased compliance, increased resistance, leaks, or overdistension. Different breath types, including mandatory, assisted and spontaneous breathing are also outlined. Overall ventilator graphics provide a critical tool for managing mechanically ventilated patients.


![Hypothalamus short notes on location, function and disorders by Dr. Neha [PT]...](https://cdn.slidesharecdn.com/ss_thumbnails/hypothalamusbydr-260124142231-2b48143d-thumbnail.jpg?width=640&height=640&fit=bounds)


