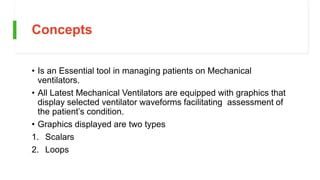
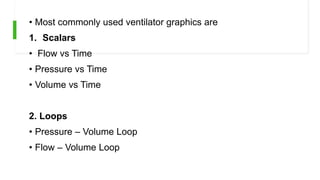
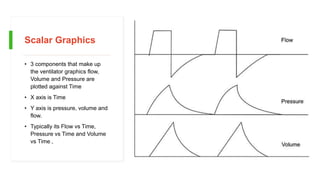

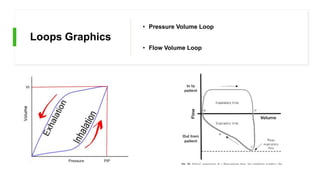


1) Ventilator graphics display waveforms that facilitate assessment of a patient's condition on mechanical ventilation. The most commonly used graphics are scalars (flow vs time, pressure vs time, volume vs time) and loops (pressure-volume, flow-volume). 2) Scalar graphics show the relationship between flow, volume, or pressure over time. Loops show the relationship between pressure and volume or flow and volume. These graphics provide information about ventilator settings, lung mechanics, and the identification of common issues like airway obstruction or air trapping. 3) Proper analysis of ventilator graphics is essential for optimizing ventilator settings and recognizing abnormalities that may require intervention to improve a patient's ventilation


