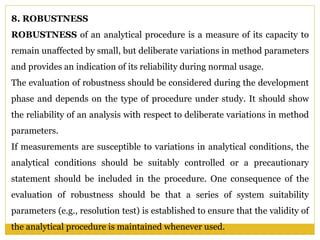
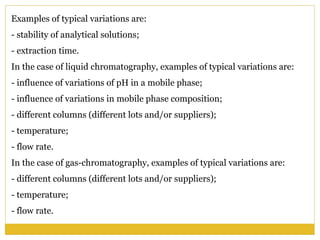
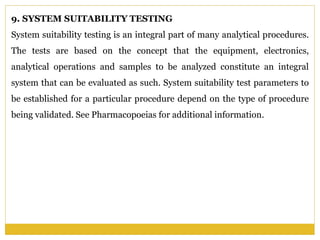
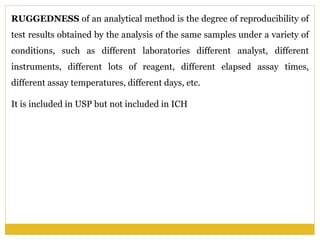
This document discusses the key aspects of analytical method validation including specificity, linearity, range, accuracy, precision, detection limit, quantitation limit, robustness, and system suitability testing. It provides detailed descriptions and recommendations for establishing each validation characteristic to demonstrate that an analytical procedure is suitable for its intended use.
Analytical method validation as per ich and usp shreyas B R
Analytical method validation is a process of documenting/ proving that an analytical method provides analytical data acceptable for the intended use.After the development of an analytical procedure, it is must important to assure that the procedure will consistently produce the intended a precise result with high degree of accuracy. The method should give a specific result that may not be affected by external matters. This creates a requirement to validate the analytical procedures. The validation procedures consists of some characteristics parameters that makes the method acceptable with addition of statistical tools.
QUALIFICATION OF UV-VISIBLE SPECTROPHOTOMETER, FTIR, DSC, HPLCAnupriyaNR
Analytical method qualification consists of a simplified evaluation of a subset of validation characteristics with a goal to demonstrate that an analytical method is scientifically sound and suitable for its intended use. In contrast to validation, analytical method qualification is performed without predefined acceptability criteria. Qualification may be performed as a prerequisite to method validation, or when an assay for product knowledge has not yet been established as a test for a critical product quality attribute. Qualification of equipment is pre-requisite for validation of the process in which the equipment is being used. Many types of equipment have measuring devices on them. Calibration of measuring devices is a part of qualification. Calibration of measuring devices is important, as the data is often collected through them. If the data collected is not from measuring devices that have been calibrated, the data cannot be relied upon. Thus the whole validation exercise can be questioned.
The drug or drug combination may not be official in any pharmacopoeias.
A proper analytical procedure for the drug may not be available in the literature due to patent regulations.
Analytical methods may not be available for the drug in the form of a formulation due to the interference caused by the formulation excipients.
Analytical methods for the quantitation of the drug in biological fluids may not be available.
Analytical methods for a drug in combination with other drugs may not be available.
The existing analytical procedures may require expensive reagents and solvents. It may also involve cumbersome extraction and separation procedures and these may not be reliable.
Analytical method development and validation for simultaneous estimationProfessor Beubenz
Brief about analytical method development and validation
Subscribe to the YouTube Channel #Professor_Beubenz
https://www.youtube.com/channel/UC84jGf2iRN5VjwnQqi6qmXg?view_as=subscriber
The objective of any chemical analytical measurement is to get consistent, reliable and accurate data.
Proper functioning and performance of analytical instruments and computer systems plays a major role in achieving this goal.
Therefore, analytical instrument qualification (AIQ) and calibration should be part of any good analytical practice.
Reference standards in Pharmaceutical Industriesbhavanavedantam
This presentation is brief introduction about reference standards that are using in pharmaceutical industries for calibration of different instruments, methods and pharmaceutical chemicals...
Analytical method development and validation are one of the very imp aspects in Drug testing and approval process.Here I tried to explain the same with my experience.
Understanding of Analytical Method Validation Approach in Pharmaceutical Industry. Analytical method validation Verification is a wide chapter and a huge scope of applicability. In different types of methods, instrument, measurement approach all can effect the validation effort. However the basic fundamental will remains same, the parameters, acceptance criteria, functionality may vary depending upon the type of method, instrument etc.
Analytical Method Validation is a process that is used to demonstrate the suitability of an analytical method for an intended purpose.Regulations and quality standards that have an impact on analytical laboratories require analytical methods to be validated.
Method validation is the process of documenting / proving that an analytical method provides analytical data acceptable for the intended use. A pharmaceutical drug product must meet all its specifications throughout its entire shelf-life. The performance of product characteristics throughout the shelf-life must be tested by analytical method for the product’s chemical, physiochemical, microbiological and biological characteristics. The method of analysis used must be validated. This is required to ensure the product’s safety and efficacy throughout all phases of its shelf-life. Validation is the process of establishing documentary evidence demonstrating that a procedure, process, or activity carried out in testing and then production maintains the desired level of compliance at all stages.
General Principles of Analytical Method of Validation.pdfTamannaKumari8
Validation is the process of establishing documentary evidence demonstrating that a procedure, process, activity carried out in
testing and then production maintain the desirable level of compliance all stages.
The process of providing the analytical procedure is acceptable or its intended us.(ICH Q
Cancer cell metabolism: special Reference to Lactate PathwayAADYARAJPANDEY1
Normal Cell Metabolism:
Cellular respiration describes the series of steps that cells use to break down sugar and other chemicals to get the energy we need to function.
Energy is stored in the bonds of glucose and when glucose is broken down, much of that energy is released.
Cell utilize energy in the form of ATP.
The first step of respiration is called glycolysis. In a series of steps, glycolysis breaks glucose into two smaller molecules - a chemical called pyruvate. A small amount of ATP is formed during this process.
Most healthy cells continue the breakdown in a second process, called the Kreb's cycle. The Kreb's cycle allows cells to “burn” the pyruvates made in glycolysis to get more ATP.
The last step in the breakdown of glucose is called oxidative phosphorylation (Ox-Phos).
It takes place in specialized cell structures called mitochondria. This process produces a large amount of ATP. Importantly, cells need oxygen to complete oxidative phosphorylation.
If a cell completes only glycolysis, only 2 molecules of ATP are made per glucose. However, if the cell completes the entire respiration process (glycolysis - Kreb's - oxidative phosphorylation), about 36 molecules of ATP are created, giving it much more energy to use.
IN CANCER CELL:
Unlike healthy cells that "burn" the entire molecule of sugar to capture a large amount of energy as ATP, cancer cells are wasteful.
Cancer cells only partially break down sugar molecules. They overuse the first step of respiration, glycolysis. They frequently do not complete the second step, oxidative phosphorylation.
This results in only 2 molecules of ATP per each glucose molecule instead of the 36 or so ATPs healthy cells gain. As a result, cancer cells need to use a lot more sugar molecules to get enough energy to survive.
introduction to WARBERG PHENOMENA:
WARBURG EFFECT Usually, cancer cells are highly glycolytic (glucose addiction) and take up more glucose than do normal cells from outside.
Otto Heinrich Warburg (; 8 October 1883 – 1 August 1970) In 1931 was awarded the Nobel Prize in Physiology for his "discovery of the nature and mode of action of the respiratory enzyme.
WARNBURG EFFECT : cancer cells under aerobic (well-oxygenated) conditions to metabolize glucose to lactate (aerobic glycolysis) is known as the Warburg effect. Warburg made the observation that tumor slices consume glucose and secrete lactate at a higher rate than normal tissues.
Observation of Io’s Resurfacing via Plume Deposition Using Ground-based Adapt...Sérgio Sacani
Since volcanic activity was first discovered on Io from Voyager images in 1979, changes
on Io’s surface have been monitored from both spacecraft and ground-based telescopes.
Here, we present the highest spatial resolution images of Io ever obtained from a groundbased telescope. These images, acquired by the SHARK-VIS instrument on the Large
Binocular Telescope, show evidence of a major resurfacing event on Io’s trailing hemisphere. When compared to the most recent spacecraft images, the SHARK-VIS images
show that a plume deposit from a powerful eruption at Pillan Patera has covered part
of the long-lived Pele plume deposit. Although this type of resurfacing event may be common on Io, few have been detected due to the rarity of spacecraft visits and the previously low spatial resolution available from Earth-based telescopes. The SHARK-VIS instrument ushers in a new era of high resolution imaging of Io’s surface using adaptive
optics at visible wavelengths.
The increased availability of biomedical data, particularly in the public domain, offers the opportunity to better understand human health and to develop effective therapeutics for a wide range of unmet medical needs. However, data scientists remain stymied by the fact that data remain hard to find and to productively reuse because data and their metadata i) are wholly inaccessible, ii) are in non-standard or incompatible representations, iii) do not conform to community standards, and iv) have unclear or highly restricted terms and conditions that preclude legitimate reuse. These limitations require a rethink on data can be made machine and AI-ready - the key motivation behind the FAIR Guiding Principles. Concurrently, while recent efforts have explored the use of deep learning to fuse disparate data into predictive models for a wide range of biomedical applications, these models often fail even when the correct answer is already known, and fail to explain individual predictions in terms that data scientists can appreciate. These limitations suggest that new methods to produce practical artificial intelligence are still needed.
In this talk, I will discuss our work in (1) building an integrative knowledge infrastructure to prepare FAIR and "AI-ready" data and services along with (2) neurosymbolic AI methods to improve the quality of predictions and to generate plausible explanations. Attention is given to standards, platforms, and methods to wrangle knowledge into simple, but effective semantic and latent representations, and to make these available into standards-compliant and discoverable interfaces that can be used in model building, validation, and explanation. Our work, and those of others in the field, creates a baseline for building trustworthy and easy to deploy AI models in biomedicine.
Bio
Dr. Michel Dumontier is the Distinguished Professor of Data Science at Maastricht University, founder and executive director of the Institute of Data Science, and co-founder of the FAIR (Findable, Accessible, Interoperable and Reusable) data principles. His research explores socio-technological approaches for responsible discovery science, which includes collaborative multi-modal knowledge graphs, privacy-preserving distributed data mining, and AI methods for drug discovery and personalized medicine. His work is supported through the Dutch National Research Agenda, the Netherlands Organisation for Scientific Research, Horizon Europe, the European Open Science Cloud, the US National Institutes of Health, and a Marie-Curie Innovative Training Network. He is the editor-in-chief for the journal Data Science and is internationally recognized for his contributions in bioinformatics, biomedical informatics, and semantic technologies including ontologies and linked data.
Professional air quality monitoring systems provide immediate, on-site data for analysis, compliance, and decision-making.
Monitor common gases, weather parameters, particulates.
This pdf is about the Schizophrenia.
For more details visit on YouTube; @SELF-EXPLANATORY;
https://www.youtube.com/channel/UCAiarMZDNhe1A3Rnpr_WkzA/videos
Thanks...!
A brief information about the SCOP protein database used in bioinformatics.
The Structural Classification of Proteins (SCOP) database is a comprehensive and authoritative resource for the structural and evolutionary relationships of proteins. It provides a detailed and curated classification of protein structures, grouping them into families, superfamilies, and folds based on their structural and sequence similarities.
Nutraceutical market, scope and growth: Herbal drug technologyLokesh Patil
As consumer awareness of health and wellness rises, the nutraceutical market—which includes goods like functional meals, drinks, and dietary supplements that provide health advantages beyond basic nutrition—is growing significantly. As healthcare expenses rise, the population ages, and people want natural and preventative health solutions more and more, this industry is increasing quickly. Further driving market expansion are product formulation innovations and the use of cutting-edge technology for customized nutrition. With its worldwide reach, the nutraceutical industry is expected to keep growing and provide significant chances for research and investment in a number of categories, including vitamins, minerals, probiotics, and herbal supplements.
Richard's entangled aventures in wonderlandRichard Gill
Since the loophole-free Bell experiments of 2020 and the Nobel prizes in physics of 2022, critics of Bell's work have retreated to the fortress of super-determinism. Now, super-determinism is a derogatory word - it just means "determinism". Palmer, Hance and Hossenfelder argue that quantum mechanics and determinism are not incompatible, using a sophisticated mathematical construction based on a subtle thinning of allowed states and measurements in quantum mechanics, such that what is left appears to make Bell's argument fail, without altering the empirical predictions of quantum mechanics. I think however that it is a smoke screen, and the slogan "lost in math" comes to my mind. I will discuss some other recent disproofs of Bell's theorem using the language of causality based on causal graphs. Causal thinking is also central to law and justice. I will mention surprising connections to my work on serial killer nurse cases, in particular the Dutch case of Lucia de Berk and the current UK case of Lucy Letby.
2. Validation is defined as the process of establishing a
documented evidence that a specific process will consistently
produce a product meeting its predetermined specifications
and quality attributes.
The analytical procedure refers to the way of performing
the analysis. It should describe in detail the steps necessary to
perform each analytical test. This may include but is not
limited to the sample, the reference standard and the reagents
preparations, use of the apparatus, generation of the
calibration curve, use of the formulae for the calculation etc.
3. 1. SPECIFICITY
SPECIFICITY is the ability to assess unequivocally the analyte in
presence of components which may be expected to be present.
An investigation of specificity should be conducted during the validation of
identification tests, the determination of impurities and the assay. The
procedures used to demonstrate specificity will depend on the intended
objective of the analytical procedure.
1.1. Identification
Suitable identification tests should be able to discriminate between
compounds of closely related structures which are likely to be present. The
discrimination of a procedure may be confirmed by obtaining positive
results (perhaps by comparison with a known reference material) from
samples containing the analyte, coupled with negative results from samples
which do not contain the analyte
4. In addition, the identification test may be applied to materials structurally
similar to or closely related to the analyte to confirm that a positive
response is not obtained. The choice of such potentially interfering
materials should be based on sound scientific judgement with a
consideration of the interferences that could occur.
1.2. Assay and Impurity Test(s)
For chromatographic procedures, representative chromatograms should be
used to demonstrate specificity and individual components should be
appropriately labelled. Similar considerations should be given to other
separation techniques.
Critical separations in chromatography should be investigated at an
appropriate level. For critical separations, specificity can be demonstrated
by the resolution of the two components which elute closest to each other.
5. In cases where a non-specific assay is used, other supporting analytical
procedures should be used to demonstrate overall specificity. For example,
where a titration is adopted to assay the drug substance for release, the
combination of the assay and a suitable test for impurities can be used.
The approach is similar for both assay and impurity tests:
1.2.1 Impurities are available
For the assay , this should involve demonstration of the discrimination of
the analyte in the presence of impurities and/or excipients; practically, this
can be done by spiking pure substances (drug substance or drug product)
with appropriate levels of impurities and/or excipients and demonstrating
that the assay result is unaffected by the presence of these materials (by
comparison with the assay result obtained on unspiked samples).
6. 1.2.2 Impurities are not available
If impurity or degradation product standards are unavailable, specificity
may be demonstrated by comparing the test results of samples containing
impurities or degradation products to a second well-characterized
procedure e.g.: pharmacopoeial method or other validated analytical
procedure (independent procedure). As appropriate, this should include
samples stored under relevant stress conditions: light, heat, humidity,
acid/base hydrolysis and oxidation.
-for the assay, the two results should be compared;
- for the impurity tests, the impurity profiles should be compared.
- Peak purity tests may be useful to show that the analyte chromatographic
peak is not attributable to more than one component (e.g., diode array,
mass spectrometry).
7. 2. LINEARITY
LINEARITY of an analytical procedure is its ability (within a given range)
to obtain test results which are directly proportional to the concentration
(amount) of analyte in the sample.
A linear relationship should be evaluated across the range (see section 3) of
the analytical procedure. It may be demonstrated directly on the drug
substance (by dilution of a standard stock solution) and/or separate
weighings of synthetic mixtures of the drug product components, using the
proposed procedure. The latter aspect can be studied during investigation
of the range.
Linearity should be evaluated by visual inspection of a plot of signals as a
function of analyte concentration or content.
8. If there is a linear relationship, test results should be
evaluated by appropriate statistical methods, for example, by
calculation of a regression line by the method of least squares.
The correlation coefficient, y-intercept, slope of the
regression line and residual sum of squares should be
submitted. A plot of the data should be included. In addition,
an analysis of the deviation of the actual data points from the
regression line may also be helpful for evaluating linearity.
For the establishment of linearity, a minimum of 5
concentrations is recommended. Other approaches should be
justified.
9. 3. RANGE
RANGE of an analytical procedure is the interval between the upper and
lower concentration (amounts) of analyte in the sample (including these
concentrations) for which it has been demonstrated that the analytical
procedure has a suitable level of precision, accuracy and linearity
The specified range is normally derived from linearity studies and depends
on the intended application of the procedure. It is established by
confirming that the analytical procedure provides an acceptable degree of
linearity, accuracy and precision when applied to samples containing
amounts of analyte within or at the extremes of the specified range of the
analytical procedure.
10. The following minimum specified ranges should be considered:
- for the assay of a drug substance or a finished (drug) product: normally
from 80 to 120 percent of the test concentration;
- for content uniformity, covering a minimum of 70 to 130 percent of the
test concentration, unless a wider more appropriate range, based on the
nature of the dosage form (e.g., metered dose inhalers), is justified;
- for dissolution testing: +/-20 % over the specified range;
11. 4. ACCURACY
ACCURACY of an analytical method is the closeness of test results
obtained by that method to the true value.
Accuracy should be established across the specified range of the analytical
procedure.
4.1. Assay
4.1.1 Drug Substance
Several methods of determining accuracy are available:
a) application of an analytical procedure to an analyte of known purity
b) comparison of the results of the proposed analytical procedure with
those of a second well-characterized procedure, the accuracy of which is
stated and/or defined
c) accuracy may be inferred once precision, linearity and specificity have
been established.
12. 4.1.2 Drug Product
Several methods for determining accuracy are available:
a) application of the analytical procedure to synthetic mixtures of the drug
product components to which known quantities of the drug substance to be
analysed have been added;
b) in cases where it is impossible to obtain samples of all drug product
components , it may be acceptable either to add known quantities of the
analyte to the drug product or to compare the results obtained from a
second, well characterized procedure, the accuracy of which is stated
and/or defined
c) accuracy may be inferred once precision, linearity and specificity have
been established.
13. 4.2. Impurities (Quantitation)
Accuracy should be assessed on samples (drug substance/drug product)
spiked with known amounts of impurities.
In cases where it is impossible to obtain samples of certain impurities
and/or degradation products, it is considered acceptable to compare results
obtained by an independent procedure. The response factor of the drug
substance can be used.
It should be clear how the individual or total impurities are to be
determined e.g., weight/weight or area percent, in all cases with respect to
the major analyte.
14. 4.3. Recommended Data
Accuracy should be assessed using a minimum of 9 determinations over a
minimum of 3 concentration levels covering the specified range (e.g., 3
concentrations/3 replicates each of the total analytical procedure).
Accuracy should be reported as percent recovery by the assay of known
added amount of analyte in the sample or as the difference between the
mean and the accepted true value together with the confidence intervals.
15. 5. PRECISION
PRECISION of an analytical method is the degree of agreement among
individual test results when the method is applied repeatedly to multiple
samplings of a homogenous sample.
Validation of tests for assay and for quantitative determination of
impurities includes an investigation of precision.
5.1. Repeatability It refers to the results of the method operating over a
short time interval under the same conditions.
Repeatability should be assessed using:
a) a minimum of 9 determinations covering the specified range for the
procedure (e.g., 3 concentrations/3 replicates each); or
b) a minimum of 6 determinations at 100% of the test concentration.
16. 5.2. Intermediate Precision
It refers to the results from within lab variations due to random events
such as differences in experimental periods, analysts, equipment.
The extent to which intermediate precision should be established
depends on the circumstances under which the procedure is intended to be
used. The applicant should establish the effects of random events on the
precision of the analytical procedure.
Typical variations to be studied include days, analysts, equipment, etc. It
is not considered necessary to study these effects individually. The use of an
experimental design (matrix) is encouraged.
17. 5.3. Reproducibility
It refers to the results of collaborative studies among laboratories.
Reproducibility is assessed by means of an inter-laboratory trial.
Reproducibility should be considered in case of the standardization of an
analytical procedure, for instance, for inclusion of procedures in
pharmacopoeias. These data are not part of the marketing authorization
dossier.
5.4. Recommended Data
The standard deviation, relative standard deviation (coefficient of
variation) and confidence interval should be reported for each type of
precision investigated.
18. 6. DETECTION LIMIT
DETECTION LIMIT of an individual analytical procedure is the lowest
amount of analyte in a sample which can be detected but not necessarily
quantitated, under the stated experimental conditions.
Several approaches for determining the detection limit are possible,
depending on whether the procedure is a non-instrumental or
instrumental. Approaches other than those listed below may be acceptable.
6.1. Based on Visual Evaluation
Visual evaluation may be used for non-instrumental methods but may also
be used with instrumental methods.
The detection limit is determined by the analysis of samples with known
concentrations of analyte and by establishing the minimum level at which
the analyte can be reliably detected.
19. 6.2. Based on Signal-to-Noise
This approach can only be applied to analytical procedures which exhibit
baseline noise.
Determination of the signal-to-noise ratio is performed by comparing
measured signals from samples with known low concentrations of analyte
with those of blank samples and establishing the minimum concentration
at which the analyte can be reliably detected. A signal-to-noise ratio
between 3 or 2:1 is generally considered acceptable for estimating the
detection limit.
20. 6.3 Based on the Standard Deviation of the Response and the
Slope
The detection limit (DL) may be expressed as: DL = 3.3 σ/ S
where σ = the standard deviation of the response
S = the slope of the calibration curve
The slope S may be estimated from the calibration curve of the analyte. The
estimate of σ may be carried out in a variety of ways, for example:
6.3.1 Based on the Standard Deviation of the Blank
Measurement of the magnitude of analytical background response is
performed by analyzing an appropriate number of blank samples and
calculating the standard deviation of these responses.
21. 6.3.2 Based on the Calibration Curve
A specific calibration curve should be studied using samples containing an
analyte in the range of DL. The residual standard deviation of a regression
line or the standard deviation of y-intercepts of regression lines may be
used as the standard deviation.
6.4 Recommended Data
The detection limit and the method used for determining the detection limit
should be presented. If DL is determined based on visual evaluation or
based on signal to noise ratio, the presentation of the relevant
chromatograms is considered acceptable for justification.
22. 7. QUANTITATION LIMIT
QUANTITATION LIMIT of an individual analytical procedure is the
lowest amount of analyte in a sample which can be quantitatively
determined with suitable precision and accuracy
Several approaches for determining the quantitation limit are possible,
depending on whether the procedure is a non-instrumental or
instrumental. Approaches other than those listed below may be acceptable.
7.1. Based on Visual Evaluation
Visual evaluation may be used for non-instrumental methods but may also
be used with instrumental methods.
The quantitation limit is generally determined by the analysis of samples
with known concentrations of analyte and by establishing the minimum
level at which the analyte can be quantified with acceptable accuracy and
precision.
23. 7.2. Based on Signal-to-Noise Approach
This approach can only be applied to analytical procedures that exhibit
baseline noise.
Determination of the signal-to-noise ratio is performed by comparing
measured signals from samples with known low concentrations of analyte
with those of blank samples and by establishing the minimum
concentration at which the analyte can be reliably quantified. A typical
signal-to-noise ratio is 10:1.
7.3. Based on the Standard Deviation of the Response and the
Slope
The quantitation limit (QL) may be expressed as: QL = 10 σ /S
where σ = the standard deviation of the response
S = the slope of the calibration curve
The slope S may be estimated from the calibration curve of the analyte.
24. The estimate of σ may be carried out in a variety of ways for example:
7.3.1 Based on Standard Deviation of the Blank
Measurement of the magnitude of analytical background response is
performed by analyzing an appropriate number of blank samples and
calculating the standard deviation of these responses.
7.3.2 Based on the Calibration Curve
A specific calibration curve should be studied using samples, containing an
analyte in the range of QL. The residual standard deviation of a regression
line or the standard deviation of y-intercepts of regression lines may be
used as the standard deviation.
7.4 Recommended Data
The QL and the method used for determining the QL should be presented.
The limit should be subsequently validated by the analysis of a suitable
number of samples known to be near or prepared at the quantitation limit.
25. 8. ROBUSTNESS
ROBUSTNESS of an analytical procedure is a measure of its capacity to
remain unaffected by small, but deliberate variations in method parameters
and provides an indication of its reliability during normal usage.
The evaluation of robustness should be considered during the development
phase and depends on the type of procedure under study. It should show
the reliability of an analysis with respect to deliberate variations in method
parameters.
If measurements are susceptible to variations in analytical conditions, the
analytical conditions should be suitably controlled or a precautionary
statement should be included in the procedure. One consequence of the
evaluation of robustness should be that a series of system suitability
parameters (e.g., resolution test) is established to ensure that the validity of
the analytical procedure is maintained whenever used.
26. Examples of typical variations are:
- stability of analytical solutions;
- extraction time.
In the case of liquid chromatography, examples of typical variations are:
- influence of variations of pH in a mobile phase;
- influence of variations in mobile phase composition;
- different columns (different lots and/or suppliers);
- temperature;
- flow rate.
In the case of gas-chromatography, examples of typical variations are:
- different columns (different lots and/or suppliers);
- temperature;
- flow rate.
27. 9. SYSTEM SUITABILITY TESTING
System suitability testing is an integral part of many analytical procedures.
The tests are based on the concept that the equipment, electronics,
analytical operations and samples to be analyzed constitute an integral
system that can be evaluated as such. System suitability test parameters to
be established for a particular procedure depend on the type of procedure
being validated. See Pharmacopoeias for additional information.
28. RUGGEDNESS of an analytical method is the degree of reproducibility of
test results obtained by the analysis of the same samples under a variety of
conditions, such as different laboratories different analyst, different
instruments, different lots of reagent, different elapsed assay times,
different assay temperatures, different days, etc.
It is included in USP but not included in ICH