Downloaded 402 times
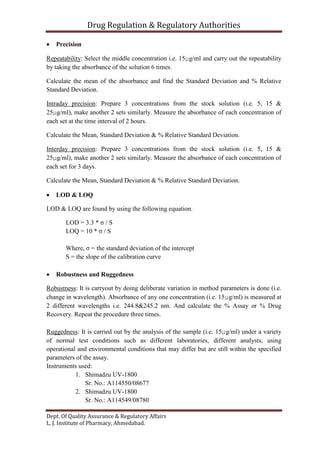
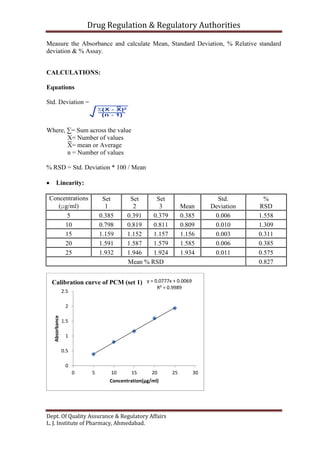
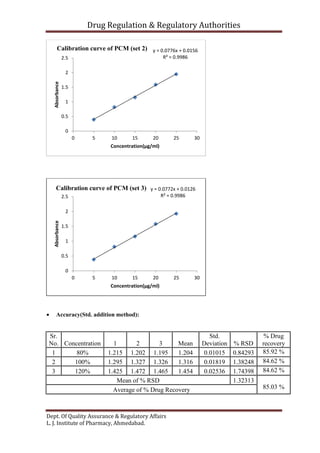
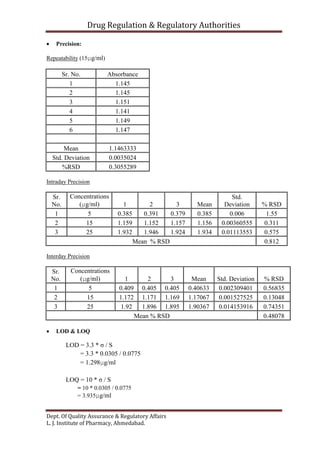
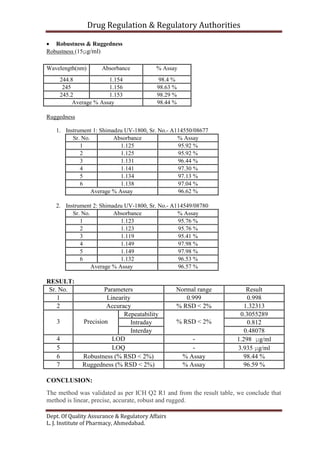

This document outlines the validation of an analytical method for the quantification of paracetamol using UV spectrophotometry. It describes the validation parameters that will be tested which include accuracy, precision, linearity, range, limit of detection and limit of quantification, selectivity and specificity, and robustness and ruggedness. The procedure involves preparing calibration standards of paracetamol to generate a linear curve and then testing the method's accuracy by spiking samples. Precision will be evaluated by repeatability, intraday, and interday testing. The document provides the theory and equations needed to calculate the validation parameters.


![PERI-PROSTHETIC FRACTURE NAIL-PLATE CONSTRUCT [NPC].pptx](https://cdn.slidesharecdn.com/ss_thumbnails/drarunkumardrmohamedashrafperiprostheticfrasturenail-plateconstructnpc-260209164459-7e9d15a1-thumbnail.jpg?width=640&height=640&fit=bounds)


![ONFH[AVN HIP] -TRIPLE REGIME -A NOVAL SURGICAL CONCEPT .pptx](https://cdn.slidesharecdn.com/ss_thumbnails/onfhavnhip2026koaconcalicutdrgokuldevdrmashraf-260210064517-213ec005-thumbnail.jpg?width=640&height=640&fit=bounds)


