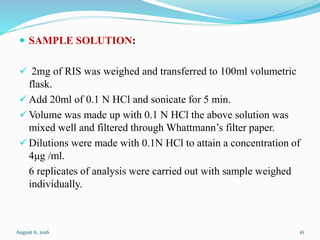
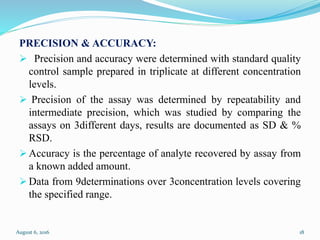
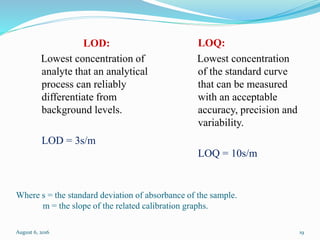
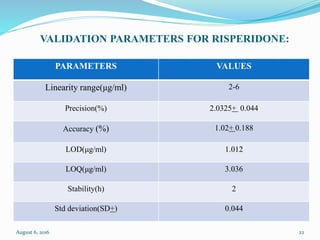
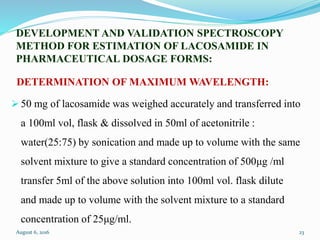
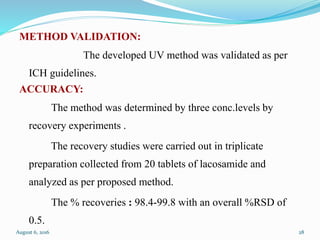
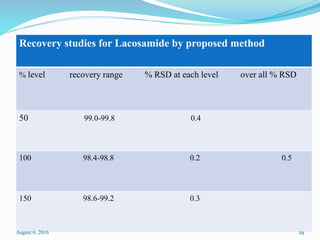
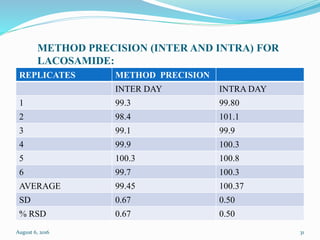
METHOD DEVELOPMENT, OPTIMIZATION AND
VALIDATION BY USING INSTRUMENT (UV-VISIBLE
SPECTRO PHOTOMETer)
PRESENTED BY:
T. LAKSHMI BHAVANI
(2015MPH40023)
Under the guidance of:
Dr. A. SRIDEVI
SPMVV - TIRUPATHI
Pharmaceutical Analysis-1st year
II-semester
1
M.Pharm .,Ph.D
August 6, 2016
CONTENTS:
 METHOD DEVELOPMENT
 OPTIMIZATION
 VALIDATION OF INSTRUMENTATION (PHARMACEUTICAL
DOSAGE FORMS,API,EXCIPIENTS)
 UV-VISIBLE SPECTROPHOTOMETER
 CONCLUSION
 REFERENCES
August 6, 2016 2
METHOD DEVELOPMENT
DEFINITION:
It is defined as a process of formulating the
materials, conditions and protocol for measuring the analyte.
August 6, 2016 3
STEPS INVOLVED IN UV SPECTROMETER
 SELECTION OF SOLVENT SYSTEM
 SELECTION OF ANALYTICAL WAVELENGTH.
 STUDY OF BEERS LAMBERT’S LAW
 TO PERFORM ANALYSIS OF STANDARD LABORATORY
MIXTURE & TABLET FORMULATIONS BY PROPOSED
METHOD.
 TO VALIDATE THE DEVELOPED METHODS BY USING
DIFFERENT VALIDATED PARAMETERS.
August 6, 2016 4
STUDY OF BEERS-LAMBERT’S LAW:
The assay of single component sample, which contains other
absorbing substances, is then calculated from the measured
absorbance by using one of three principle procedures.
They are, use of –
standard absorptive value,
calibration graph &
single or double point standardization.
August 6, 2016 5
1. IN STANDARD ABSORPTIVE VALUE METHOD
The use of standard A(1%,1cm) or E values are used in
order to determine its absorptivity.
2.IN CALIBRATION GRAPH METHOD
The absorbance’s of a number of standard solutions of
the reference substance at concentrations encompassing the
sample concentrations are measured and a calibration graph
is constructed.
August 6, 2016 6
3.The single point standardization:
Procedure involves the measurement of the absorbance of a
sample solution and of a standard solution of the reference
substance.
The concentration of the substances in the sample is
calculated from the proportional relationship that exists between
absorbance and concentration.
C test=(A test X C std)/A std
where,
C test and C std are the concentrations in the sample
and standard solutions respectively and A test and A std are the
absorbance’s of the sample and standard solutions respectively.
August 6, 2016 7
SELECTION OF ANALYTICAL WAVELENGTH:
Proper wavelength selection of the methods depends upon the
nature of the sample & its solubility.
To develop a rugged & suitable spectro photometric method
(UV), the analytical condition where selected after testing different
parameters such as diluents, buffer & buffer concentration.
Standard solution in UV spectrometer between 200 - 400nm
on spectrum mode, using diluents as a blank.
August 6, 2016 8
VALIDATION:
It is defined as establishing documented evidences
which provides a high degree assurance that a specific process
will consistently produce a product meeting its pre-determined
specification & quality characteristics.
August 6, 2016 9
VALIDATION PARAMETERS:
Accuracy
Precision
Limit of detection
Limit of quantitation
Specificity
Linearity
Range
Robustness
Ruggedness
August 6, 2016 10
ACCURACY:
The closeness of agreement between the value which is
accepted as a conventional true value or an expected
reference value , and the value found.
PRECISION:
It expresses the closeness of agreement between a series
of measurements obtained from the multiple sampling of the
homogenous sampling under the prescribed conditions.
Precision may be considered at 3 levels: repeatability,
intermediate precision, reproducability.
1.Repeatability : it expresses the precision under the same
operating conditions over a short interval of time.
August 6, 2016 11
2.Intermediate precision: It expresses with in laboratory variations :
different days, different analyst, different equipment
3.Reproducability: It expresses the precision between laboratories.
DETECTION LIMIT: It is the lowest amount of analyte in a sample
which can be detected but not quantitated as an exact value.
QUANTITATION LIMIT: It is the lowest amount of analyte in a
sample which can be quantitatively determined which suitable
accuracy and precision.
August 6, 2016 12
SPECIFICITY: It is the ability to acsses the analyte in the presence
of components which may be expected to be present.
It includes impurities, degradants, matrix etc.
This definition has following implications:
Identification: To ensure the identification of analyte
Purity test: To ensure an accurate content of impurities of an analyte
i.e. heavy metals, residual solvent content.
Assay: To provide an exact result this allows an accurate statement
on content or potency of analyte in the sample.
LINEARITY: Its ability(with in a given range) to obtain test results
which are directly proportional to the concentration(amount) of
analyte in the sample.
August 6, 2016 13
RANGE: It is the interval between upper and lower concentration
of analyte in the sample.
ROBUSTNESS: It is a measure of its capacity to remain
unaffected by small variations in method parameters and provides
an indication of its reliability during normal usage.
RUGGEDNESS: Reproducibility under normal but variable
laboratory conditions.
August 6, 2016 14
 DEVELOPMENT OF ANALYTICAL METHOD FOR
RISPERIDONE(API) BY UV-SPECTROPHOTOMETRY:
PREPARATION OF STOCK SOLUTION:
100mg of pure drug was weighed & transferred to 100ml
volumetric flask, add 50ml of 0.1N HCl and make up the
volume with 0.1 N HCl.
August 6, 2016 15
 SAMPLE SOLUTION:
 2mg of RIS was weighed and transferred to 100ml volumetric
flask.
 Add 20ml of 0.1 N HCl and sonicate for 5 min.
 Volume was made up with 0.1 N HCl the above solution was
mixed well and filtered through Whattmann’s filter paper.
 Dilutions were made with 0.1N HCl to attain a concentration of
4μg /ml.
6 replicates of analysis were carried out with sample weighed
individually.
August 6, 2016 16
VALIDATION PARAMETERS:
ACCURACY & PRECISION
LINEARITY
LOD & LOQ
STABILITY
CALIBRATION CURVE
August 6, 2016 17
PRECISION & ACCURACY:
 Precision and accuracy were determined with standard quality
control sample prepared in triplicate at different concentration
levels.
 Precision of the assay was determined by repeatability and
intermediate precision, which was studied by comparing the
assays on 3different days, results are documented as SD & %
RSD.
 Accuracy is the percentage of analyte recovered by assay from
a known added amount.
 Data from 9determinations over 3concentration levels covering
the specified range.
August 6, 2016 18
Where s = the standard deviation of absorbance of the sample.
m = the slope of the related calibration graphs.
LOD:
Lowest concentration of
analyte that an analytical
process can reliably
differentiate from
background levels.
LOD = 3s/m
LOQ:
Lowest concentration
of the standard curve
that can be measured
with an acceptable
accuracy, precision and
variability.
LOQ = 10s/m
August 6, 2016 19
LINEARITY:
 5 point calibration curve
were generated.
 evaluated by least square
regression method using un
weighed data.
STABILITY:
 The stability of
risperidone in 0.1 N
HCl solution was
studied by UV method.
 Sample solutions were
prepared in triplicate
and stored at 4 & 250 C
for 30,60,90 & 120
min.
August 6, 2016 20
RECOVERY STUDY:
 To study the accuracy, precision and reproducability of
the proposed method and dosage forms recovery experiments
were carried out using standard method.
 These studies were performed by addition of known
amount of pure RIS to the pre analyzed tablet formulation &
the mixtures analyzed using proposed techniques.
 After parallel analysis the recovery results were
calculated using the related calibration equations.
August 6, 2016 21
VALIDATION PARAMETERS FOR RISPERIDONE:
PARAMETERS VALUES
Linearity range(μg/ml) 2-6
Precision(%) 2.0325+ 0.044
Accuracy (%) 1.02+ 0.188
LOD(μg/ml) 1.012
LOQ(μg/ml) 3.036
Stability(h) 2
Std deviation(SD+) 0.044
August 6, 2016 22
DEVELOPMENT AND VALIDATION SPECTROSCOPY
METHOD FOR ESTIMATION OF LACOSAMIDE IN
PHARMACEUTICAL DOSAGE FORMS:
DETERMINATION OF MAXIMUM WAVELENGTH:
 50 mg of lacosamide was weighed accurately and transferred into
a 100ml vol, flask & dissolved in 50ml of acetonitrile :
water(25:75) by sonication and made up to volume with the same
solvent mixture to give a standard concentration of 500μg /ml
transfer 5ml of the above solution into 100ml vol. flask dilute
and made up to volume with the solvent mixture to a standard
concentration of 25μg/ml.
August 6, 2016 23
 This solution was scanned against blank for the entire UV-
visible wavelength 200-800nm.
 Based on the spectrum λ max of 230 nm was selected for
further analysis.
August 6, 2016 24
STANDARD PREPARATION:
50 mg of lacosamide was weighed accurately
Dissolve in 50 ml of acetonitrile:water (25:75%v/v) by sonication
Make up the volume with solvent mixture to give a standard
concentration 500μg/ml
Transfer 2.5,3.5,5,6 &8ml ..of the standard solution into 100ml
vol.flask make upto volume with the solvent mixture to get a series
of standards 12.5,17.5,25,30 &40 μg/ml
Absorbance of the these standards are measured at λmax of 230nm.
Standard curve was drawn by plotting concentration vs absorbance.
d
August 6, 2016 25
SAMPLE PREPARATION:
50mg of Lacosamide in to 100 ml vol. flask sonicate for 30min.
With shaking and made up to volume with acetonitrile:
water(25:75% v/v)
Filter the solution through 0.45 μm membrane transfer 5ml of the
above solution in to 100ml volume flask and dilute to volume with
the same solvent.
The absorbance of the resulting solution was measured at 230nm.
The actual conc. Of the drug in the sample was determined from
standard curve.
August 6, 2016 26
METHOD DEVELOPMENT
 To develop a suitable UV method for the determination of
lacosamide different compositions of water,methanol,acetonitrile
were used as diluent.
 Finally good recoveries were found with diluent of
acetonitrile:water(25:75 % v/v)
 On scanning the standard solution against diluent in entire UV-
visible region of 200-800nm good response was found at 230nm
for 25μg/ml.
 There is no interference from dilute through the entire UV
visible range of 200-800nm.
August 6, 2016 27
METHOD VALIDATION:
The developed UV method was validated as per
ICH guidelines.
ACCURACY:
The method was determined by three conc.levels by
recovery experiments .
The recovery studies were carried out in triplicate
preparation collected from 20 tablets of lacosamide and
analyzed as per proposed method.
The % recoveries : 98.4-99.8 with an overall %RSD of
0.5.
August 6, 2016 28
Recovery studies for Lacosamide by proposed method
% level recovery range % RSD at each level over all % RSD
50 99.0-99.8 0.4
100 98.4-98.8 0.2 0.5
150 98.6-99.2 0.3
August 6, 2016 29
PRECISION:
Evaluated by 3 independent assays of test Lacosamide
sample.
Intermediate evaluated by different analysts and
different days in same day.
August 6, 2016 30
METHOD PRECISION (INTER AND INTRA) FOR
LACOSAMIDE:
REPLICATES METHOD PRECISION
INTER DAY INTRA DAY
1 99.3 99.80
2 98.4 101.1
3 99.1 99.9
4 99.9 100.3
5 100.3 100.8
6 99.7 100.3
AVERAGE 99.45 100.37
SD 0.67 0.50
% RSD 0.67 0.50
August 6, 2016 31
SPECIFICITY:
 To check for the interference of blank at the working
wavelength blank was scanned from 200-800nm.
 As there is no blank interference observed at the working
wavelength of 230nm.
 The UV spectroscopic method presented in this study is
specific for Lacosamide.
August 6, 2016 32
LINEARITY AND RANGE:
 The standard curve was obtained in the concentration range of
12-40μg/ml.
 This method was evaluated by linear regression analysis.
 Slope, intercept and correlation coefficient of standard curve
was <0.999.
August 6, 2016 33
CONCLUSION:
A simple, economic, precise, accurate method for
estimation of Lacosamide and risperidone in bulk and
pharmaceutical formulation was developed.
This developed method was validated according to
ICH guidelines.
August 6, 2016 34
REFERENCES
Analytical &bio analytical techniques-siladitya behera
2012
Asian journal of pharmaceutical and clinical research
vol-6,suppl-3,2013
 Principles of instrumental analysis- skoogDA, holler FJ,
6 th addition
International journal of pharmaceutical science & research
vol.1(2),2010,122-126
The Merck Index, Merck Research Laboratories division
of Merck and company, 13th ed, NJ, USA, 2001, 1627
August 6, 2016 35
36August 6, 2016

Analytical method development,validation by uv spectroscopy

  • 1.
    METHOD DEVELOPMENT, OPTIMIZATIONAND VALIDATION BY USING INSTRUMENT (UV-VISIBLE SPECTRO PHOTOMETer) PRESENTED BY: T. LAKSHMI BHAVANI (2015MPH40023) Under the guidance of: Dr. A. SRIDEVI SPMVV - TIRUPATHI Pharmaceutical Analysis-1st year II-semester 1 M.Pharm .,Ph.D August 6, 2016
  • 2.
    CONTENTS:  METHOD DEVELOPMENT OPTIMIZATION  VALIDATION OF INSTRUMENTATION (PHARMACEUTICAL DOSAGE FORMS,API,EXCIPIENTS)  UV-VISIBLE SPECTROPHOTOMETER  CONCLUSION  REFERENCES August 6, 2016 2
  • 3.
    METHOD DEVELOPMENT DEFINITION: It isdefined as a process of formulating the materials, conditions and protocol for measuring the analyte. August 6, 2016 3
  • 4.
    STEPS INVOLVED INUV SPECTROMETER  SELECTION OF SOLVENT SYSTEM  SELECTION OF ANALYTICAL WAVELENGTH.  STUDY OF BEERS LAMBERT’S LAW  TO PERFORM ANALYSIS OF STANDARD LABORATORY MIXTURE & TABLET FORMULATIONS BY PROPOSED METHOD.  TO VALIDATE THE DEVELOPED METHODS BY USING DIFFERENT VALIDATED PARAMETERS. August 6, 2016 4
  • 5.
    STUDY OF BEERS-LAMBERT’SLAW: The assay of single component sample, which contains other absorbing substances, is then calculated from the measured absorbance by using one of three principle procedures. They are, use of – standard absorptive value, calibration graph & single or double point standardization. August 6, 2016 5
  • 6.
    1. IN STANDARDABSORPTIVE VALUE METHOD The use of standard A(1%,1cm) or E values are used in order to determine its absorptivity. 2.IN CALIBRATION GRAPH METHOD The absorbance’s of a number of standard solutions of the reference substance at concentrations encompassing the sample concentrations are measured and a calibration graph is constructed. August 6, 2016 6
  • 7.
    3.The single pointstandardization: Procedure involves the measurement of the absorbance of a sample solution and of a standard solution of the reference substance. The concentration of the substances in the sample is calculated from the proportional relationship that exists between absorbance and concentration. C test=(A test X C std)/A std where, C test and C std are the concentrations in the sample and standard solutions respectively and A test and A std are the absorbance’s of the sample and standard solutions respectively. August 6, 2016 7
  • 8.
    SELECTION OF ANALYTICALWAVELENGTH: Proper wavelength selection of the methods depends upon the nature of the sample & its solubility. To develop a rugged & suitable spectro photometric method (UV), the analytical condition where selected after testing different parameters such as diluents, buffer & buffer concentration. Standard solution in UV spectrometer between 200 - 400nm on spectrum mode, using diluents as a blank. August 6, 2016 8
  • 9.
    VALIDATION: It is definedas establishing documented evidences which provides a high degree assurance that a specific process will consistently produce a product meeting its pre-determined specification & quality characteristics. August 6, 2016 9
  • 10.
    VALIDATION PARAMETERS: Accuracy Precision Limit ofdetection Limit of quantitation Specificity Linearity Range Robustness Ruggedness August 6, 2016 10
  • 11.
    ACCURACY: The closeness ofagreement between the value which is accepted as a conventional true value or an expected reference value , and the value found. PRECISION: It expresses the closeness of agreement between a series of measurements obtained from the multiple sampling of the homogenous sampling under the prescribed conditions. Precision may be considered at 3 levels: repeatability, intermediate precision, reproducability. 1.Repeatability : it expresses the precision under the same operating conditions over a short interval of time. August 6, 2016 11
  • 12.
    2.Intermediate precision: Itexpresses with in laboratory variations : different days, different analyst, different equipment 3.Reproducability: It expresses the precision between laboratories. DETECTION LIMIT: It is the lowest amount of analyte in a sample which can be detected but not quantitated as an exact value. QUANTITATION LIMIT: It is the lowest amount of analyte in a sample which can be quantitatively determined which suitable accuracy and precision. August 6, 2016 12
  • 13.
    SPECIFICITY: It isthe ability to acsses the analyte in the presence of components which may be expected to be present. It includes impurities, degradants, matrix etc. This definition has following implications: Identification: To ensure the identification of analyte Purity test: To ensure an accurate content of impurities of an analyte i.e. heavy metals, residual solvent content. Assay: To provide an exact result this allows an accurate statement on content or potency of analyte in the sample. LINEARITY: Its ability(with in a given range) to obtain test results which are directly proportional to the concentration(amount) of analyte in the sample. August 6, 2016 13
  • 14.
    RANGE: It isthe interval between upper and lower concentration of analyte in the sample. ROBUSTNESS: It is a measure of its capacity to remain unaffected by small variations in method parameters and provides an indication of its reliability during normal usage. RUGGEDNESS: Reproducibility under normal but variable laboratory conditions. August 6, 2016 14
  • 15.
     DEVELOPMENT OFANALYTICAL METHOD FOR RISPERIDONE(API) BY UV-SPECTROPHOTOMETRY: PREPARATION OF STOCK SOLUTION: 100mg of pure drug was weighed & transferred to 100ml volumetric flask, add 50ml of 0.1N HCl and make up the volume with 0.1 N HCl. August 6, 2016 15
  • 16.
     SAMPLE SOLUTION: 2mg of RIS was weighed and transferred to 100ml volumetric flask.  Add 20ml of 0.1 N HCl and sonicate for 5 min.  Volume was made up with 0.1 N HCl the above solution was mixed well and filtered through Whattmann’s filter paper.  Dilutions were made with 0.1N HCl to attain a concentration of 4μg /ml. 6 replicates of analysis were carried out with sample weighed individually. August 6, 2016 16
  • 17.
    VALIDATION PARAMETERS: ACCURACY &PRECISION LINEARITY LOD & LOQ STABILITY CALIBRATION CURVE August 6, 2016 17
  • 18.
    PRECISION & ACCURACY: Precision and accuracy were determined with standard quality control sample prepared in triplicate at different concentration levels.  Precision of the assay was determined by repeatability and intermediate precision, which was studied by comparing the assays on 3different days, results are documented as SD & % RSD.  Accuracy is the percentage of analyte recovered by assay from a known added amount.  Data from 9determinations over 3concentration levels covering the specified range. August 6, 2016 18
  • 19.
    Where s =the standard deviation of absorbance of the sample. m = the slope of the related calibration graphs. LOD: Lowest concentration of analyte that an analytical process can reliably differentiate from background levels. LOD = 3s/m LOQ: Lowest concentration of the standard curve that can be measured with an acceptable accuracy, precision and variability. LOQ = 10s/m August 6, 2016 19
  • 20.
    LINEARITY:  5 pointcalibration curve were generated.  evaluated by least square regression method using un weighed data. STABILITY:  The stability of risperidone in 0.1 N HCl solution was studied by UV method.  Sample solutions were prepared in triplicate and stored at 4 & 250 C for 30,60,90 & 120 min. August 6, 2016 20
  • 21.
    RECOVERY STUDY:  Tostudy the accuracy, precision and reproducability of the proposed method and dosage forms recovery experiments were carried out using standard method.  These studies were performed by addition of known amount of pure RIS to the pre analyzed tablet formulation & the mixtures analyzed using proposed techniques.  After parallel analysis the recovery results were calculated using the related calibration equations. August 6, 2016 21
  • 22.
    VALIDATION PARAMETERS FORRISPERIDONE: PARAMETERS VALUES Linearity range(μg/ml) 2-6 Precision(%) 2.0325+ 0.044 Accuracy (%) 1.02+ 0.188 LOD(μg/ml) 1.012 LOQ(μg/ml) 3.036 Stability(h) 2 Std deviation(SD+) 0.044 August 6, 2016 22
  • 23.
    DEVELOPMENT AND VALIDATIONSPECTROSCOPY METHOD FOR ESTIMATION OF LACOSAMIDE IN PHARMACEUTICAL DOSAGE FORMS: DETERMINATION OF MAXIMUM WAVELENGTH:  50 mg of lacosamide was weighed accurately and transferred into a 100ml vol, flask & dissolved in 50ml of acetonitrile : water(25:75) by sonication and made up to volume with the same solvent mixture to give a standard concentration of 500μg /ml transfer 5ml of the above solution into 100ml vol. flask dilute and made up to volume with the solvent mixture to a standard concentration of 25μg/ml. August 6, 2016 23
  • 24.
     This solutionwas scanned against blank for the entire UV- visible wavelength 200-800nm.  Based on the spectrum λ max of 230 nm was selected for further analysis. August 6, 2016 24
  • 25.
    STANDARD PREPARATION: 50 mgof lacosamide was weighed accurately Dissolve in 50 ml of acetonitrile:water (25:75%v/v) by sonication Make up the volume with solvent mixture to give a standard concentration 500μg/ml Transfer 2.5,3.5,5,6 &8ml ..of the standard solution into 100ml vol.flask make upto volume with the solvent mixture to get a series of standards 12.5,17.5,25,30 &40 μg/ml Absorbance of the these standards are measured at λmax of 230nm. Standard curve was drawn by plotting concentration vs absorbance. d August 6, 2016 25
  • 26.
    SAMPLE PREPARATION: 50mg ofLacosamide in to 100 ml vol. flask sonicate for 30min. With shaking and made up to volume with acetonitrile: water(25:75% v/v) Filter the solution through 0.45 μm membrane transfer 5ml of the above solution in to 100ml volume flask and dilute to volume with the same solvent. The absorbance of the resulting solution was measured at 230nm. The actual conc. Of the drug in the sample was determined from standard curve. August 6, 2016 26
  • 27.
    METHOD DEVELOPMENT  Todevelop a suitable UV method for the determination of lacosamide different compositions of water,methanol,acetonitrile were used as diluent.  Finally good recoveries were found with diluent of acetonitrile:water(25:75 % v/v)  On scanning the standard solution against diluent in entire UV- visible region of 200-800nm good response was found at 230nm for 25μg/ml.  There is no interference from dilute through the entire UV visible range of 200-800nm. August 6, 2016 27
  • 28.
    METHOD VALIDATION: The developedUV method was validated as per ICH guidelines. ACCURACY: The method was determined by three conc.levels by recovery experiments . The recovery studies were carried out in triplicate preparation collected from 20 tablets of lacosamide and analyzed as per proposed method. The % recoveries : 98.4-99.8 with an overall %RSD of 0.5. August 6, 2016 28
  • 29.
    Recovery studies forLacosamide by proposed method % level recovery range % RSD at each level over all % RSD 50 99.0-99.8 0.4 100 98.4-98.8 0.2 0.5 150 98.6-99.2 0.3 August 6, 2016 29
  • 30.
    PRECISION: Evaluated by 3independent assays of test Lacosamide sample. Intermediate evaluated by different analysts and different days in same day. August 6, 2016 30
  • 31.
    METHOD PRECISION (INTERAND INTRA) FOR LACOSAMIDE: REPLICATES METHOD PRECISION INTER DAY INTRA DAY 1 99.3 99.80 2 98.4 101.1 3 99.1 99.9 4 99.9 100.3 5 100.3 100.8 6 99.7 100.3 AVERAGE 99.45 100.37 SD 0.67 0.50 % RSD 0.67 0.50 August 6, 2016 31
  • 32.
    SPECIFICITY:  To checkfor the interference of blank at the working wavelength blank was scanned from 200-800nm.  As there is no blank interference observed at the working wavelength of 230nm.  The UV spectroscopic method presented in this study is specific for Lacosamide. August 6, 2016 32
  • 33.
    LINEARITY AND RANGE: The standard curve was obtained in the concentration range of 12-40μg/ml.  This method was evaluated by linear regression analysis.  Slope, intercept and correlation coefficient of standard curve was <0.999. August 6, 2016 33
  • 34.
    CONCLUSION: A simple, economic,precise, accurate method for estimation of Lacosamide and risperidone in bulk and pharmaceutical formulation was developed. This developed method was validated according to ICH guidelines. August 6, 2016 34
  • 35.
    REFERENCES Analytical &bio analyticaltechniques-siladitya behera 2012 Asian journal of pharmaceutical and clinical research vol-6,suppl-3,2013  Principles of instrumental analysis- skoogDA, holler FJ, 6 th addition International journal of pharmaceutical science & research vol.1(2),2010,122-126 The Merck Index, Merck Research Laboratories division of Merck and company, 13th ed, NJ, USA, 2001, 1627 August 6, 2016 35
  • 36.