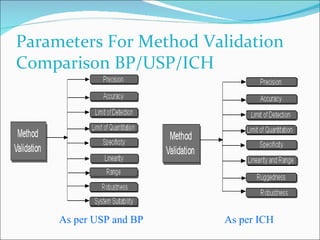
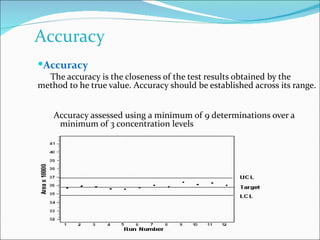
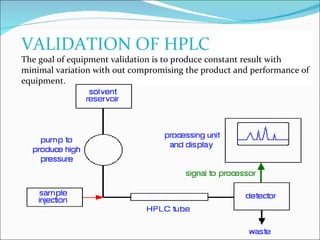
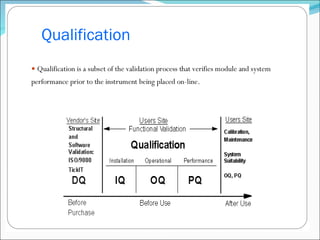
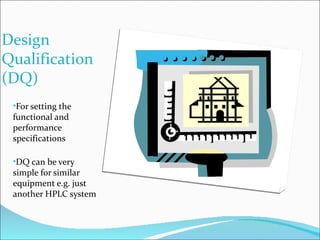
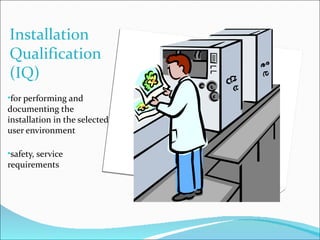
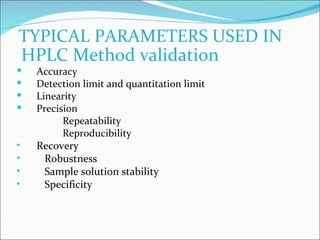
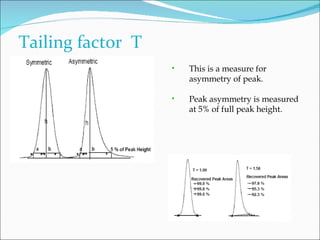
SEMINAR
                   ON
Analytical Method Validation
& Validation of HPLC

• GUIDE:             • Presented by:
   MR. Ishaq Ahmed     T.VENKATESH
    (Asst. Proff)      M. Pharmacy (pharmaceutics)
                       Sri Kakatiya Institute of
                       Pharmaceutical Science.
CONTENTS
• INTRODUCTION
• PARAMETERS FOR METHOD VALIDATION
        -AS PER USP/BP
        -AS PER ICH
• VALIDATION OF HPLC
        -TYPICAL HPLC DESIGN
        -VALIDATION PARAMETERS
•  CONCLUSION
•  REFERENCES
INTRODUCTION
 Validation
 Establish a documented evidence which provides a high degree of
 assurance that a specific process will consistently produce a product
 meeting its predetermined specifications and quality attributes


 Analytical Validation
 The principle purpose of analytical validation is to ensure that the
 selected analytical procedure will give reproducible and reliable
 results that are adequate for the intended purpose.
Why validation is necessary?
 It is an important element of quality control.


 Validation helps provide assurance that a measurement will be
  reliable.

 In some fields, validation of methods is a regulatory requirement.
When is validation needed?
 Before introduction of a new method in to routine use.


 Whenever condition change for which method has been validation e.g.
  instrument with different characteristics.

 Whenever the method is changed and the change is outside the scope
  of the original method
When Revalidation To Be Done?

    •   Equipment changes

    •   Formula changed

    •   Changed suppliers of critical reagents
Parameters For Method Validation
Comparison BP/USP/ICH


     As per USP and BP   As per ICH
Accuracy
Accuracy
  The accuracy is the closeness of the test results obtained by the
method to he true value. Accuracy should be established across its range.


    Accuracy assessed using a minimum of 9 determinations over a
     minimum of 3 concentration levels
True value


             Accurate but
              imprecise
Precision
   Precision : The precision of an analytical method is the
    degree of agreement between a series of measurements
    obtained from multiple sampling of the same homogeneous
    sample.
    Repeatability : Repeatability expresses the precision under
    the same operating conditions over a short interval of time.
    Repeatability is also termed intra-assay precision .

      a minimum of 9 determinations covering the specified range
        for the procedure ( e.g., 3 concentrations/3 replicates each);
                         or
       a minimum of 6 determinations at 100% of the test
        concentration.
Precision
Intermediate Precision:
  Intermediate precision expresses within-laboratories variations,
  different days, different analysts, different equipment, etc.


Reproducibility:
  Reproducibility expresses the precision between laboratories
  (collaborative studies, usually applied to standardization of
  methodology).
Relationship between Accuracy
 and Precision


                 Inaccurate &
                   imprecise


Inaccurate but                  Accurate but   Accurate AND Precise
   precise                       imprecise
Linearity
  The linearity of an analytical procedure is
 its ability to obtain test results that are
 directly proportional to the concentration of
 the analyte in the sample.
  Linearity is usually demonstrated by the
 analysis of various concentrations of the
 analyte (s) across the indented range and
 represented graphically.
 A statistical analysis of the data is usually
 required, such as the calculation of a
 regression line using the method of least
 square .
  A minimum of 5 concentration is
 recommended.
Range
 Range of the analytical procedure is the interval between the upper
    and the lower concentration of the analyte for which it has been
    demonstrated that the analytical procedure has a suitable precision,
    accuracy and linearity.
   For assay the range is usually not less than 80 to 120% of the test
    concentration.
   For determination of content uniformity the range is usually not less
    than 70 to 130% or the test concentration.
   For determination of impurities the range is usually not less than the
    reporting limit of the impurity to 120% or the specification.
   For dissolution testing the range is usually ±20% over the expected
    concentration.
Specificity/Selectivity
 The ability to assess unequivocally the analyte in
  the presence of components that may be
  expected to be present.
  – Impurities
  – degradants
  – excipients
 Specificity must be demonstrated for:
  – Identification
  – Impurities Test
  – Assay Test
Detection limit (limit of detection)
 Definition :
    Limit of Detection is the smallest quantity of an analyte that can be
    detected, but not necessarily quantified.


 Approaches to calculation :
•    visual evaluation
•     signal to noise ratio
•     standard deviation of the response and the slope of the calibration
       curve
Calculation
 1. visual   evaluation- DL is determined by the analysis of a series of
  samples with known concentrations and establishing the minimum level
  at which the analyte can be reliably detected.

 2. signal to noise ratio- For instrumental procedures that exhibit
  background noise, it is common to compare measured signals
  from samples with known low concentrations of analyte with
  those of the blank samples. The minimum concentration at which
  the analyte can reliably be detected is established using an
  acceptable signal - to - noise ratio of 2 : 1 or 3 : 1.
 3. standard deviation of the response and the slope of the calibration
  curve
  DL=3σ/S
  where σ is the standard deviation of the response and S is the slope
  of the calibration curve
Limit of Quantitation
• The quantitation limit is the lowest amount of analyte in a sample
    which can be quantitatively determined with suitable precision and
    accuracy.

•   Used particularly for the determination of impurities and/or
    degradation products.
Limit of Quantitation
 Various approaches of determining the Quantitation
  Limits are
- Based on visual evaluation
- Based on signal-to-noise
- Based On Standard Deviation Of Response And Slope
       DL= 10 σ/S
  σ = the standard deviation of the response
  S = the slope of the calibration curve
    LOQ vary with detector sensitivity.
    Lamp aging, different manufacturer of detector.
Ruggedness
     Ruggedness: The ruggedness of an analytical method is the
  degree of reproducibility of the test results obtained by the analysis
  of the same samples under a variety of conditions, such as
       Day-to-day variations
       Analyst-to-analyst
       Laboratory-to-laboratory
       Instrument-to-instrument
       Chromatographic column-to-column
       Reagent kit-to-kit
       Instability of analytical reagents
Robustness
   The robustness of an analytical procedure is a measure of its
    capacity to remain unaffected by small but deliberate variations
    in method parameters and provides an indication of its
    reliability during use.
VALIDATION OF HPLC
The goal of equipment validation is to produce constant result with
minimal variation with out compromising the product and performance of
equipment.
Qualification
 Qualification is a subset of the validation process that verifies module and system
performance prior to the instrument being placed on-line.
Design
Qualification
(DQ)
 •For setting the
 functional and
 performance
 specifications

 •DQ can be very
 simple for similar
 equipment e.g. just
 another HPLC system
Installation
Qualification
(IQ)
•for performing and
documenting the
installation in the selected
user environment

•safety, service
requirements
Operational
Qualification
(OQ)
•For testing the
equipment in the
selected user
environment to ensure it
meets our defined
functional and
performance
specifications
Performance
Qualification
(PQ)
•For testing that the system
consistently performs as intended
for the selected application

•Periodic calibration /
maintenance

•Must be signed back by user

•May use Method System
Suitability Checks as part of PQ
TYPICAL PARAMETERS USED IN
HPLC Method validation
   Accuracy
   Detection limit and quantitation limit
   Linearity
   Precision
          Repeatability
          Reproducibility
•   Recovery
•     Robustness
•     Sample solution stability
•     Specificity
System suitability
 The simplest form of an HPLC system suitability test involves a
  comparison of chromatogram trace with a standard trace.

 This allows a comparison of the peak shape, peak width, baseline
  resolution.

 Parameters to be calculated to provide a system suitability test
  report.
System Suitability
 Number of theoretical plates (efficiency)
 Capacity factor
 Separation (relative retention)
 Resolution
 Tailing factor
 Relative standard deviation


 These are measured on a peak or peaks of known retention time
  and peak width.
Retention Factor or capacity factor
                 •The capacity factor is a measure of how
                 long each component is retained on the
                 column.
                 •   k is used in preference to retention time.
                 •Generally   the value ok K’ is > 2.
                 •Inpractice the k value for the first peak of
                 interest should be >1 to assure that it is
                 separated from solvent.
                 •Hear  Tr is retention time of peak of
                 interest & T0 is unretained peaks
                 retention time.
Relative Retention/ Separation
•This describes the relative position of two adjacent peaks. Ideally it is
calculated using the capacity factor
•Because  the peak separation depends on the components interction with
the stationary phase.
Number of theoretical plate
             •Thisis a measure of sharpness of the peaks and
             therefore the efficiency of the column that is ,
             how many peaks can be located per unit run
             time of the chromatogram.
             •This   cam be calculated in various ways.
             •ex: USP uses the peak width at base and BP at
             half the height.
             •The theoretical plate number depends on
             elution time but in general should be > 2000
Tailing factor T
                   •   This is a measure for
                       asymmetry of peak.

                   •   Peak asymmetry is measured
                       at 5% of full peak height.
Peak Resolution R

• This is not only a measure of separation between two
peaks, but also the efficiency of the column.


• It is expressed as ratio of the distance between the two
peak maxima to mean value of peak width.
Precision

• Injection repeatability (i.e. 6)


• If RSD (relative standard
  deviation) of ≤ 2% is required
  then 5 replicate injections
  should be used.

• Data from six injections are used
  if the RSD is more than 2.0%
CONCLUSION
 This summarizes the validation parameters that are required according
  to the requirement of ICH/USP&BP.

 Summarized the extent, need & necessary of validation.


 Validation may cost initially but it avoids the risk of breaking down, for
  this reason even small industries are concentrating more on validation
  their by fulfilling goal of GMP.

 Validation when done according to standard protocol and used it always
  produce a product which meets its predetermined specifications and
  quality.
References
   Article on Validation of Analytical Procedures: comparison
    of ICH vs Pharmacopoeia by katrai Sahil.

   British Pharmacopoeia, 2007 (4) A523 and A159-163

   United states pharmacopoeia 30, 1920-1924 and 2149-2152.

   www.ich.org

   CDER guideline Nov 1994 validation of chromatographic
    methods
analytical method validation and validation of hplc

analytical method validation and validation of hplc

  • 1.
    SEMINAR ON Analytical Method Validation & Validation of HPLC • GUIDE: • Presented by: MR. Ishaq Ahmed T.VENKATESH (Asst. Proff) M. Pharmacy (pharmaceutics) Sri Kakatiya Institute of Pharmaceutical Science.
  • 2.
    CONTENTS • INTRODUCTION • PARAMETERSFOR METHOD VALIDATION -AS PER USP/BP -AS PER ICH • VALIDATION OF HPLC -TYPICAL HPLC DESIGN -VALIDATION PARAMETERS • CONCLUSION • REFERENCES
  • 3.
    INTRODUCTION  Validation Establisha documented evidence which provides a high degree of assurance that a specific process will consistently produce a product meeting its predetermined specifications and quality attributes  Analytical Validation The principle purpose of analytical validation is to ensure that the selected analytical procedure will give reproducible and reliable results that are adequate for the intended purpose.
  • 4.
    Why validation isnecessary?  It is an important element of quality control.  Validation helps provide assurance that a measurement will be reliable.  In some fields, validation of methods is a regulatory requirement.
  • 5.
    When is validationneeded?  Before introduction of a new method in to routine use.  Whenever condition change for which method has been validation e.g. instrument with different characteristics.  Whenever the method is changed and the change is outside the scope of the original method
  • 6.
    When Revalidation ToBe Done? • Equipment changes • Formula changed • Changed suppliers of critical reagents
  • 7.
    Parameters For MethodValidation Comparison BP/USP/ICH As per USP and BP As per ICH
  • 8.
    Accuracy Accuracy Theaccuracy is the closeness of the test results obtained by the method to he true value. Accuracy should be established across its range. Accuracy assessed using a minimum of 9 determinations over a minimum of 3 concentration levels
  • 9.
    True value Accurate but imprecise
  • 10.
    Precision Precision : The precision of an analytical method is the degree of agreement between a series of measurements obtained from multiple sampling of the same homogeneous sample. Repeatability : Repeatability expresses the precision under the same operating conditions over a short interval of time. Repeatability is also termed intra-assay precision . a minimum of 9 determinations covering the specified range for the procedure ( e.g., 3 concentrations/3 replicates each); or a minimum of 6 determinations at 100% of the test concentration.
  • 11.
    Precision Intermediate Precision: Intermediate precision expresses within-laboratories variations, different days, different analysts, different equipment, etc. Reproducibility: Reproducibility expresses the precision between laboratories (collaborative studies, usually applied to standardization of methodology).
  • 12.
    Relationship between Accuracy and Precision Inaccurate & imprecise Inaccurate but Accurate but Accurate AND Precise precise imprecise
  • 13.
    Linearity  Thelinearity of an analytical procedure is its ability to obtain test results that are directly proportional to the concentration of the analyte in the sample.  Linearity is usually demonstrated by the analysis of various concentrations of the analyte (s) across the indented range and represented graphically. A statistical analysis of the data is usually required, such as the calculation of a regression line using the method of least square .  A minimum of 5 concentration is recommended.
  • 14.
    Range  Range ofthe analytical procedure is the interval between the upper and the lower concentration of the analyte for which it has been demonstrated that the analytical procedure has a suitable precision, accuracy and linearity.  For assay the range is usually not less than 80 to 120% of the test concentration.  For determination of content uniformity the range is usually not less than 70 to 130% or the test concentration.  For determination of impurities the range is usually not less than the reporting limit of the impurity to 120% or the specification.  For dissolution testing the range is usually ±20% over the expected concentration.
  • 15.
    Specificity/Selectivity  The abilityto assess unequivocally the analyte in the presence of components that may be expected to be present. – Impurities – degradants – excipients  Specificity must be demonstrated for: – Identification – Impurities Test – Assay Test
  • 16.
    Detection limit (limitof detection)  Definition : Limit of Detection is the smallest quantity of an analyte that can be detected, but not necessarily quantified.  Approaches to calculation : • visual evaluation • signal to noise ratio • standard deviation of the response and the slope of the calibration curve
  • 17.
    Calculation  1. visual evaluation- DL is determined by the analysis of a series of samples with known concentrations and establishing the minimum level at which the analyte can be reliably detected.  2. signal to noise ratio- For instrumental procedures that exhibit background noise, it is common to compare measured signals from samples with known low concentrations of analyte with those of the blank samples. The minimum concentration at which the analyte can reliably be detected is established using an acceptable signal - to - noise ratio of 2 : 1 or 3 : 1.  3. standard deviation of the response and the slope of the calibration curve DL=3σ/S where σ is the standard deviation of the response and S is the slope of the calibration curve
  • 18.
    Limit of Quantitation •The quantitation limit is the lowest amount of analyte in a sample which can be quantitatively determined with suitable precision and accuracy. • Used particularly for the determination of impurities and/or degradation products.
  • 19.
    Limit of Quantitation Various approaches of determining the Quantitation Limits are - Based on visual evaluation - Based on signal-to-noise - Based On Standard Deviation Of Response And Slope DL= 10 σ/S σ = the standard deviation of the response S = the slope of the calibration curve LOQ vary with detector sensitivity. Lamp aging, different manufacturer of detector.
  • 20.
    Ruggedness  Ruggedness: The ruggedness of an analytical method is the degree of reproducibility of the test results obtained by the analysis of the same samples under a variety of conditions, such as  Day-to-day variations  Analyst-to-analyst  Laboratory-to-laboratory  Instrument-to-instrument  Chromatographic column-to-column  Reagent kit-to-kit  Instability of analytical reagents
  • 21.
    Robustness The robustness of an analytical procedure is a measure of its capacity to remain unaffected by small but deliberate variations in method parameters and provides an indication of its reliability during use.
  • 22.
    VALIDATION OF HPLC Thegoal of equipment validation is to produce constant result with minimal variation with out compromising the product and performance of equipment.
  • 23.
    Qualification  Qualification isa subset of the validation process that verifies module and system performance prior to the instrument being placed on-line.
  • 24.
    Design Qualification (DQ) •For settingthe functional and performance specifications •DQ can be very simple for similar equipment e.g. just another HPLC system
  • 25.
    Installation Qualification (IQ) •for performing and documentingthe installation in the selected user environment •safety, service requirements
  • 26.
    Operational Qualification (OQ) •For testing the equipmentin the selected user environment to ensure it meets our defined functional and performance specifications
  • 27.
    Performance Qualification (PQ) •For testing thatthe system consistently performs as intended for the selected application •Periodic calibration / maintenance •Must be signed back by user •May use Method System Suitability Checks as part of PQ
  • 28.
    TYPICAL PARAMETERS USEDIN HPLC Method validation  Accuracy  Detection limit and quantitation limit  Linearity  Precision Repeatability Reproducibility • Recovery • Robustness • Sample solution stability • Specificity
  • 29.
    System suitability  Thesimplest form of an HPLC system suitability test involves a comparison of chromatogram trace with a standard trace.  This allows a comparison of the peak shape, peak width, baseline resolution.  Parameters to be calculated to provide a system suitability test report.
  • 30.
    System Suitability  Numberof theoretical plates (efficiency)  Capacity factor  Separation (relative retention)  Resolution  Tailing factor  Relative standard deviation  These are measured on a peak or peaks of known retention time and peak width.
  • 31.
    Retention Factor orcapacity factor •The capacity factor is a measure of how long each component is retained on the column. • k is used in preference to retention time. •Generally the value ok K’ is > 2. •Inpractice the k value for the first peak of interest should be >1 to assure that it is separated from solvent. •Hear Tr is retention time of peak of interest & T0 is unretained peaks retention time.
  • 32.
    Relative Retention/ Separation •Thisdescribes the relative position of two adjacent peaks. Ideally it is calculated using the capacity factor •Because the peak separation depends on the components interction with the stationary phase.
  • 33.
    Number of theoreticalplate •Thisis a measure of sharpness of the peaks and therefore the efficiency of the column that is , how many peaks can be located per unit run time of the chromatogram. •This cam be calculated in various ways. •ex: USP uses the peak width at base and BP at half the height. •The theoretical plate number depends on elution time but in general should be > 2000
  • 34.
    Tailing factor T • This is a measure for asymmetry of peak. • Peak asymmetry is measured at 5% of full peak height.
  • 35.
    Peak Resolution R •This is not only a measure of separation between two peaks, but also the efficiency of the column. • It is expressed as ratio of the distance between the two peak maxima to mean value of peak width.
  • 36.
    Precision • Injection repeatability(i.e. 6) • If RSD (relative standard deviation) of ≤ 2% is required then 5 replicate injections should be used. • Data from six injections are used if the RSD is more than 2.0%
  • 37.
    CONCLUSION  This summarizesthe validation parameters that are required according to the requirement of ICH/USP&BP.  Summarized the extent, need & necessary of validation.  Validation may cost initially but it avoids the risk of breaking down, for this reason even small industries are concentrating more on validation their by fulfilling goal of GMP.  Validation when done according to standard protocol and used it always produce a product which meets its predetermined specifications and quality.
  • 38.
    References  Article on Validation of Analytical Procedures: comparison of ICH vs Pharmacopoeia by katrai Sahil.  British Pharmacopoeia, 2007 (4) A523 and A159-163  United states pharmacopoeia 30, 1920-1924 and 2149-2152.  www.ich.org  CDER guideline Nov 1994 validation of chromatographic methods

Editor's Notes

  • #2 25/06/12 Module 1, Part 4 focuses on Quality Control-related validation . The suggested time for Part 4 is: 60-90 minutes. (Note for the trainer: the times noted are very approximate.)
  • #5 25/06/12 Introduction : Analytical monitoring of a pharmaceutical product, or of specific ingredients within the product, is necessary to ensure its safety and efficacy throughout all phases of its shelf-life, including storage, distribution, and use. This monitoring should be conducted in accordance with specifications validated during product development. The principal purpose of analytical validation is to ensure that a selected analytical procedure will give reproducible and reliable results that are adequate for the intended purpose. It is necessary to define properly both the conditions in which the procedure is to be used and the purpose for which it is intended. These principles apply to all procedures described in a pharmacopoeia and to non-pharmacopoeia procedures used by a manufacturing company. These guidelines apply to procedures used to examine chemical and physico­chemical attributes, but many are equally applicable to microbiological and biological procedures.
  • #7 25/06/12 Extent of validation required: New (from manufacturer/literature) methods require complete validation. Methods in pharmacopoeias require partial validation, if the method has not been previously validated for that specific drug product. Manufacturers should validate pharmacopoeial methods to ensure they work with their own products - as a minimum accuracy and specificity. The USP monograph states: “Already established general assays and tests - should also be validated to verify their accuracy (and absence of possible interference) when used for a new product or starting materials.” At least partial revalidation is required whenever significant changes are made which could reasonably be expected to affect the results obtained, e.g. in case of instrument change, product formula change, changed suppliers of critical reagents, method.
  • #13 25/06/12 The relationship between accuracy and precision can be represented by arrows being shot at a target. The first small target at the top shows the arrows have landed indiscriminately. This is neither accurate nor precise. The second target on the left shows the arrows have grouped together nicely but are not on the bullseye. This is precise but inaccurate. This is sometimes called analytical bias and sometimes a correction factor can be applied. The third, small target shows the arrows AVERAGE is on the bullseye, but the precision is unacceptable. The fourth, large target shows the arrows are all clustered on or in the bullseye; this shows accuracy and precision.
  • #21 25/06/12 Characteristics of analaytical procedures: (Contd) Ruggedness and Robustness Robustness, and ruggedness, of an analytical procedures is a measure of its capacity to remain unaffected by small, but deliberate variations in method parameters, and thus provides an indication of the reliability of the method during normal usage, under various conditions. Ruggedness is due to factors external to the method; robustness is due to factors internal to the method. Things that may cause variability include: Day-to-day variations in e.g. temperature, relative humidity, etc. Analyst-to-analyst Laboratory-to-laboratory Instrument-to-instrument Chromatographic column-to-column Reagent kit-to-kit or lot-to-lot variation Time from sample preparation to assay Instability of analytical reagents
  • #29 25/06/12 Following a system suitability test, the actual analytical method is then validated by checking: Specificity: by checking that the method is free of interference from excipients, impurities, etc. Accuracy: by checking that the method gives closeness to true results. Precision: by checking that the method is precise. Linearity: by checking that the method will produce results that are directly proportional to the concentration of analyte in the samples. Robustness: by checking that the method will withstand deliverate changes.
  • #30 25/06/12 The system suitability tests are carried out during the method development phase, prior to method validation. These tests are designed to evaluate the performance of the entire system. It is done by analysing a “system suitability” sample, which consists of the main components, including impurities. This may also contain excipients, which may interfere with peaks of interest. The system suitability is evaluated in terms of the following parameters: - system precision - column efficiency (usually >2000) - symmetry factor (acceptance criteria 0.9 to 2.5) - capacity factor (acceptance criteria NLT 1.5)