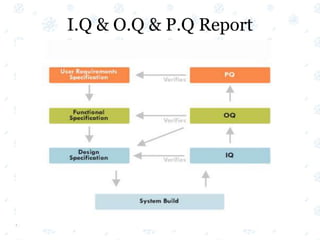
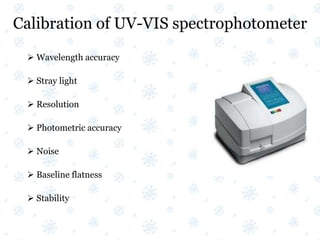
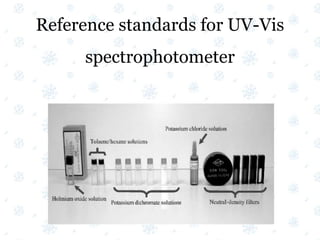
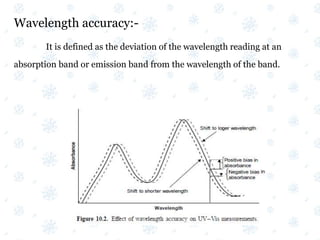
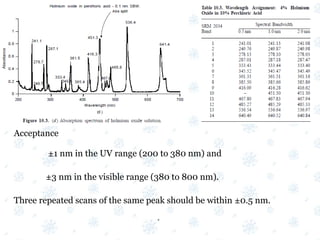
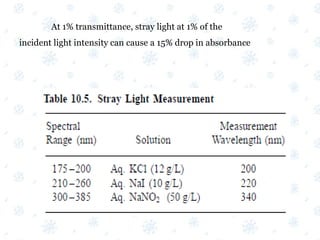
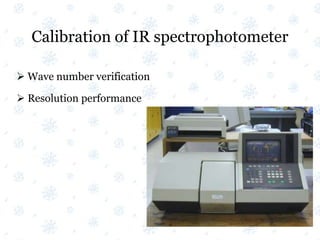
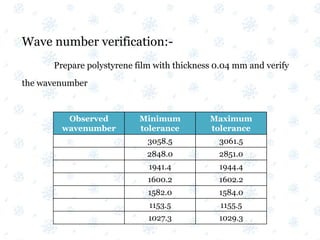
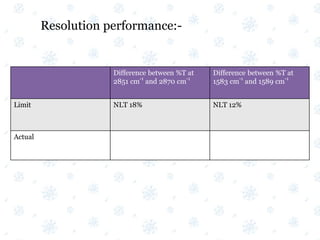
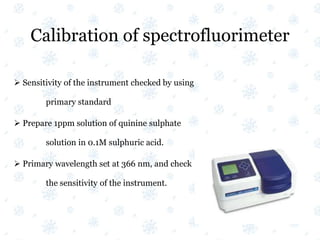
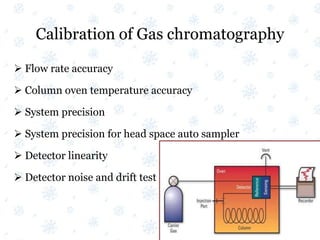
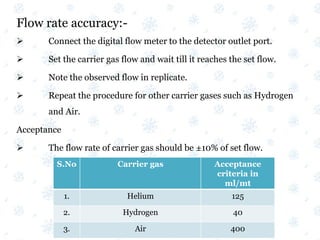
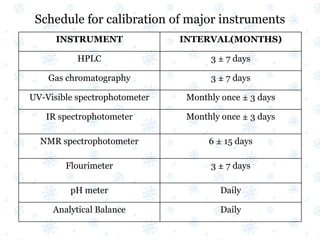
Calibration and Validation of
Analytical Instruments
A.Solairajan
1st year
M.Pharm(Analysis)
Presentation outline
Introduction
Calibration
Validation
Analytical instruments
UV Visible Spectrophotometer
IR Spectrophotometer
Spectrofluorimeter
HPLC
HPTLC
GC
Introduction
Analytical instruments are used for a specific analysis of
drugs and pharmaceuticals.
So, regular performance verification are made to ensure
that the instruments used in the analytical purpose should be
properly validated and calibrated “to demonstrate that it is
suitable for its intended purpose”.
Calibration
Calibration is a process by which ensure that an
instrument readings are accurate with reference to established
standards.
Calibration is performed using primary reference
standards.
Instruments need to be calibrated before using.
For example- weighing balance,p
H
meter,…….etc
Need for calibration
Calibration can be called for:
 with a new instrument.
 when a specified time period is elapsed.
 when a specified usage (operating hours) has elapsed.
 when an instrument has had a shock or vibration which
potentially may have put it out of calibration.
 sudden changes in weather.
 whenever observations appear questionable.
Validation
Validation is a detailed process of confirming that the
instrument is installed correctly, that it is operating effectively,
and that it is performing without error.
The field of validation is divided into a number of
subsections as follows-
 Cleaning validation
 Process validation
 Analytical method validation
 Computer system validation
Equipment validation
It demonstrate that equipment used in validation studies is
suitable for use and is comparable to equipment used for routine
analysis.
Qualification
Action of proving and documenting that equipment or
ancillary systems are properly installed, work correctly, and actually
lead to the expected results.
Qualification is part of validation , but the individual
qualification steps alone do not constitute process validation.
Parts of qualification
The activity of qualifying system of equipment is
divided into four subtypes-
 Design qualification (DQ)
 Installation qualification (IQ)
 Operational qualification (OQ)
 Performance qualification (PQ)
Design qualification (DQ)- Demonstrates that the
proposed design will satisfy all the requirements that
are defined and detailed in the User Requirements
Specification.
Installation qualification (IQ)- Demonstrates that the
process or equipment meets all specifications, is
installed correctly, and all required components and
documentation needed for continued operation are
installed and in place.
Operational qualification (OQ)- Demonstrates that all
facets of the process or equipment are operating correctly.
Performance qualification (PQ)- Demonstrates that the
process or equipment performs as intended in a consistent
manner over time.
I.Q & O.Q & P.Q Report
Calibration of UV-VIS spectrophotometer
 Wavelength accuracy
 Stray light
 Resolution
 Photometric accuracy
 Noise
 Baseline flatness
 Stability
Reference standards for UV-Vis
spectrophotometer
Wavelength accuracy:-
It is defined as the deviation of the wavelength reading at an
absorption band or emission band from the wavelength of the band.
Test:-
Wavelength accuracy verification is checked by comparing the recorded
wavelength of the peak against the value of reference standard.
commonly used wavelength standards such as
Deuterium lamp,
Mercury vapor lamp,
Holmium oxide filter, and
Holmium oxide solution (4% holmium oxide in 10% perchloric acid in a 1-cm
cell)
Acceptance
±1 nm in the UV range (200 to 380 nm) and
±3 nm in the visible range (380 to 800 nm).
Three repeated scans of the same peak should be within ±0.5 nm.
•
Stray light:-
Stray light is defined as the detected light of any wavelength that is
outside the bandwidth of the wavelength selected.
Test:-
Three test solutions prepared and measured the stray light at 200 nm,
220 nm and 340 nm
Acceptance:-
The transmittance of the solution in a 1 cm cell should be less than 0.01
or the absorbance value should be greater than 2.
At 1% transmittance, stray light at 1% of the
incident light intensity can cause a 15% drop in absorbance
Resolution power:-
The resolution of a UV-VIS spectrophotometer is related to its
spectral bandwidth(SBW).The smaller the spectral width, the finer the
resolution.
The SBW depends on the slit width and the dispersive power of the
monochromator
Test:-
0.02%v/v toluene in hexane is used to test the resolution power of the
spectrophotometer. The absorbance measured at 269 nm and 266 nm.
Acceptance:-
The ratio of the absorbance at 269 nm and absorbance at 266 nm
should be grater than 1.5
Noise:-
Noise in the measurement affects the accuracy at both ends of
the absorbance scale.
Photon noise from the light source affects the accuracy of the
measurements leads to low absorbance.
Test:-
Air is scanned in the absorbance mode for 10 min.peak to noise
is recorded at 500nm.Root mean square noise is then calculated.
Acceptance:-
The RMS noise should be less than 0.001 AU
Baseline flatness:-
The flat baseline test demonstrates the ability of the instrument to
normalize the light intensity measurement and the spectral output at
different wavelengths through out the spectral range.
Test:-
Air is scanned in the absorbance mode.The highest and lowest
deflections in the absorbance unit are recorded.
Acceptance:-
The deflection is typically less than 0.01AU
Stability:-
The lamp intensity is a function of the age of the lamp,
temperature fluctuation, and wavelength of the measurement.
These changes can lead to errors in the value of the measurements,
over an extended period of time.
Test:-
Air is scanned in the absorbance mode for 60 min at specific
wavelength(340nm).The highest and lowest deflections in the absorbance
unit are recorded.
Acceptance:-
The deflection is less than 0.002 AU/h
Photometric accuracy:-
Photometric accuracy is determined by comparing the difference
between the measured absorbance of the reference materials and the
established value.
Test:-
Either neutral density filters or potassium dichromate solutions
are used.
Acceptance:-
Six replicate measurements of the 0.006%w/v potassium
dichromate solution at 235, 257, 313 and 350 nm should be less than 0.5%
RSD.
Linearity:-
The linear dynamic range of the measurement is limited by stray
light at high absorbance and by noise at low absorbance.
The accuracy of the quanitification of the sample depends on the
precision and linearity of the measurements.
Test:-
A series of Potassium dichromate solution of concentration
20,40,60,80 and 100mg/L in 0.005M sulfuric acid. The absorption of
various wavelength are plotted against the concentration of the solution
and the correlation coefficients are calculated.
Acceptance:-
Correlation coefficient r≥ 0.999
Calibration of IR spectrophotometer
 Wave number verification
 Resolution performance
Wave number verification:-
Prepare polystyrene film with thickness 0.04 mm and verify
the wavenumber
Observed
wavenumber
Minimum
tolerance
Maximum
tolerance
3058.5 3061.5
2848.0 2851.0
1941.4 1944.4
1600.2 1602.2
1582.0 1584.0
1153.5 1155.5
1027.3 1029.3
Resolution performance:-
Difference between %T at
2851 cm
-1
and 2870 cm
-1
Difference between %T at
1583 cm
-1
and 1589 cm
-1
Limit NLT 18% NLT 12%
Actual
Calibration of spectrofluorimeter
 Sensitivity of the instrument checked by using
primary standard
 Prepare 1ppm solution of quinine sulphate
solution in 0.1M sulphuric acid.
 Primary wavelength set at 366 nm, and check
the sensitivity of the instrument.
Calibration of HPLC
Flow rate accuracy
Injector accuracy
System precision
Wavelength accuracy
Detector linearity
Injector linearity
Gradient performance check
Column oven temperature accuracy
Flow rate accuracy:-
The perfoemance of pump module is the ability to maintain
accurate and consistent flow of the mobile phase.Poor flow rate will affect
the retention time and resolution of the separation.
Test:-
The flow rate accuracy at 2 ml/min can be verified by using a calibrated
stopwatch to measure the time it takes to collect 25 ml of effluent from the
pump into a 25 ml volumetric flask
Acceptance:-
±2.0% 0f the set flow rate
Gradient accuracy
The accuracy and linearity of the gradient solvent delivery can be
verified indirectly by monitoring the absorbance change when the
composition of the two solvents from two different channels changes.
TEST
Channel A is filled with a pure solvent such as methanol and
Channel B is filled with a solvent containing a UV-active tracer such as
caffeine (ca. 15 mg per liter of solvent).
The gradient profile is programmed to vary the composition of the
mixture from 100% A to 100% B in a short period of time, and then
changed back to 100% A in a stepwise manner.
If the composition of the 20% A and 80% B mixture is accurate, the
height B1 , which corresponds to the absorbance at 80% B
The linearity of the gradient delivery can be verified
by plotting the absorbance at various mobile-phase composition versus
sample compositions.
System precision:-
 Weigh accurately 60 mg of caffeine into 100 ml volumetric flask.
 Dissolve and dilute to the volume with mobile phase.Transfer 10
ml of this solution into 100 ml flask and make up with mobile phase.
 Inject blank followed by standard preparation in 6 replicates.
Note down the areas and retention times.
Acceptance:-
The % RSD of retention time and peak area should be <1.0%
Wavelength accuracy:-
Inject blank followed by standard preparation and note down
the height or absorbance.
Acceptance:-
The maximum absorbance should be ±2 nm.
Detector linearity:-
 The linearity of the detector response can be checked by pumping or by
filling the flow cell with a series of standard solution of various
concentration.
 Aqueous caffeine solutions are convenient for the linearity
measurement.
The correlation coefficient between sample concentration and response
can be calculated to determine the linearity.
Acceptance:-
R≥ 0.999
Injector linearity:-
 Linearity is important for methods that require the use of variable
injection volumes.
 The linearity of the injector can be demonstrated by making injections,
typically 5,10,20,50 and 100 μl to cover the range 0 to 100 μl.
 The response of the injection is plotted against the injection volume.
 The correlation coefficient of the plot is used in evaluation of the injector
linearity.
Acceptance:-
R≥0.999
Column oven temperature accuracy:-
 The efficiency of HPLC column varies with column temperature.
 The temperature accuracy of the column heater is evaluated by placing a
calibrated thermometer in the column compartment to measure
the actual compartment temperature.
 The thermometer readings are compared to the preset temperature at 40
and 60°C.
Acceptance:-
The resulting oven temperature from the thermometer display
should be within ±2°C of the set temperature.
Calibration of HPTLC:-
Calibration of HPTLC done
by the following method
Spotting & Detection capacity
Spotting & Detection capacity:-
Requirements:-
Alumina glass plates
Sodium salicylate
96%v/v alcohol
Preparation of stock solution:-
Stock solution-1
Weigh 500 mg of sodium salicylate in 250 ml volumetric flask
dissolve and dilute with 96%v/v alcohol.
Stock solution-2
100 mg of sod.salicylate in 250 ml volumetric flask, dissolve and
dilute with 96% v/v alcohol.
Procedure:-
Spot 5μl of each solution observe at 254 nm, 366 nm.
Acceptance:-
The spots shall be comparable intensity wise.
Spot due to stock solution-2 shall be visible at 254 nm.
Spot due to stock solution-1 shall be visible at 366 nm.
Calibration of Gas chromatography
 Flow rate accuracy
 Column oven temperature accuracy
 System precision
 System precision for head space auto sampler
 Detector linearity
 Detector noise and drift test
Flow rate accuracy:-
 Connect the digital flow meter to the detector outlet port.
 Set the carrier gas flow and wait till it reaches the set flow.
 Note the observed flow in replicate.
 Repeat the procedure for other carrier gases such as Hydrogen
and Air.
Acceptance
 The flow rate of carrier gas should be ±10% of set flow.
S.No Carrier gas Acceptance
criteria in
ml/mt
1. Helium 125
2. Hydrogen 40
3. Air 400
Column oven temperature accuracy
Place the thermometer in the column oven and set the column
oven temperature at 40°C.Wait till the temperature stabilizes.
Note the observed temperature over a period of 10 mts.
Repeat the procedure for 100°C, 150°C and 190°C.
Acceptance
The resulting oven temperature from the thermometer display
should be within ±2°C of the set temperature.
System precision
Transfer 20 ml of methanol,Ethanol and acetone into 100 ml
volumetric flask and make up with ethyl acetate.
Inject blank followed by standard preparation in 6
replicates.Note down the areas and retention times.
Acceptance
The %RSD of retention time should be not more than 1.0% &
peak area NMT 5.0%
System precision for head space auto sampler
 Prepare a standard mixture solution Methylene
dichloride(0.6g),Chloroform(0.06g),Trichloroethane(0.08g),1,4,Dioxane
0.38g) in 50 ml volumetric flask containing 40 ml of Dimethyl
formamide.
 Finally make upto the volume with DMF(Solution-A).
 Take 0.5 ml of standard solution A in 6 different vials and seal caps and crimp.
Place these vials on head space sampler. Prepare a blank vial also.
 Load the vials in head space sampler tray.
 Blank vials followed by the standard vials.
Acceptance
The %RSD of retention time should be NMT 1.0% and Peak area should b
NMT 15.0%
Detector linearity
Detector linearity solutions
10 ml of
Methanol
,Ethanol,
Acetone
make up
to 100 ml
with
Ethyl
acetate
15ml of
Methanol
,Ethanol,
Acetone
make up
to 100 ml
with
Ethyl
acetate
20ml of
Methanol
,Ethanol,
Acetone
make up
to 100 ml
with
Ethyl
acetate
25ml of
Methanol
,Ethanol,
Acetone
make up
to 100 ml
with
Ethyl
acetate
30 ml of
Methanol,
Ethanol,
Acetone
make up
to 100 ml
with
Ethyl
acetate
Solution A Solution B Solution C Solution D Solution E
Procedure:-
Inject blank,followed by detector linearity solutions
and record the peak responses.
Draw a standard plot between the concentration Vs
the peak responses.
Acceptance
The plot should be linear and regression coefficient
should NLT 0.99
Detector noise and Drift test:-
After GC is ready run the system upto 15mts through
single run. After completion of run calculate noise and drift
through software.
Acceptance
Noise NMT 100 μV
Drift NMT 2500μV/hr
Schedule for calibration of major instruments
INSTRUMENT INTERVAL(MONTHS)
HPLC 3 ± 7 days
Gas chromatography 3 ± 7 days
UV-Visible spectrophotometer Monthly once ± 3 days
IR spectrophotometer Monthly once ± 3 days
NMR spectrophotometer 6 ± 15 days
Flourimeter 3 ± 7 days
pH meter Daily
Analytical Balance Daily
References:-
 Journal of Biomedical sciences and research-volume 2(2),
2010, page no:- 89-99.
 Practical pharmaceutical chemistry by A.H.Beckett,
J.B.Stenlake, Part Two, page no:- 326.
 Analytical Method Validation And Instrument Performance
Verification by Herman lam., page no:- 153-186.
Calibration and validation of analytical instruments

Calibration and validation of analytical instruments

  • 1.
    Calibration and Validationof Analytical Instruments A.Solairajan 1st year M.Pharm(Analysis)
  • 2.
    Presentation outline Introduction Calibration Validation Analytical instruments UVVisible Spectrophotometer IR Spectrophotometer Spectrofluorimeter HPLC HPTLC GC
  • 3.
    Introduction Analytical instruments areused for a specific analysis of drugs and pharmaceuticals. So, regular performance verification are made to ensure that the instruments used in the analytical purpose should be properly validated and calibrated “to demonstrate that it is suitable for its intended purpose”.
  • 4.
    Calibration Calibration is aprocess by which ensure that an instrument readings are accurate with reference to established standards. Calibration is performed using primary reference standards. Instruments need to be calibrated before using. For example- weighing balance,p H meter,…….etc
  • 5.
    Need for calibration Calibrationcan be called for:  with a new instrument.  when a specified time period is elapsed.  when a specified usage (operating hours) has elapsed.  when an instrument has had a shock or vibration which potentially may have put it out of calibration.  sudden changes in weather.  whenever observations appear questionable.
  • 6.
    Validation Validation is adetailed process of confirming that the instrument is installed correctly, that it is operating effectively, and that it is performing without error. The field of validation is divided into a number of subsections as follows-  Cleaning validation  Process validation  Analytical method validation  Computer system validation
  • 7.
    Equipment validation It demonstratethat equipment used in validation studies is suitable for use and is comparable to equipment used for routine analysis. Qualification Action of proving and documenting that equipment or ancillary systems are properly installed, work correctly, and actually lead to the expected results. Qualification is part of validation , but the individual qualification steps alone do not constitute process validation.
  • 8.
    Parts of qualification Theactivity of qualifying system of equipment is divided into four subtypes-  Design qualification (DQ)  Installation qualification (IQ)  Operational qualification (OQ)  Performance qualification (PQ)
  • 9.
    Design qualification (DQ)-Demonstrates that the proposed design will satisfy all the requirements that are defined and detailed in the User Requirements Specification. Installation qualification (IQ)- Demonstrates that the process or equipment meets all specifications, is installed correctly, and all required components and documentation needed for continued operation are installed and in place.
  • 10.
    Operational qualification (OQ)-Demonstrates that all facets of the process or equipment are operating correctly. Performance qualification (PQ)- Demonstrates that the process or equipment performs as intended in a consistent manner over time.
  • 11.
    I.Q & O.Q& P.Q Report
  • 12.
    Calibration of UV-VISspectrophotometer  Wavelength accuracy  Stray light  Resolution  Photometric accuracy  Noise  Baseline flatness  Stability
  • 13.
    Reference standards forUV-Vis spectrophotometer
  • 14.
    Wavelength accuracy:- It isdefined as the deviation of the wavelength reading at an absorption band or emission band from the wavelength of the band.
  • 15.
    Test:- Wavelength accuracy verificationis checked by comparing the recorded wavelength of the peak against the value of reference standard. commonly used wavelength standards such as Deuterium lamp, Mercury vapor lamp, Holmium oxide filter, and Holmium oxide solution (4% holmium oxide in 10% perchloric acid in a 1-cm cell)
  • 16.
    Acceptance ±1 nm inthe UV range (200 to 380 nm) and ±3 nm in the visible range (380 to 800 nm). Three repeated scans of the same peak should be within ±0.5 nm. •
  • 17.
    Stray light:- Stray lightis defined as the detected light of any wavelength that is outside the bandwidth of the wavelength selected. Test:- Three test solutions prepared and measured the stray light at 200 nm, 220 nm and 340 nm Acceptance:- The transmittance of the solution in a 1 cm cell should be less than 0.01 or the absorbance value should be greater than 2.
  • 18.
    At 1% transmittance,stray light at 1% of the incident light intensity can cause a 15% drop in absorbance
  • 19.
    Resolution power:- The resolutionof a UV-VIS spectrophotometer is related to its spectral bandwidth(SBW).The smaller the spectral width, the finer the resolution. The SBW depends on the slit width and the dispersive power of the monochromator Test:- 0.02%v/v toluene in hexane is used to test the resolution power of the spectrophotometer. The absorbance measured at 269 nm and 266 nm. Acceptance:- The ratio of the absorbance at 269 nm and absorbance at 266 nm should be grater than 1.5
  • 21.
    Noise:- Noise in themeasurement affects the accuracy at both ends of the absorbance scale. Photon noise from the light source affects the accuracy of the measurements leads to low absorbance. Test:- Air is scanned in the absorbance mode for 10 min.peak to noise is recorded at 500nm.Root mean square noise is then calculated. Acceptance:- The RMS noise should be less than 0.001 AU
  • 23.
    Baseline flatness:- The flatbaseline test demonstrates the ability of the instrument to normalize the light intensity measurement and the spectral output at different wavelengths through out the spectral range. Test:- Air is scanned in the absorbance mode.The highest and lowest deflections in the absorbance unit are recorded. Acceptance:- The deflection is typically less than 0.01AU
  • 25.
    Stability:- The lamp intensityis a function of the age of the lamp, temperature fluctuation, and wavelength of the measurement. These changes can lead to errors in the value of the measurements, over an extended period of time. Test:- Air is scanned in the absorbance mode for 60 min at specific wavelength(340nm).The highest and lowest deflections in the absorbance unit are recorded. Acceptance:- The deflection is less than 0.002 AU/h
  • 27.
    Photometric accuracy:- Photometric accuracyis determined by comparing the difference between the measured absorbance of the reference materials and the established value. Test:- Either neutral density filters or potassium dichromate solutions are used. Acceptance:- Six replicate measurements of the 0.006%w/v potassium dichromate solution at 235, 257, 313 and 350 nm should be less than 0.5% RSD.
  • 29.
    Linearity:- The linear dynamicrange of the measurement is limited by stray light at high absorbance and by noise at low absorbance. The accuracy of the quanitification of the sample depends on the precision and linearity of the measurements. Test:- A series of Potassium dichromate solution of concentration 20,40,60,80 and 100mg/L in 0.005M sulfuric acid. The absorption of various wavelength are plotted against the concentration of the solution and the correlation coefficients are calculated. Acceptance:- Correlation coefficient r≥ 0.999
  • 30.
    Calibration of IRspectrophotometer  Wave number verification  Resolution performance
  • 31.
    Wave number verification:- Preparepolystyrene film with thickness 0.04 mm and verify the wavenumber Observed wavenumber Minimum tolerance Maximum tolerance 3058.5 3061.5 2848.0 2851.0 1941.4 1944.4 1600.2 1602.2 1582.0 1584.0 1153.5 1155.5 1027.3 1029.3
  • 32.
    Resolution performance:- Difference between%T at 2851 cm -1 and 2870 cm -1 Difference between %T at 1583 cm -1 and 1589 cm -1 Limit NLT 18% NLT 12% Actual
  • 33.
    Calibration of spectrofluorimeter Sensitivity of the instrument checked by using primary standard  Prepare 1ppm solution of quinine sulphate solution in 0.1M sulphuric acid.  Primary wavelength set at 366 nm, and check the sensitivity of the instrument.
  • 34.
    Calibration of HPLC Flowrate accuracy Injector accuracy System precision Wavelength accuracy Detector linearity Injector linearity Gradient performance check Column oven temperature accuracy
  • 36.
    Flow rate accuracy:- Theperfoemance of pump module is the ability to maintain accurate and consistent flow of the mobile phase.Poor flow rate will affect the retention time and resolution of the separation. Test:- The flow rate accuracy at 2 ml/min can be verified by using a calibrated stopwatch to measure the time it takes to collect 25 ml of effluent from the pump into a 25 ml volumetric flask Acceptance:- ±2.0% 0f the set flow rate
  • 37.
    Gradient accuracy The accuracyand linearity of the gradient solvent delivery can be verified indirectly by monitoring the absorbance change when the composition of the two solvents from two different channels changes. TEST Channel A is filled with a pure solvent such as methanol and Channel B is filled with a solvent containing a UV-active tracer such as caffeine (ca. 15 mg per liter of solvent).
  • 38.
    The gradient profileis programmed to vary the composition of the mixture from 100% A to 100% B in a short period of time, and then changed back to 100% A in a stepwise manner. If the composition of the 20% A and 80% B mixture is accurate, the height B1 , which corresponds to the absorbance at 80% B The linearity of the gradient delivery can be verified by plotting the absorbance at various mobile-phase composition versus sample compositions.
  • 39.
    System precision:-  Weighaccurately 60 mg of caffeine into 100 ml volumetric flask.  Dissolve and dilute to the volume with mobile phase.Transfer 10 ml of this solution into 100 ml flask and make up with mobile phase.  Inject blank followed by standard preparation in 6 replicates. Note down the areas and retention times. Acceptance:- The % RSD of retention time and peak area should be <1.0%
  • 40.
    Wavelength accuracy:- Inject blankfollowed by standard preparation and note down the height or absorbance. Acceptance:- The maximum absorbance should be ±2 nm.
  • 41.
    Detector linearity:-  Thelinearity of the detector response can be checked by pumping or by filling the flow cell with a series of standard solution of various concentration.  Aqueous caffeine solutions are convenient for the linearity measurement. The correlation coefficient between sample concentration and response can be calculated to determine the linearity. Acceptance:- R≥ 0.999
  • 42.
    Injector linearity:-  Linearityis important for methods that require the use of variable injection volumes.  The linearity of the injector can be demonstrated by making injections, typically 5,10,20,50 and 100 μl to cover the range 0 to 100 μl.  The response of the injection is plotted against the injection volume.  The correlation coefficient of the plot is used in evaluation of the injector linearity. Acceptance:- R≥0.999
  • 43.
    Column oven temperatureaccuracy:-  The efficiency of HPLC column varies with column temperature.  The temperature accuracy of the column heater is evaluated by placing a calibrated thermometer in the column compartment to measure the actual compartment temperature.  The thermometer readings are compared to the preset temperature at 40 and 60°C. Acceptance:- The resulting oven temperature from the thermometer display should be within ±2°C of the set temperature.
  • 44.
    Calibration of HPTLC:- Calibrationof HPTLC done by the following method Spotting & Detection capacity
  • 45.
    Spotting & Detectioncapacity:- Requirements:- Alumina glass plates Sodium salicylate 96%v/v alcohol Preparation of stock solution:- Stock solution-1 Weigh 500 mg of sodium salicylate in 250 ml volumetric flask dissolve and dilute with 96%v/v alcohol. Stock solution-2 100 mg of sod.salicylate in 250 ml volumetric flask, dissolve and dilute with 96% v/v alcohol.
  • 46.
    Procedure:- Spot 5μl ofeach solution observe at 254 nm, 366 nm. Acceptance:- The spots shall be comparable intensity wise. Spot due to stock solution-2 shall be visible at 254 nm. Spot due to stock solution-1 shall be visible at 366 nm.
  • 47.
    Calibration of Gaschromatography  Flow rate accuracy  Column oven temperature accuracy  System precision  System precision for head space auto sampler  Detector linearity  Detector noise and drift test
  • 48.
    Flow rate accuracy:- Connect the digital flow meter to the detector outlet port.  Set the carrier gas flow and wait till it reaches the set flow.  Note the observed flow in replicate.  Repeat the procedure for other carrier gases such as Hydrogen and Air. Acceptance  The flow rate of carrier gas should be ±10% of set flow. S.No Carrier gas Acceptance criteria in ml/mt 1. Helium 125 2. Hydrogen 40 3. Air 400
  • 49.
    Column oven temperatureaccuracy Place the thermometer in the column oven and set the column oven temperature at 40°C.Wait till the temperature stabilizes. Note the observed temperature over a period of 10 mts. Repeat the procedure for 100°C, 150°C and 190°C. Acceptance The resulting oven temperature from the thermometer display should be within ±2°C of the set temperature.
  • 50.
    System precision Transfer 20ml of methanol,Ethanol and acetone into 100 ml volumetric flask and make up with ethyl acetate. Inject blank followed by standard preparation in 6 replicates.Note down the areas and retention times. Acceptance The %RSD of retention time should be not more than 1.0% & peak area NMT 5.0%
  • 51.
    System precision forhead space auto sampler  Prepare a standard mixture solution Methylene dichloride(0.6g),Chloroform(0.06g),Trichloroethane(0.08g),1,4,Dioxane 0.38g) in 50 ml volumetric flask containing 40 ml of Dimethyl formamide.  Finally make upto the volume with DMF(Solution-A).
  • 52.
     Take 0.5ml of standard solution A in 6 different vials and seal caps and crimp. Place these vials on head space sampler. Prepare a blank vial also.  Load the vials in head space sampler tray.  Blank vials followed by the standard vials. Acceptance The %RSD of retention time should be NMT 1.0% and Peak area should b NMT 15.0%
  • 53.
    Detector linearity Detector linearitysolutions 10 ml of Methanol ,Ethanol, Acetone make up to 100 ml with Ethyl acetate 15ml of Methanol ,Ethanol, Acetone make up to 100 ml with Ethyl acetate 20ml of Methanol ,Ethanol, Acetone make up to 100 ml with Ethyl acetate 25ml of Methanol ,Ethanol, Acetone make up to 100 ml with Ethyl acetate 30 ml of Methanol, Ethanol, Acetone make up to 100 ml with Ethyl acetate Solution A Solution B Solution C Solution D Solution E
  • 54.
    Procedure:- Inject blank,followed bydetector linearity solutions and record the peak responses. Draw a standard plot between the concentration Vs the peak responses. Acceptance The plot should be linear and regression coefficient should NLT 0.99
  • 55.
    Detector noise andDrift test:- After GC is ready run the system upto 15mts through single run. After completion of run calculate noise and drift through software. Acceptance Noise NMT 100 μV Drift NMT 2500μV/hr
  • 56.
    Schedule for calibrationof major instruments INSTRUMENT INTERVAL(MONTHS) HPLC 3 ± 7 days Gas chromatography 3 ± 7 days UV-Visible spectrophotometer Monthly once ± 3 days IR spectrophotometer Monthly once ± 3 days NMR spectrophotometer 6 ± 15 days Flourimeter 3 ± 7 days pH meter Daily Analytical Balance Daily
  • 57.
    References:-  Journal ofBiomedical sciences and research-volume 2(2), 2010, page no:- 89-99.  Practical pharmaceutical chemistry by A.H.Beckett, J.B.Stenlake, Part Two, page no:- 326.  Analytical Method Validation And Instrument Performance Verification by Herman lam., page no:- 153-186.