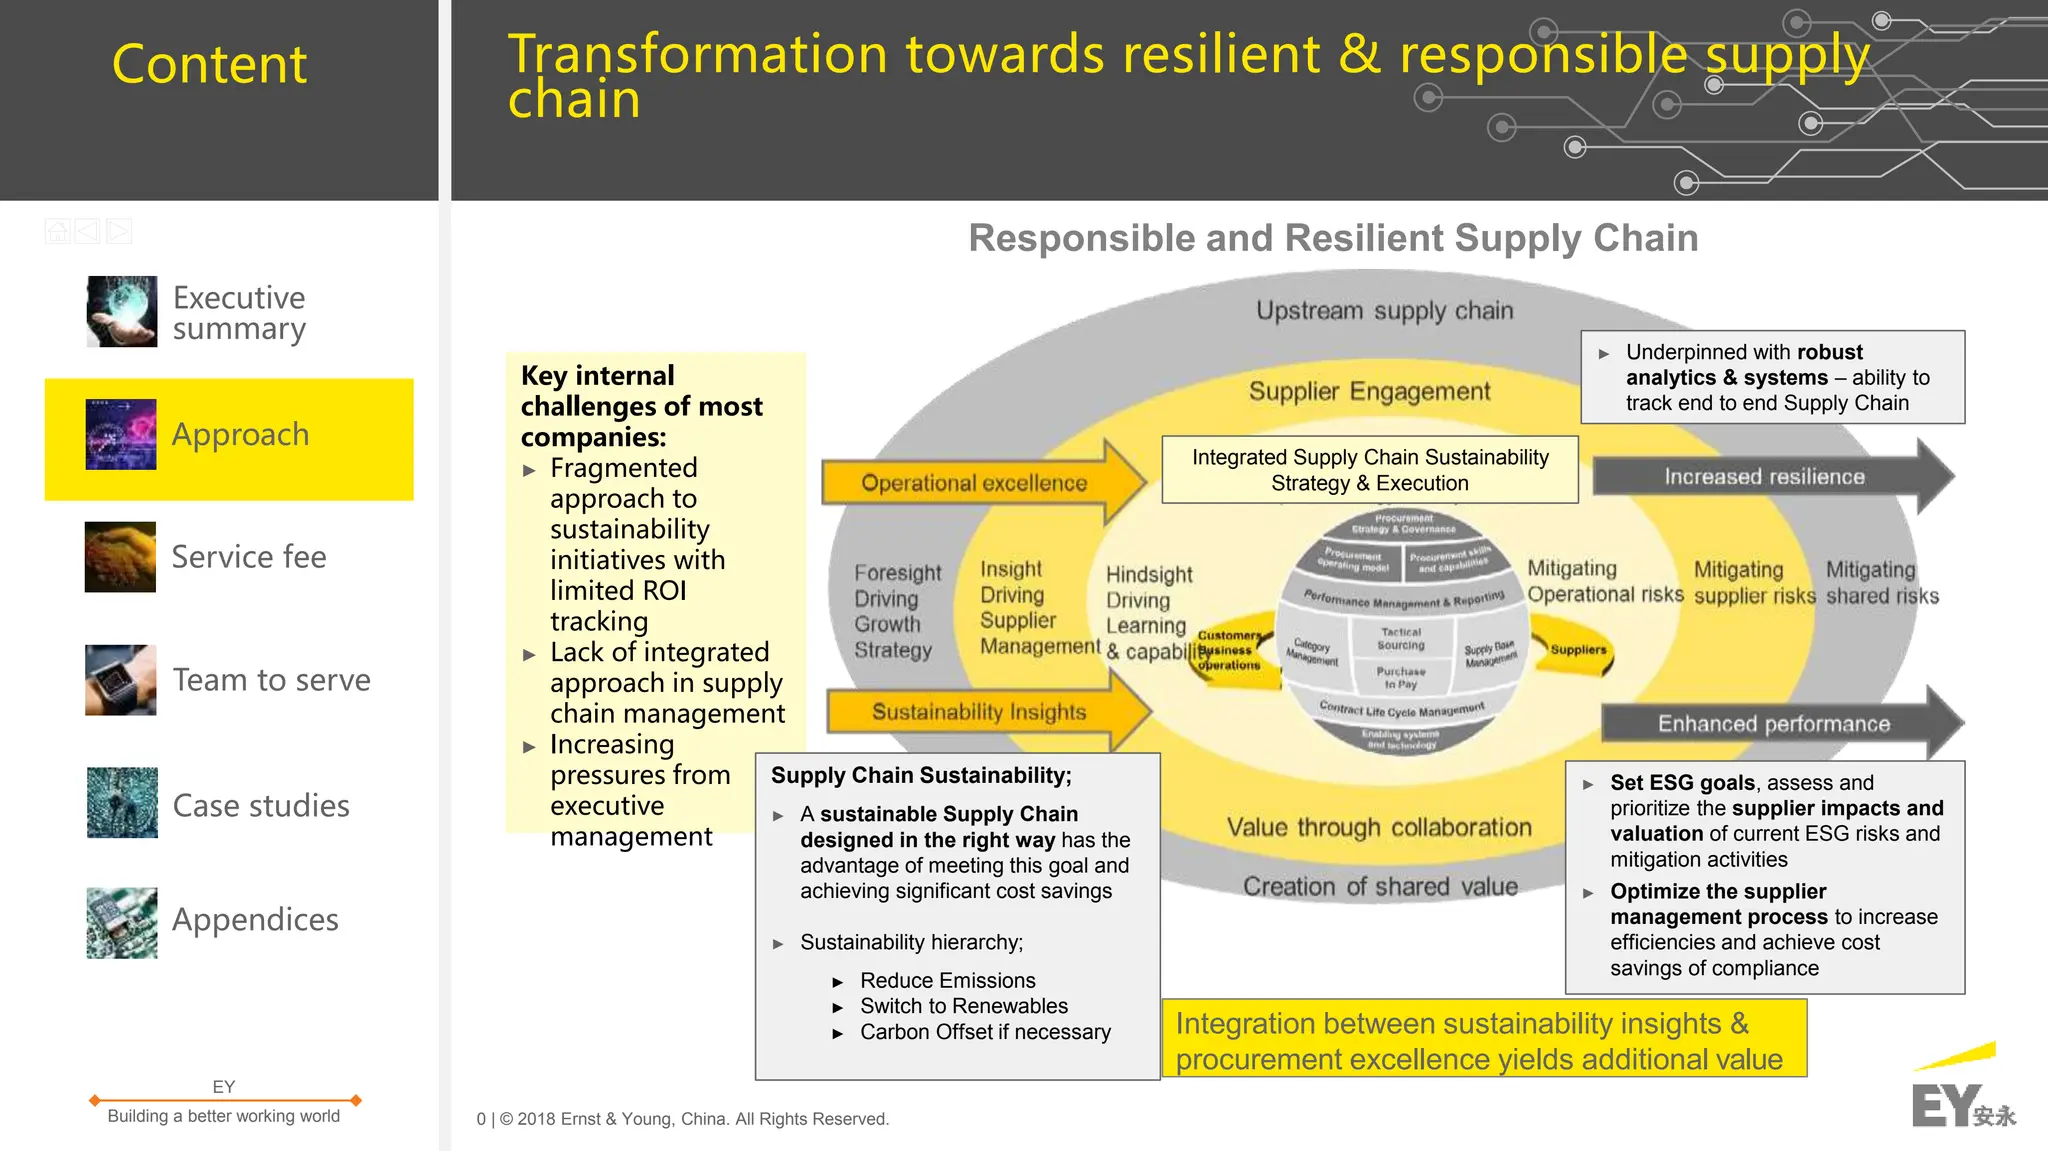
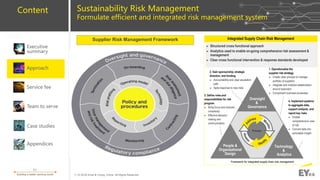
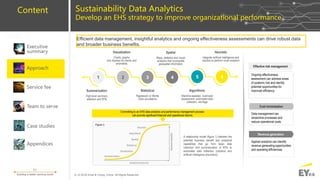
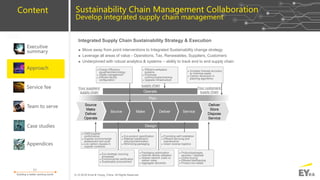
EY
0 | © 2018 Ernst & Young, China. All Rights Reserved.
Building a better working world
Content
Service fee
Executive
summary
Team to serve
Case studies
Appendices
Approach
Transformation towards resilient & responsible supply
chain
Responsible and Resilient Supply Chain
Integration between sustainability insights &
procurement excellence yields additional value
Key internal
challenges of most
companies:
► Fragmented
approach to
sustainability
initiatives with
limited ROI
tracking
► Lack of integrated
approach in supply
chain management
► Increasing
pressures from
executive
management
Supply Chain Sustainability;
► A sustainable Supply Chain
designed in the right way has the
advantage of meeting this goal and
achieving significant cost savings
► Sustainability hierarchy;
► Reduce Emissions
► Switch to Renewables
► Carbon Offset if necessary
Integrated Supply Chain Sustainability
Strategy & Execution
► Underpinned with robust
analytics & systems – ability to
track end to end Supply Chain
► Set ESG goals, assess and
prioritize the supplier impacts and
valuation of current ESG risks and
mitigation activities
► Optimize the supplier
management process to increase
efficiencies and achieve cost
savings of compliance
EY
1 | © 2018 Ernst & Young, China. All Rights Reserved.
Building a better working world
Content
Service fee
Executive
summary
Team to serve
Case studies
Appendices
Approach
Achieving Resilient & Responsible Supply Chains Key Activities
(full service package)
Plan for transitioning
to resilient and
responsible supply
chain.
Assessment of supplier
impacts and valuation
of current program
activities
Address areas of systemic
risk and identify potential
opportunities for improved
efficiency.
Reduce operational cost
through streamlined
processes and data
management Improved supplier
management systems
Enhanced collaboration
and innovation.
Embedding of long
term resilience deep
into supply chains.
Objectives
Outputs
&
Outcomes Articulate drivers
including risks,
consumer demands
and leadership goals.
Identify and place value
on environmental and
social impacts from
supply chain.
Identify improvement
that increases program
efficiencies
Anticipate the regulatory
and business risks and
capture the opportunities
associated with a path to a
low-carbon economy
Identify where costs and
risks overlap
Integrate
management with all
BUs to address risks
and opportunities
management across
the supply chain.
1. Purpose
& goals
2. Measurement
and Valuation
5.Supply Chain
Management
Collaboration
3. Sustainability
Data Analytic
4. Sustainability
Risk Management
Design and implement
data platforms to address
risks and opportunities.
Prioritized heat maps of
where both costs and
risks can be reduced
and value added.
Valuation of current risks
and mitigation activities
EY
2 | © 2018 Ernst & Young, China. All Rights Reserved.
Building a better working world
Content
Service fee
Executive
summary
Team to serve
Case studies
Appendices
Approach
Achieving Resilient & Responsible Supply Chains Key Activities
(individual service)
1.
Sustainability
Risks
Management
and
Valuation
2.
Sustainability
Data
Analytics
3.
Outcome
Measurement
Work
stream
activity
summary
• Co-develop/tailor analytical tools and
enablers
• Co-develop analytical techniques using
available client data
• Define the goals and objectives of
programs/initiatives
• Identify key stakeholders to map the impact
pathway
• Conduct desktop review and identify the
secondary data
Readiness assessment Analysis To-be operating model
• Define the what business to be included
in the scope
• Map the supply chain (tier0 to tier 4)
• Assess organizational data requirements
and data collection processes
• Identify data gaps and areas for future
analysis
• Collect and analyze primary and secondary
data to draw risk insights
• Identify sustainability risks beyond regulatory
and physical risks
• prioritize the level of risks to business
operations with heat-map, scorecard etc.
• Conduct broad stakeholder engagement
using interviews, focus group, survey and
other methods
• Collect secondary data to finalize the
impact pathway and measurement
indicators
• Determine suitable financial proxies and
confidence range
• Design outcome model and populate model with
data collected
• Analyse data and calculate value of impact and
social or environmental benefit-cost ratio
• Sensitivity check to verify the results
• Determine the risk cost and calculate the impact
on business operation
• Develop formal or integrated risk management
framework
• Formulate recommendation plan to mitigate the
corresponding risk
• Leverage data to make the business case for
sustainability programs
• Develop dashboards and reports that assist
with decision-making and risk management
Phase 1 Phase 2 Phase 3
EY
3 | © 2018 Ernst & Young, China. All Rights Reserved.
Building a better working world
Content
Service fee
Executive
summary
Team to serve
Case studies
Appendices
Approach
Articulate drivers including consumer demands and leadership goals
Internal and external engagement
Stakeholder
mapping
Voice of
the business
inquiry
Data
mapping
Targeted
stakeholder
engagement
Existing
activity
review
Market research
Benchmarking Industry reports Social media analysis
Environmental and social hotspots analysis
Identify
top suppliers to
assess
Use sector LCA and social
impact databases to identify
impacts
Analyze supplier
self-reported data
Material issues
Data gathering methods
Environmental
goals
• Water
consumption
• Energy
consumption
• Waste production
• GHG emission
• Chemical usage
Human Capital
• Occupational health
and safety
• Training and
development
• Worker
compensation and
benefit
• Labour compliance
Operational
Practices
• Renewable product
research and design
• Consumer right
protection
• Environmental and
social license
certification
• Integrity and anti-
corruption
Community
• Under-privileged
• Women
• Racial minority
• Disable
• Youth
• Elderly
Define Purpose and Goals
EY
4 | © 2018 Ernst & Young, China. All Rights Reserved.
Building a better working world
Content
Service fee
Executive
summary
Team to serve
Case studies
Appendices
Approach
Outcome measurement
Potential Supplier
SustainabilityImpacts
substances exposure
human trafficking safety
violations
gender discrimination
confidentiality bribery and corruption
payment and conditions dependency
competition and commerce
employment
resilient infrastructure community assistance
worker and consumer health
data protection
IP theft
depletion of natural resource
hazardous materials
emissions and pollution
packaging
Input/ Output
Life Cycle Assessment
Impact Assessment and Valuation
Impact Assessmentand ROI
working hours
Investment B
Who is materially affectedby
the environmental/ social
investment program?
What is the value of the inputs?
What are the outcomes of the
environmental/ social program for
each stakeholder group?
Input
InvestmentB
Output
Outcome
What indicators showthe change
occurred?
What data do we needto
use/collect?
What is the value of the
outcomes?
waste
Return on Investment (ROI):
Scope and identify stakeholders
1. Create the impact map
2. Evidence the outcome with data
3. Establish impact and calculate ROI
Companies are being held responsible for the environmental and social impacts of their suppliers across the entire
value chain. How companies deal with issues of sustainable certifications, labor practices and sustainable sourcing
strategies are critical to a company’s consumer perceptions and regulatorycompliance.
EY
5 | © 2018 Ernst & Young, China. All Rights Reserved.
Building a better working world
Content
Service fee
Executive
summary
Team to serve
Case studies
Appendices
Approach
Sustainability Risk Management
Identify risks in business operations
Six critical areas of supplier risk
Commercial Execution Information Regulatory Continuity Strategic
Risk
examples
► Commodity price volatility
► Exchange rate volatility
► Parallel trade
► Wage inflation
► Contract exposure
► Contract non-compliance
► Supplier’s market risk
(passed through pricing)
► Country specific
distribution channels
► Delivery
► Performance (SLAs)
► Quality
► Component or
service Integration
► Suppliers/partner
operating licensing
► Intellectual property
theft
► Customer data
► Competitive data
► Patient theft data
violations
► Data integration with
suppliers/partners
► Corruption
(FCPA, UK Bribery, etc.)
► Conflict minerals
(Dodd-Frank, etc.)
► Accountability and transparency
(FDA regulations, etc.)
► Trade sanctions (OFAC)
► Workplace practices (labor, EHS, etc.)
► Local government regulations/tax
► Marketing authorization requests
► Pharmacovigilance (compliance)
► Supply availability
► Supply disruption
► Supplier failure
► Product/support
discontinuation
► External operations
capacity(co-
manufacturing)
► Environmental
sustainability
► Customer returns
► Brand/reputation
► Supplier
dependency
(hostage taking,
etc.)
► Unplanned
obsolescence
► Counterfeiting
► Environmental
sustainability
Define variables for
desired outcomes
► Risk attributes
► Scope, geographies,
languages
► Keywords
Internal & External
data sources
Company A:
• Hazardous materials: gaps in material inspections
Company B:
• Lack of policy and procedures on child labour protection
• No measures on reducing air emission
Company C:
• Long working hours which violated the local regulations
• Inadequate wages less than minimum wage requirement
Insight Based Risk Analytic Tools
EY
6 | © 2018 Ernst & Young, China. All Rights Reserved.
Building a better working world
Content
Service fee
Executive
summary
Team to serve
Case studies
Appendices
Approach
Sustainability Risk Management
Prioritize the risk level and monetarize the business impacts
Example
Findings
Supplier risk has a cost that can be measured and
managed resulting in financial improvement
Quantified costs of risk
Cost of supplier replacement
Product
cost
Cost of GHG and air emission
Cost of damage on reputation
Cost of labour and community disputes
i
Regulatory/compliance expense
Increasing sourcing cost due to climate
change
Total
product
cost
Countries
Categories
Direct/ Indirect
Workforce
Spend
Brand proximity
Dependency
Issues/ Materiality
RISK
Typically a phased multi-year program
RISK
Inherent
risk
APPLY ACROSS THE VALUE CHAIN
RAWS FACTORIES
INFLUENCE
VENDORS DISTRIBUTION
INFLUENCE
Company-specific
CATEGORIES
Low Medium High
Strategic Suppliers
Low Medium High
Core Suppliers
Low Medium High
Transactional Suppliers
Sphere of influence
SEGMENTATION INFORMS PROGRAM STRATEGY
EY
7 | © 2018 Ernst & Young, China. All Rights Reserved.
Building a better working world
Content
Service fee
Executive
summary
Team to serve
Case studies
Appendices
Approach
Integrated Supply Chain Risk Management
► Structured cross functional approach
► Analytics used to enable on-going comprehensive risk assessment &
management
► Clear cross functional intervention & response standards developed
Technology
&
Analytics
People &
Organizational
Design
Oversight
&
Governance
2. Gain sponsorship, strategic
direction, and funding
► Accountability and clear escalation
path
► Agile response to new risks
3. Define roles and
responsibilities for risk
program
► Bring focus and reduced
complexity
► Effective decision
making and
communication
1. Operationalize the
supplier risk strategy
► Create clear process to manage
portfolio of suppliers
► Integrate and mobilize stakeholders
around execution
► Compliment business processes
4. Implement systems
to aggregate data,
support analysis, and
report key risks
► Enable
comprehensive view
of risk
► Convert data into
actionable insight
Framework for integrated supply chain risk management
Process
Sustainability Risk Management
Formulate efficient and integrated risk management system
Supplier Risk Management Framework
EY
8 | © 2018 Ernst & Young, China. All Rights Reserved.
Building a better working world
Content
Service fee
Executive
summary
Team to serve
Case studies
Appendices
Approach
Sustainability Data Analytics
Develop an EHS strategy to improve organizational performance
Effective risk management
Cost minimization
Revenue generation
Ongoing effectiveness
assessment can address areas
of systemic risk and identify
potential opportunities for
improved efficiency.
Data management can
streamline processes and
reduce operational costs.
Applied analytics can identify
revenue generating opportunities
and operating efficiencies.
Committing to an EHS data analytics and performance management process
can provide significant financial and operational returns.
1 2 3 4 5 6
Summarization
High-level summary
statistics and KPls
Spatial
Maps, statistics and visual
analytics that incorporate
geospatial information
Visualization
Charts, graphs
and displays for trends and
anomalies
Statistical
Regression or Monte
Carlo simulations
Algorithmic
Machine-assisted, routinized
assessment; automated data
collection, red flags
Heuristic
integrate artificial intelligence and
robotics to perform novel analytics
A relationship model (figure 1) between the
potential business benefit and analytical
capabilities that go from basic data
collection and summarization of KPIs to
automated data collection (robotics) and
artificial intelligence (heuristics).
Efficient data management, insightful analytics and ongoing effectiveness assessments can drive robust data
and broader business benefits.
EY
9 | © 2018 Ernst & Young, China. All Rights Reserved.
Building a better working world
Content
Service fee
Executive
summary
Team to serve
Case studies
Appendices
Approach
Sustainability Chain Management Collaboration
Develop integrated supply chain management
Integrated Supply Chain Sustainability Strategy & Execution
► Move away from point interventions to Integrated Sustainability change strategy
► Leverage all areas of value - Operations, Tax, Renewables, Suppliers, Customers
► Underpinned with robust analytics & systems – ability to track end to end supply chain
Operate
Plan
Source
Make
Deliver
Operate
Make Deliver Service
Source
Deliver
Store
Dispose
Service
Design
► Energy Efficiency
equipment/technology
► Waste management
► Efficient facility
configuration
► Efficient workplace
systems
► Employee
communication/training
► Upgrade infrastructure
► Increase forecast accuracy
to minimize waste
► Carbon dimension in
planning algorithms
► CMO/supplier
conformance
► Supplier environmental
assessment and audit
► Low carbon clauses in
supplier contracts
► Eco-product specification
► Material substitution/
reduction/elimination
► Minimizing packaging
► Promoting self installation
► Efficient servicing and
maintenance
► Green reverse logistics
► Eco-strategic sourcing
processes
► Environmental certification
► Sustainable procurement
► Packaging optimization
► Optimal vehicle utilization
► Assess network costs vs
carbon miles
► Aggregate deliveries
► Product/packages
recovery / disposal
► Online buying
► Efficient backhauling
► Product eco-labels
supply chain
Your customers’
supply chain
Your suppliers’
supply chain

EY - Supply Chain Services 2018_template.pptx

  • 1.
    EY 0 | ©2018 Ernst & Young, China. All Rights Reserved. Building a better working world Content Service fee Executive summary Team to serve Case studies Appendices Approach Transformation towards resilient & responsible supply chain Responsible and Resilient Supply Chain Integration between sustainability insights & procurement excellence yields additional value Key internal challenges of most companies: ► Fragmented approach to sustainability initiatives with limited ROI tracking ► Lack of integrated approach in supply chain management ► Increasing pressures from executive management Supply Chain Sustainability; ► A sustainable Supply Chain designed in the right way has the advantage of meeting this goal and achieving significant cost savings ► Sustainability hierarchy; ► Reduce Emissions ► Switch to Renewables ► Carbon Offset if necessary Integrated Supply Chain Sustainability Strategy & Execution ► Underpinned with robust analytics & systems – ability to track end to end Supply Chain ► Set ESG goals, assess and prioritize the supplier impacts and valuation of current ESG risks and mitigation activities ► Optimize the supplier management process to increase efficiencies and achieve cost savings of compliance
  • 2.
    EY 1 | ©2018 Ernst & Young, China. All Rights Reserved. Building a better working world Content Service fee Executive summary Team to serve Case studies Appendices Approach Achieving Resilient & Responsible Supply Chains Key Activities (full service package) Plan for transitioning to resilient and responsible supply chain. Assessment of supplier impacts and valuation of current program activities Address areas of systemic risk and identify potential opportunities for improved efficiency. Reduce operational cost through streamlined processes and data management Improved supplier management systems Enhanced collaboration and innovation. Embedding of long term resilience deep into supply chains. Objectives Outputs & Outcomes Articulate drivers including risks, consumer demands and leadership goals. Identify and place value on environmental and social impacts from supply chain. Identify improvement that increases program efficiencies Anticipate the regulatory and business risks and capture the opportunities associated with a path to a low-carbon economy Identify where costs and risks overlap Integrate management with all BUs to address risks and opportunities management across the supply chain. 1. Purpose & goals 2. Measurement and Valuation 5.Supply Chain Management Collaboration 3. Sustainability Data Analytic 4. Sustainability Risk Management Design and implement data platforms to address risks and opportunities. Prioritized heat maps of where both costs and risks can be reduced and value added. Valuation of current risks and mitigation activities
  • 3.
    EY 2 | ©2018 Ernst & Young, China. All Rights Reserved. Building a better working world Content Service fee Executive summary Team to serve Case studies Appendices Approach Achieving Resilient & Responsible Supply Chains Key Activities (individual service) 1. Sustainability Risks Management and Valuation 2. Sustainability Data Analytics 3. Outcome Measurement Work stream activity summary • Co-develop/tailor analytical tools and enablers • Co-develop analytical techniques using available client data • Define the goals and objectives of programs/initiatives • Identify key stakeholders to map the impact pathway • Conduct desktop review and identify the secondary data Readiness assessment Analysis To-be operating model • Define the what business to be included in the scope • Map the supply chain (tier0 to tier 4) • Assess organizational data requirements and data collection processes • Identify data gaps and areas for future analysis • Collect and analyze primary and secondary data to draw risk insights • Identify sustainability risks beyond regulatory and physical risks • prioritize the level of risks to business operations with heat-map, scorecard etc. • Conduct broad stakeholder engagement using interviews, focus group, survey and other methods • Collect secondary data to finalize the impact pathway and measurement indicators • Determine suitable financial proxies and confidence range • Design outcome model and populate model with data collected • Analyse data and calculate value of impact and social or environmental benefit-cost ratio • Sensitivity check to verify the results • Determine the risk cost and calculate the impact on business operation • Develop formal or integrated risk management framework • Formulate recommendation plan to mitigate the corresponding risk • Leverage data to make the business case for sustainability programs • Develop dashboards and reports that assist with decision-making and risk management Phase 1 Phase 2 Phase 3
  • 4.
    EY 3 | ©2018 Ernst & Young, China. All Rights Reserved. Building a better working world Content Service fee Executive summary Team to serve Case studies Appendices Approach Articulate drivers including consumer demands and leadership goals Internal and external engagement Stakeholder mapping Voice of the business inquiry Data mapping Targeted stakeholder engagement Existing activity review Market research Benchmarking Industry reports Social media analysis Environmental and social hotspots analysis Identify top suppliers to assess Use sector LCA and social impact databases to identify impacts Analyze supplier self-reported data Material issues Data gathering methods Environmental goals • Water consumption • Energy consumption • Waste production • GHG emission • Chemical usage Human Capital • Occupational health and safety • Training and development • Worker compensation and benefit • Labour compliance Operational Practices • Renewable product research and design • Consumer right protection • Environmental and social license certification • Integrity and anti- corruption Community • Under-privileged • Women • Racial minority • Disable • Youth • Elderly Define Purpose and Goals
  • 5.
    EY 4 | ©2018 Ernst & Young, China. All Rights Reserved. Building a better working world Content Service fee Executive summary Team to serve Case studies Appendices Approach Outcome measurement Potential Supplier SustainabilityImpacts substances exposure human trafficking safety violations gender discrimination confidentiality bribery and corruption payment and conditions dependency competition and commerce employment resilient infrastructure community assistance worker and consumer health data protection IP theft depletion of natural resource hazardous materials emissions and pollution packaging Input/ Output Life Cycle Assessment Impact Assessment and Valuation Impact Assessmentand ROI working hours Investment B Who is materially affectedby the environmental/ social investment program? What is the value of the inputs? What are the outcomes of the environmental/ social program for each stakeholder group? Input InvestmentB Output Outcome What indicators showthe change occurred? What data do we needto use/collect? What is the value of the outcomes? waste Return on Investment (ROI): Scope and identify stakeholders 1. Create the impact map 2. Evidence the outcome with data 3. Establish impact and calculate ROI Companies are being held responsible for the environmental and social impacts of their suppliers across the entire value chain. How companies deal with issues of sustainable certifications, labor practices and sustainable sourcing strategies are critical to a company’s consumer perceptions and regulatorycompliance.
  • 6.
    EY 5 | ©2018 Ernst & Young, China. All Rights Reserved. Building a better working world Content Service fee Executive summary Team to serve Case studies Appendices Approach Sustainability Risk Management Identify risks in business operations Six critical areas of supplier risk Commercial Execution Information Regulatory Continuity Strategic Risk examples ► Commodity price volatility ► Exchange rate volatility ► Parallel trade ► Wage inflation ► Contract exposure ► Contract non-compliance ► Supplier’s market risk (passed through pricing) ► Country specific distribution channels ► Delivery ► Performance (SLAs) ► Quality ► Component or service Integration ► Suppliers/partner operating licensing ► Intellectual property theft ► Customer data ► Competitive data ► Patient theft data violations ► Data integration with suppliers/partners ► Corruption (FCPA, UK Bribery, etc.) ► Conflict minerals (Dodd-Frank, etc.) ► Accountability and transparency (FDA regulations, etc.) ► Trade sanctions (OFAC) ► Workplace practices (labor, EHS, etc.) ► Local government regulations/tax ► Marketing authorization requests ► Pharmacovigilance (compliance) ► Supply availability ► Supply disruption ► Supplier failure ► Product/support discontinuation ► External operations capacity(co- manufacturing) ► Environmental sustainability ► Customer returns ► Brand/reputation ► Supplier dependency (hostage taking, etc.) ► Unplanned obsolescence ► Counterfeiting ► Environmental sustainability Define variables for desired outcomes ► Risk attributes ► Scope, geographies, languages ► Keywords Internal & External data sources Company A: • Hazardous materials: gaps in material inspections Company B: • Lack of policy and procedures on child labour protection • No measures on reducing air emission Company C: • Long working hours which violated the local regulations • Inadequate wages less than minimum wage requirement Insight Based Risk Analytic Tools
  • 7.
    EY 6 | ©2018 Ernst & Young, China. All Rights Reserved. Building a better working world Content Service fee Executive summary Team to serve Case studies Appendices Approach Sustainability Risk Management Prioritize the risk level and monetarize the business impacts Example Findings Supplier risk has a cost that can be measured and managed resulting in financial improvement Quantified costs of risk Cost of supplier replacement Product cost Cost of GHG and air emission Cost of damage on reputation Cost of labour and community disputes i Regulatory/compliance expense Increasing sourcing cost due to climate change Total product cost Countries Categories Direct/ Indirect Workforce Spend Brand proximity Dependency Issues/ Materiality RISK Typically a phased multi-year program RISK Inherent risk APPLY ACROSS THE VALUE CHAIN RAWS FACTORIES INFLUENCE VENDORS DISTRIBUTION INFLUENCE Company-specific CATEGORIES Low Medium High Strategic Suppliers Low Medium High Core Suppliers Low Medium High Transactional Suppliers Sphere of influence SEGMENTATION INFORMS PROGRAM STRATEGY
  • 8.
    EY 7 | ©2018 Ernst & Young, China. All Rights Reserved. Building a better working world Content Service fee Executive summary Team to serve Case studies Appendices Approach Integrated Supply Chain Risk Management ► Structured cross functional approach ► Analytics used to enable on-going comprehensive risk assessment & management ► Clear cross functional intervention & response standards developed Technology & Analytics People & Organizational Design Oversight & Governance 2. Gain sponsorship, strategic direction, and funding ► Accountability and clear escalation path ► Agile response to new risks 3. Define roles and responsibilities for risk program ► Bring focus and reduced complexity ► Effective decision making and communication 1. Operationalize the supplier risk strategy ► Create clear process to manage portfolio of suppliers ► Integrate and mobilize stakeholders around execution ► Compliment business processes 4. Implement systems to aggregate data, support analysis, and report key risks ► Enable comprehensive view of risk ► Convert data into actionable insight Framework for integrated supply chain risk management Process Sustainability Risk Management Formulate efficient and integrated risk management system Supplier Risk Management Framework
  • 9.
    EY 8 | ©2018 Ernst & Young, China. All Rights Reserved. Building a better working world Content Service fee Executive summary Team to serve Case studies Appendices Approach Sustainability Data Analytics Develop an EHS strategy to improve organizational performance Effective risk management Cost minimization Revenue generation Ongoing effectiveness assessment can address areas of systemic risk and identify potential opportunities for improved efficiency. Data management can streamline processes and reduce operational costs. Applied analytics can identify revenue generating opportunities and operating efficiencies. Committing to an EHS data analytics and performance management process can provide significant financial and operational returns. 1 2 3 4 5 6 Summarization High-level summary statistics and KPls Spatial Maps, statistics and visual analytics that incorporate geospatial information Visualization Charts, graphs and displays for trends and anomalies Statistical Regression or Monte Carlo simulations Algorithmic Machine-assisted, routinized assessment; automated data collection, red flags Heuristic integrate artificial intelligence and robotics to perform novel analytics A relationship model (figure 1) between the potential business benefit and analytical capabilities that go from basic data collection and summarization of KPIs to automated data collection (robotics) and artificial intelligence (heuristics). Efficient data management, insightful analytics and ongoing effectiveness assessments can drive robust data and broader business benefits.
  • 10.
    EY 9 | ©2018 Ernst & Young, China. All Rights Reserved. Building a better working world Content Service fee Executive summary Team to serve Case studies Appendices Approach Sustainability Chain Management Collaboration Develop integrated supply chain management Integrated Supply Chain Sustainability Strategy & Execution ► Move away from point interventions to Integrated Sustainability change strategy ► Leverage all areas of value - Operations, Tax, Renewables, Suppliers, Customers ► Underpinned with robust analytics & systems – ability to track end to end supply chain Operate Plan Source Make Deliver Operate Make Deliver Service Source Deliver Store Dispose Service Design ► Energy Efficiency equipment/technology ► Waste management ► Efficient facility configuration ► Efficient workplace systems ► Employee communication/training ► Upgrade infrastructure ► Increase forecast accuracy to minimize waste ► Carbon dimension in planning algorithms ► CMO/supplier conformance ► Supplier environmental assessment and audit ► Low carbon clauses in supplier contracts ► Eco-product specification ► Material substitution/ reduction/elimination ► Minimizing packaging ► Promoting self installation ► Efficient servicing and maintenance ► Green reverse logistics ► Eco-strategic sourcing processes ► Environmental certification ► Sustainable procurement ► Packaging optimization ► Optimal vehicle utilization ► Assess network costs vs carbon miles ► Aggregate deliveries ► Product/packages recovery / disposal ► Online buying ► Efficient backhauling ► Product eco-labels supply chain Your customers’ supply chain Your suppliers’ supply chain

Editor's Notes

  • #4 A TOC (also referred to as a story of change or a logic model) articulates how stakeholders are involved in the program and their perception and belief of i) how their lives will change, and importantly ii) validated as the experience of change that has occurred. It will be best to target the demonstrated change in the TOC. The TOC depicts the logical relationships between the inputs, activities, outputs and outcomes of a program or initiative