Downloaded 2,143 times
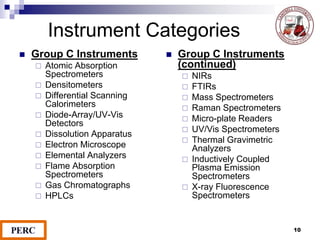
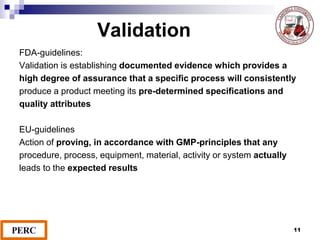
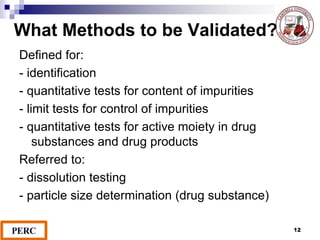
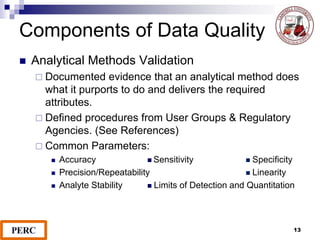
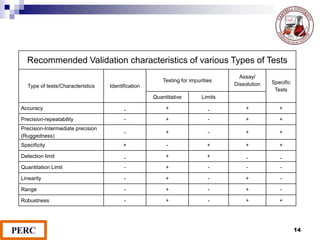
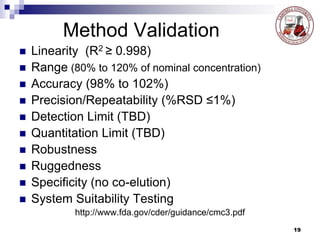
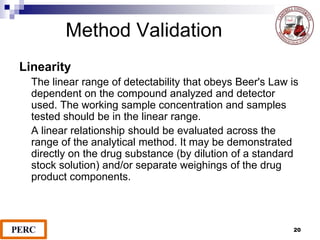
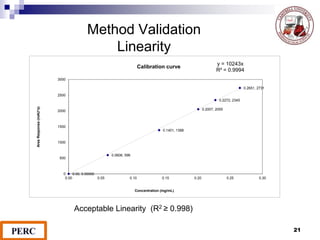

This document discusses analytical method validation. It provides definitions and guidelines for validating analytical methods from regulatory agencies. Key aspects of method validation discussed include accuracy, precision, specificity, range, linearity, limits of detection and quantification. Validation parameters are described for different types of analytical tests including identification, quantitative impurity tests and assays. Guidelines are provided for qualifying analytical instrumentation and categorizing instruments based on complexity.