Downloaded 305 times
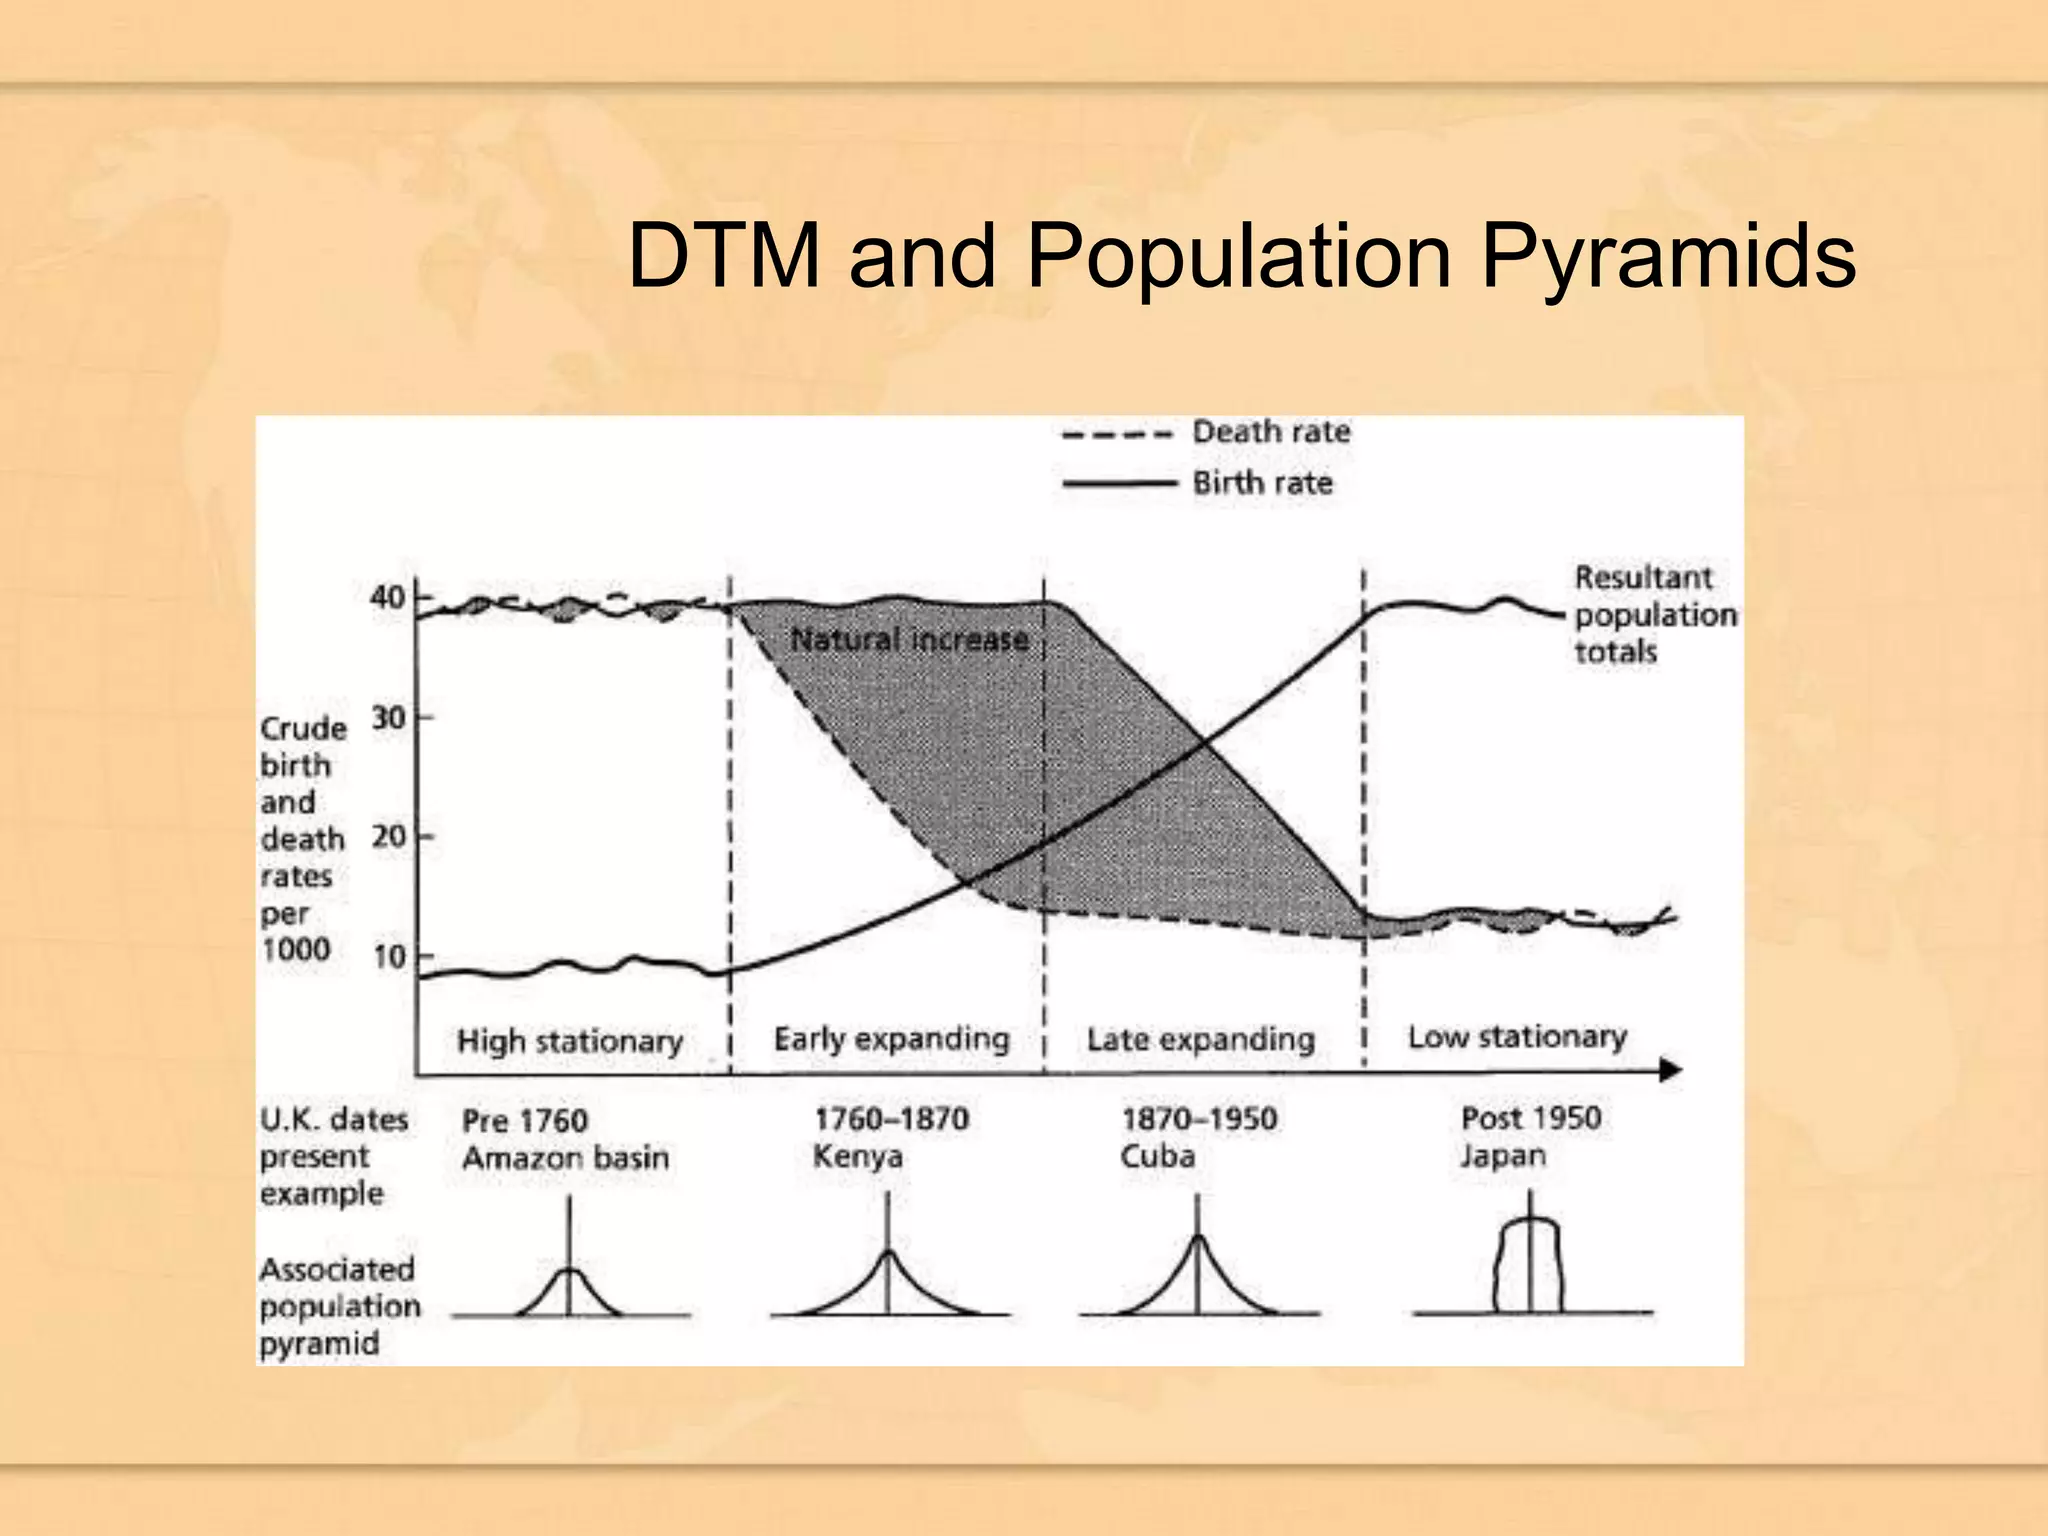
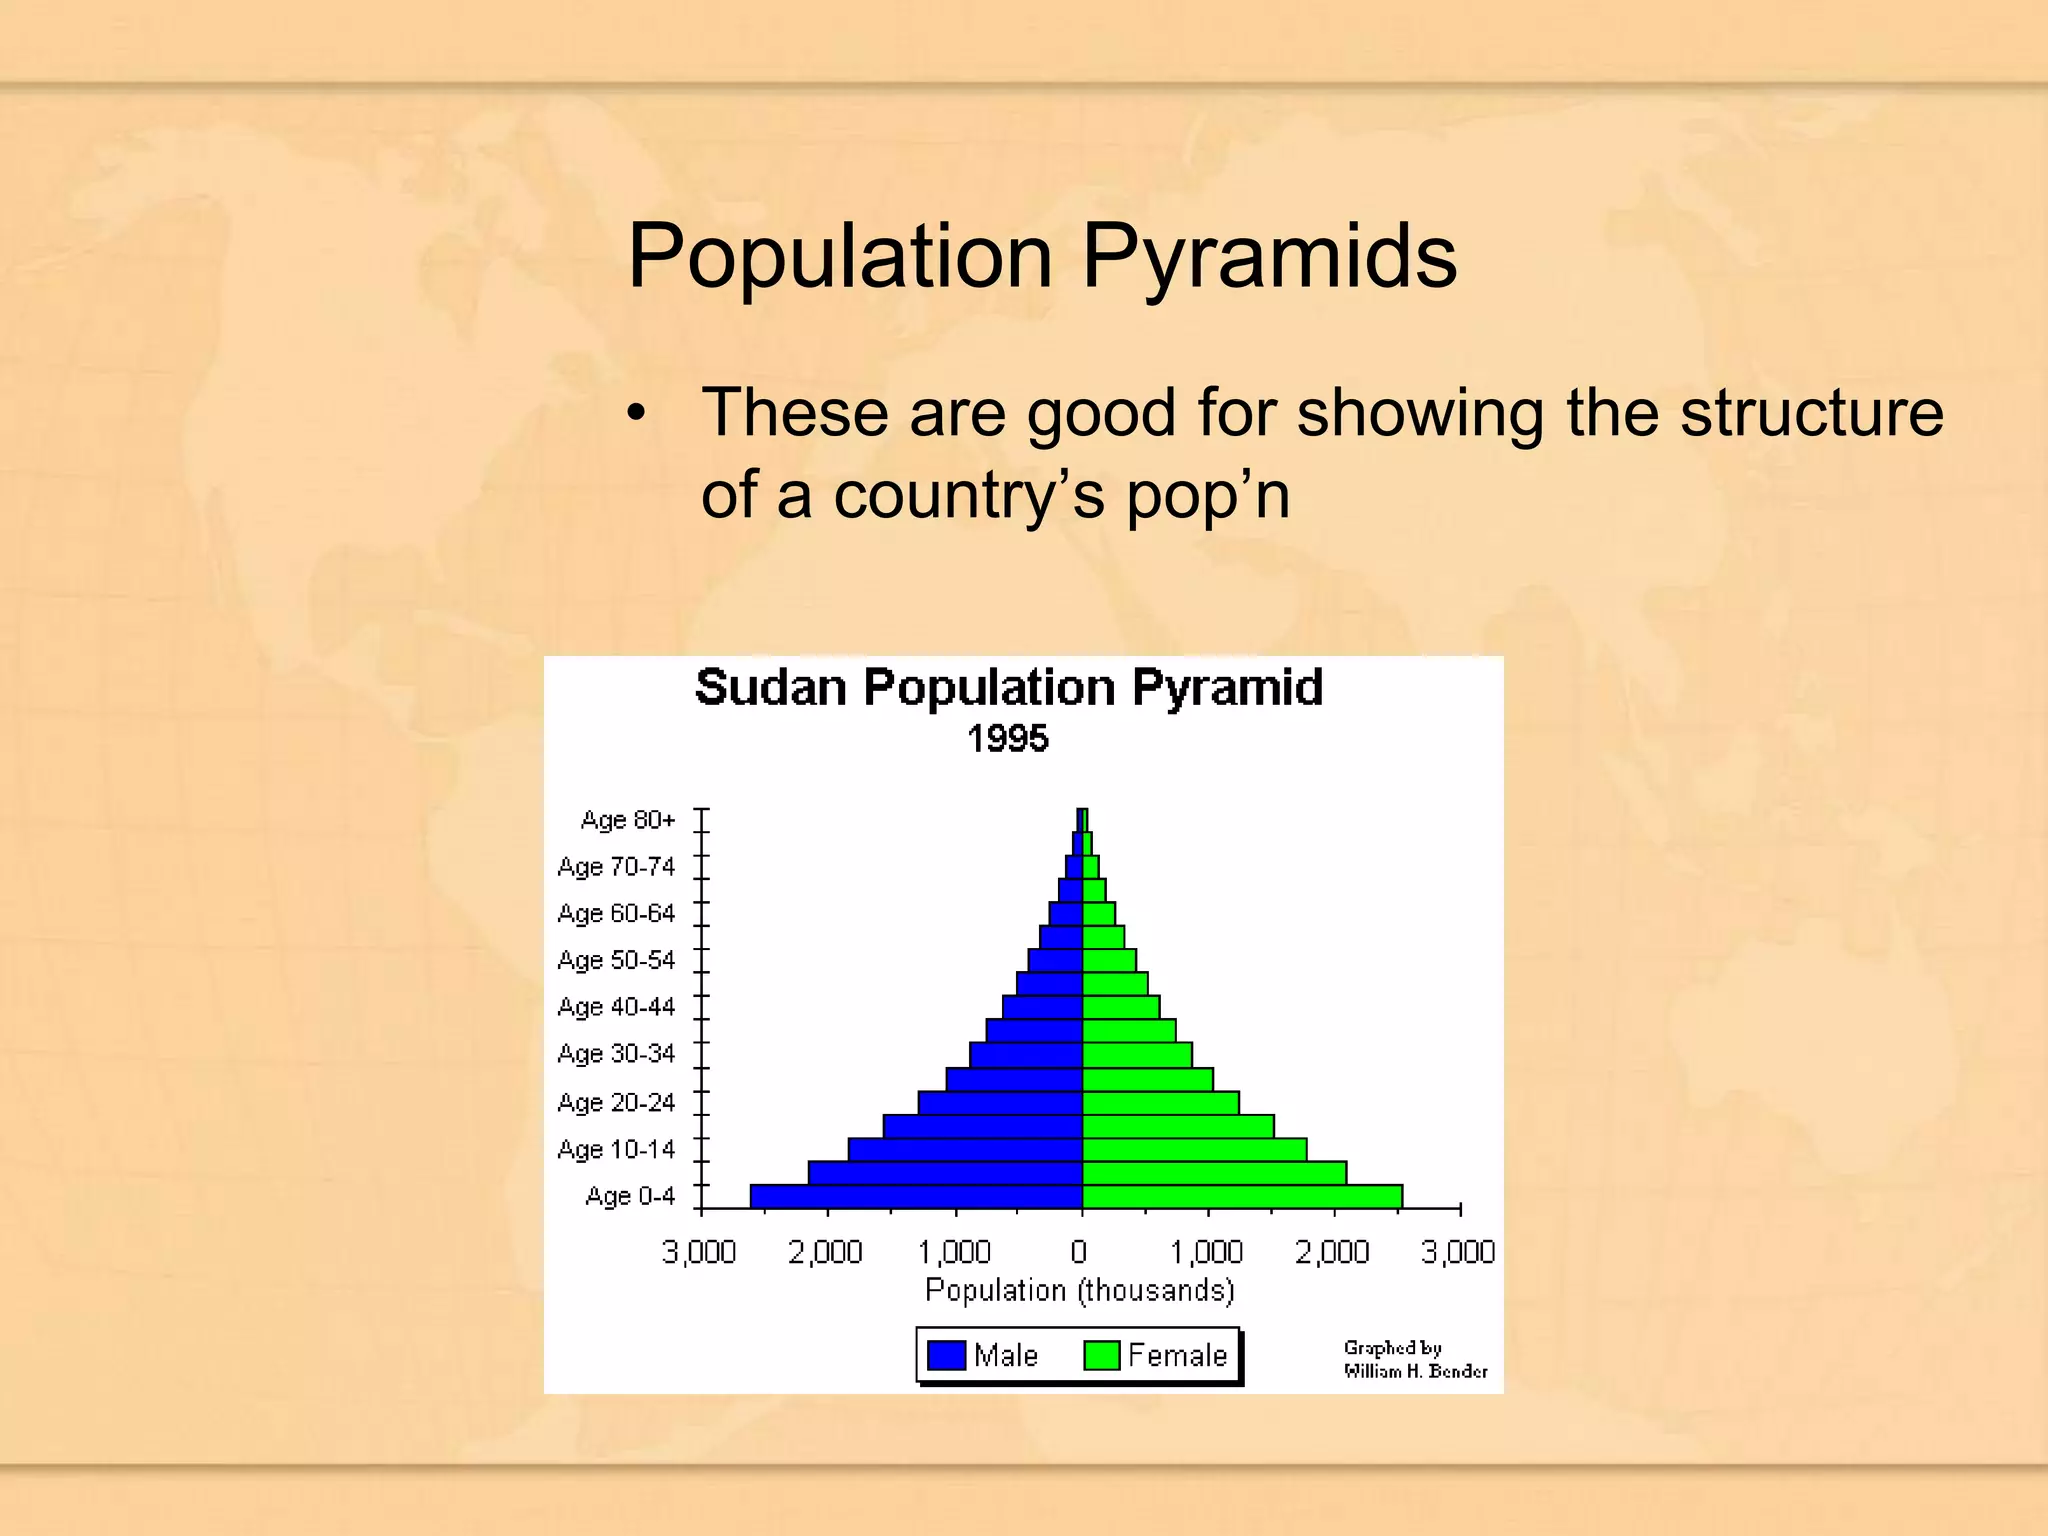
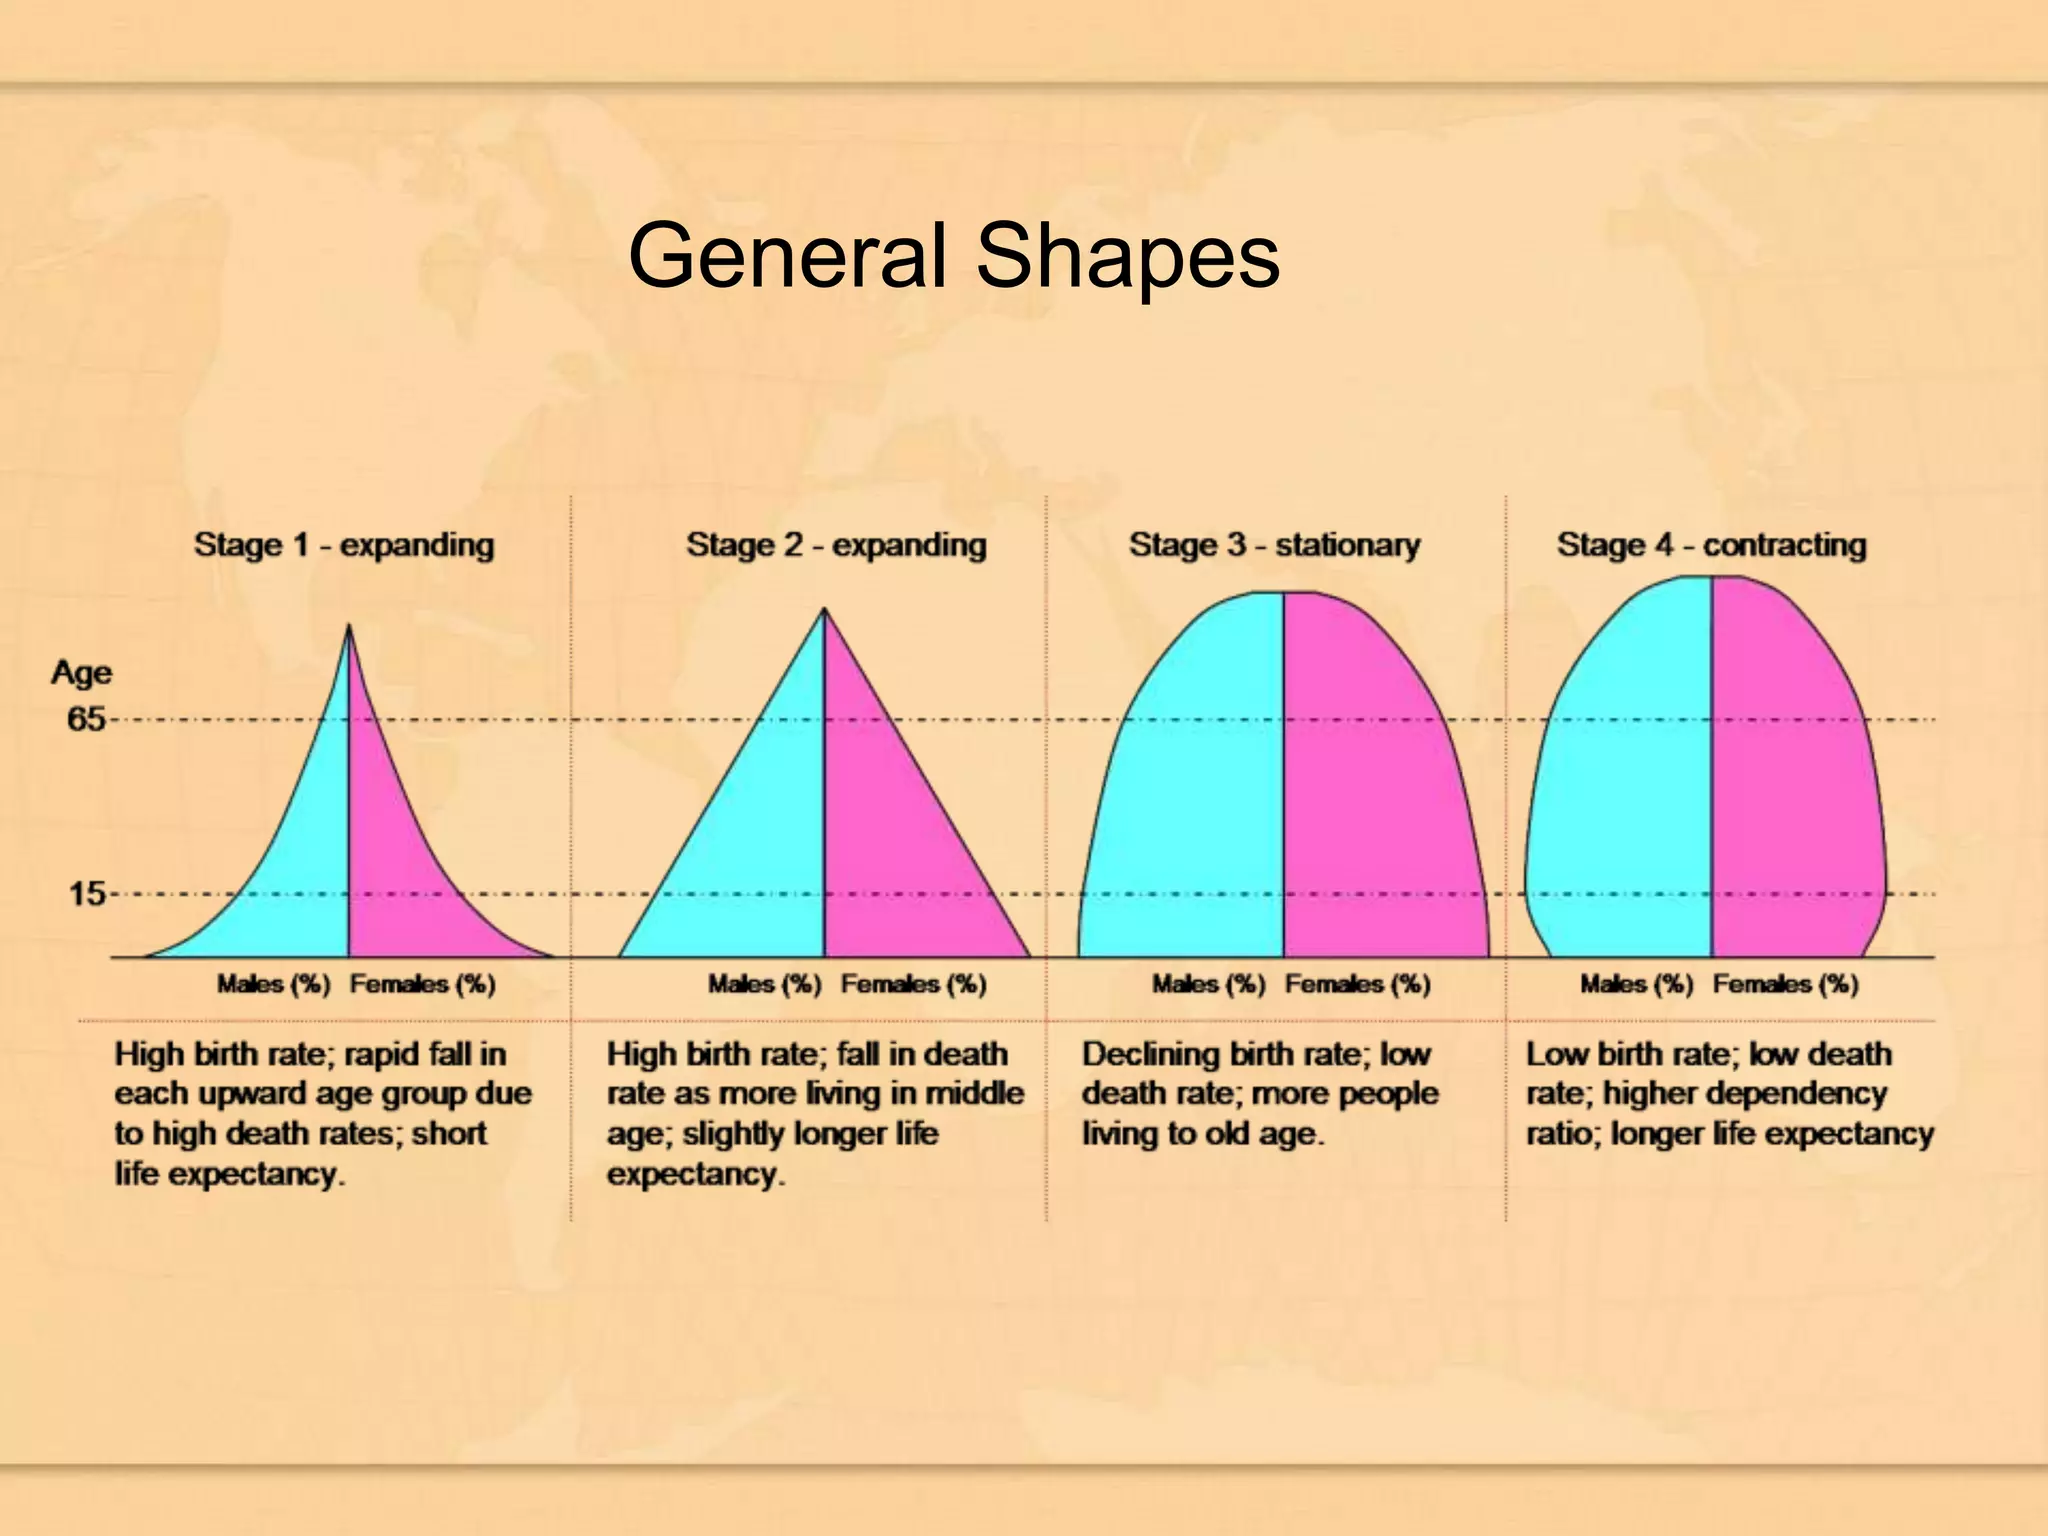

The Demographic Transition Model (DTM) is a model that shows population change over time as countries progress through four to five stages of development. It suggests that as countries industrialize, death rates fall before birth rates, leading to population growth. Eventually, birth rates also fall. The DTM helps explain population changes in industrialized countries, but is less relevant for non-industrialized nations. Population pyramids can reveal a country's population structure and predict future changes based on birth and death rates of different age groups. They may indicate issues like an aging population or low life expectancy.