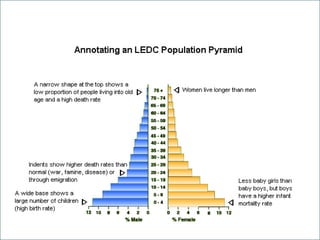
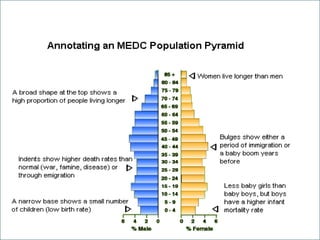
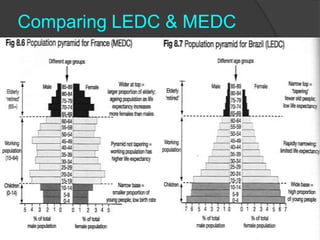
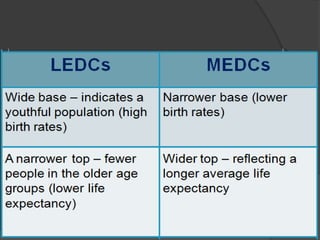
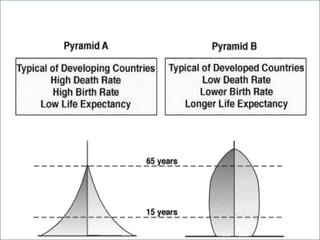
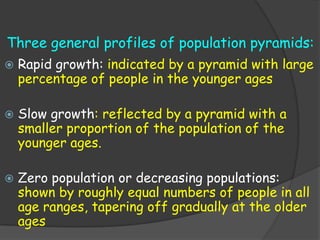
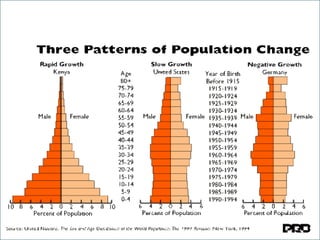
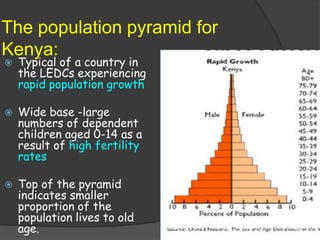
The interpretation of age / sex pyramids
POPULATION STRUCTURE:
   is the number of males and females in
    different age groups.

   The common method to show the structure
    is by a population pyramid.

   This diagram is made up by putting two bar
    graphs (one for male, one for female) side
    by side.

   From this you can read off what percentage
    of a population is of a certain gender and
    age range.
Key things to know about population pyramids:
   Population is divided into 5 year age groups.

   Horizontal line represents the percentage of male
    & female group

   The age groups are divided into 3 groups:
     Young dependent (0-14 years old)
     Working Population (15-64 years old)
     Elderly Dependent (65+ years old)


   Population is divided into males and females.

   The percentage of each age /sex group is given.
What does the shape of the
population pyramids tell us?

 Information    of birth and death rates

 Information    of life expectancy

 People   living in a particular country or
 place
Comparing LEDC & MEDC
Three general profiles of population pyramids:
   Rapid growth: indicated by a pyramid with large
    percentage of people in the younger ages

   Slow growth: reflected by a pyramid with a
    smaller proportion of the population of the
    younger ages.

   Zero population or decreasing populations:
    shown by roughly equal numbers of people in all
    age ranges, tapering off gradually at the older
    ages
The population pyramid for
Kenya:
   Typical of a country in
    the LEDCs experiencing
    rapid population growth

   Wide base -large
    numbers of dependent
    children aged 0-14 as a
    result of high fertility
    rates

   Top of the pyramid
    indicates smaller
    proportion of the
    population lives to old
    age.
Implication of this type of population structure
(rapid growth):
   Limited resources will be stretched to meet
    the needs of the large number of dependent
    children for schooling, nutrition and health
    care.

   As this group reaches working age, a large
    number of jobs will be needed

   As this group reaches child bearing age, it is
    likely that fertility rates will be high leading to
    high rates of natural population increase
The population pyramid for the USA:
   Typical for MEDC
    experiencing slow rates of
    natural increase

   Narrow base reflects low
    birth rates

   Wider top of the pyramid is
    the result of people living
    longer

   The bulge in 30-40 age
    cohort is a result of the baby
    boom of the 1960s
The population pyramid for
Germany:
   Is similar to that of USA

   It represents a zero-
    population growth
    (BR – DR = 0)

   People are distribute
    evenly throughout the
    cohorts
Implication of this type of population structure

 Ageing   population

A  smaller proportion of the working
  age and are faced with the task of
  generating enough wealth to
  provide high levels of support for
  the elderly population
Consequences of ageing
population
   Limited manpower for defense of a country

   Give pressure to government to provide more
    medical and health facility for ageing population

   Shortage of labour, most of elderly retire and
    not enough young people to replace them

   Need more housing facilities and transport to
    meet the need of ageing population
Advantages of ageing population
 Tourism sector is boosted by the elderly
 taking holidays during off-peak seasons

 Industriesthat tap into the pensioner
 market (e.g. wheel chairs)

 Some large properties have been converted
 to profitable residential homes
Dependency ratio


Dependency ratio = % of population aged 0-15 + % of population aged 65+
                            % 0f population of working age

Population structure lesson4

  • 1.
    The interpretation ofage / sex pyramids
  • 2.
    POPULATION STRUCTURE:  is the number of males and females in different age groups.  The common method to show the structure is by a population pyramid.  This diagram is made up by putting two bar graphs (one for male, one for female) side by side.  From this you can read off what percentage of a population is of a certain gender and age range.
  • 3.
    Key things toknow about population pyramids:  Population is divided into 5 year age groups.  Horizontal line represents the percentage of male & female group  The age groups are divided into 3 groups:  Young dependent (0-14 years old)  Working Population (15-64 years old)  Elderly Dependent (65+ years old)  Population is divided into males and females.  The percentage of each age /sex group is given.
  • 4.
    What does theshape of the population pyramids tell us?  Information of birth and death rates  Information of life expectancy  People living in a particular country or place
  • 7.
  • 10.
    Three general profilesof population pyramids:  Rapid growth: indicated by a pyramid with large percentage of people in the younger ages  Slow growth: reflected by a pyramid with a smaller proportion of the population of the younger ages.  Zero population or decreasing populations: shown by roughly equal numbers of people in all age ranges, tapering off gradually at the older ages
  • 12.
    The population pyramidfor Kenya:  Typical of a country in the LEDCs experiencing rapid population growth  Wide base -large numbers of dependent children aged 0-14 as a result of high fertility rates  Top of the pyramid indicates smaller proportion of the population lives to old age.
  • 13.
    Implication of thistype of population structure (rapid growth):  Limited resources will be stretched to meet the needs of the large number of dependent children for schooling, nutrition and health care.  As this group reaches working age, a large number of jobs will be needed  As this group reaches child bearing age, it is likely that fertility rates will be high leading to high rates of natural population increase
  • 14.
    The population pyramidfor the USA:  Typical for MEDC experiencing slow rates of natural increase  Narrow base reflects low birth rates  Wider top of the pyramid is the result of people living longer  The bulge in 30-40 age cohort is a result of the baby boom of the 1960s
  • 15.
    The population pyramidfor Germany:  Is similar to that of USA  It represents a zero- population growth (BR – DR = 0)  People are distribute evenly throughout the cohorts
  • 16.
    Implication of thistype of population structure  Ageing population A smaller proportion of the working age and are faced with the task of generating enough wealth to provide high levels of support for the elderly population
  • 17.
    Consequences of ageing population  Limited manpower for defense of a country  Give pressure to government to provide more medical and health facility for ageing population  Shortage of labour, most of elderly retire and not enough young people to replace them  Need more housing facilities and transport to meet the need of ageing population
  • 18.
    Advantages of ageingpopulation  Tourism sector is boosted by the elderly taking holidays during off-peak seasons  Industriesthat tap into the pensioner market (e.g. wheel chairs)  Some large properties have been converted to profitable residential homes
  • 19.
    Dependency ratio Dependency ratio= % of population aged 0-15 + % of population aged 65+ % 0f population of working age