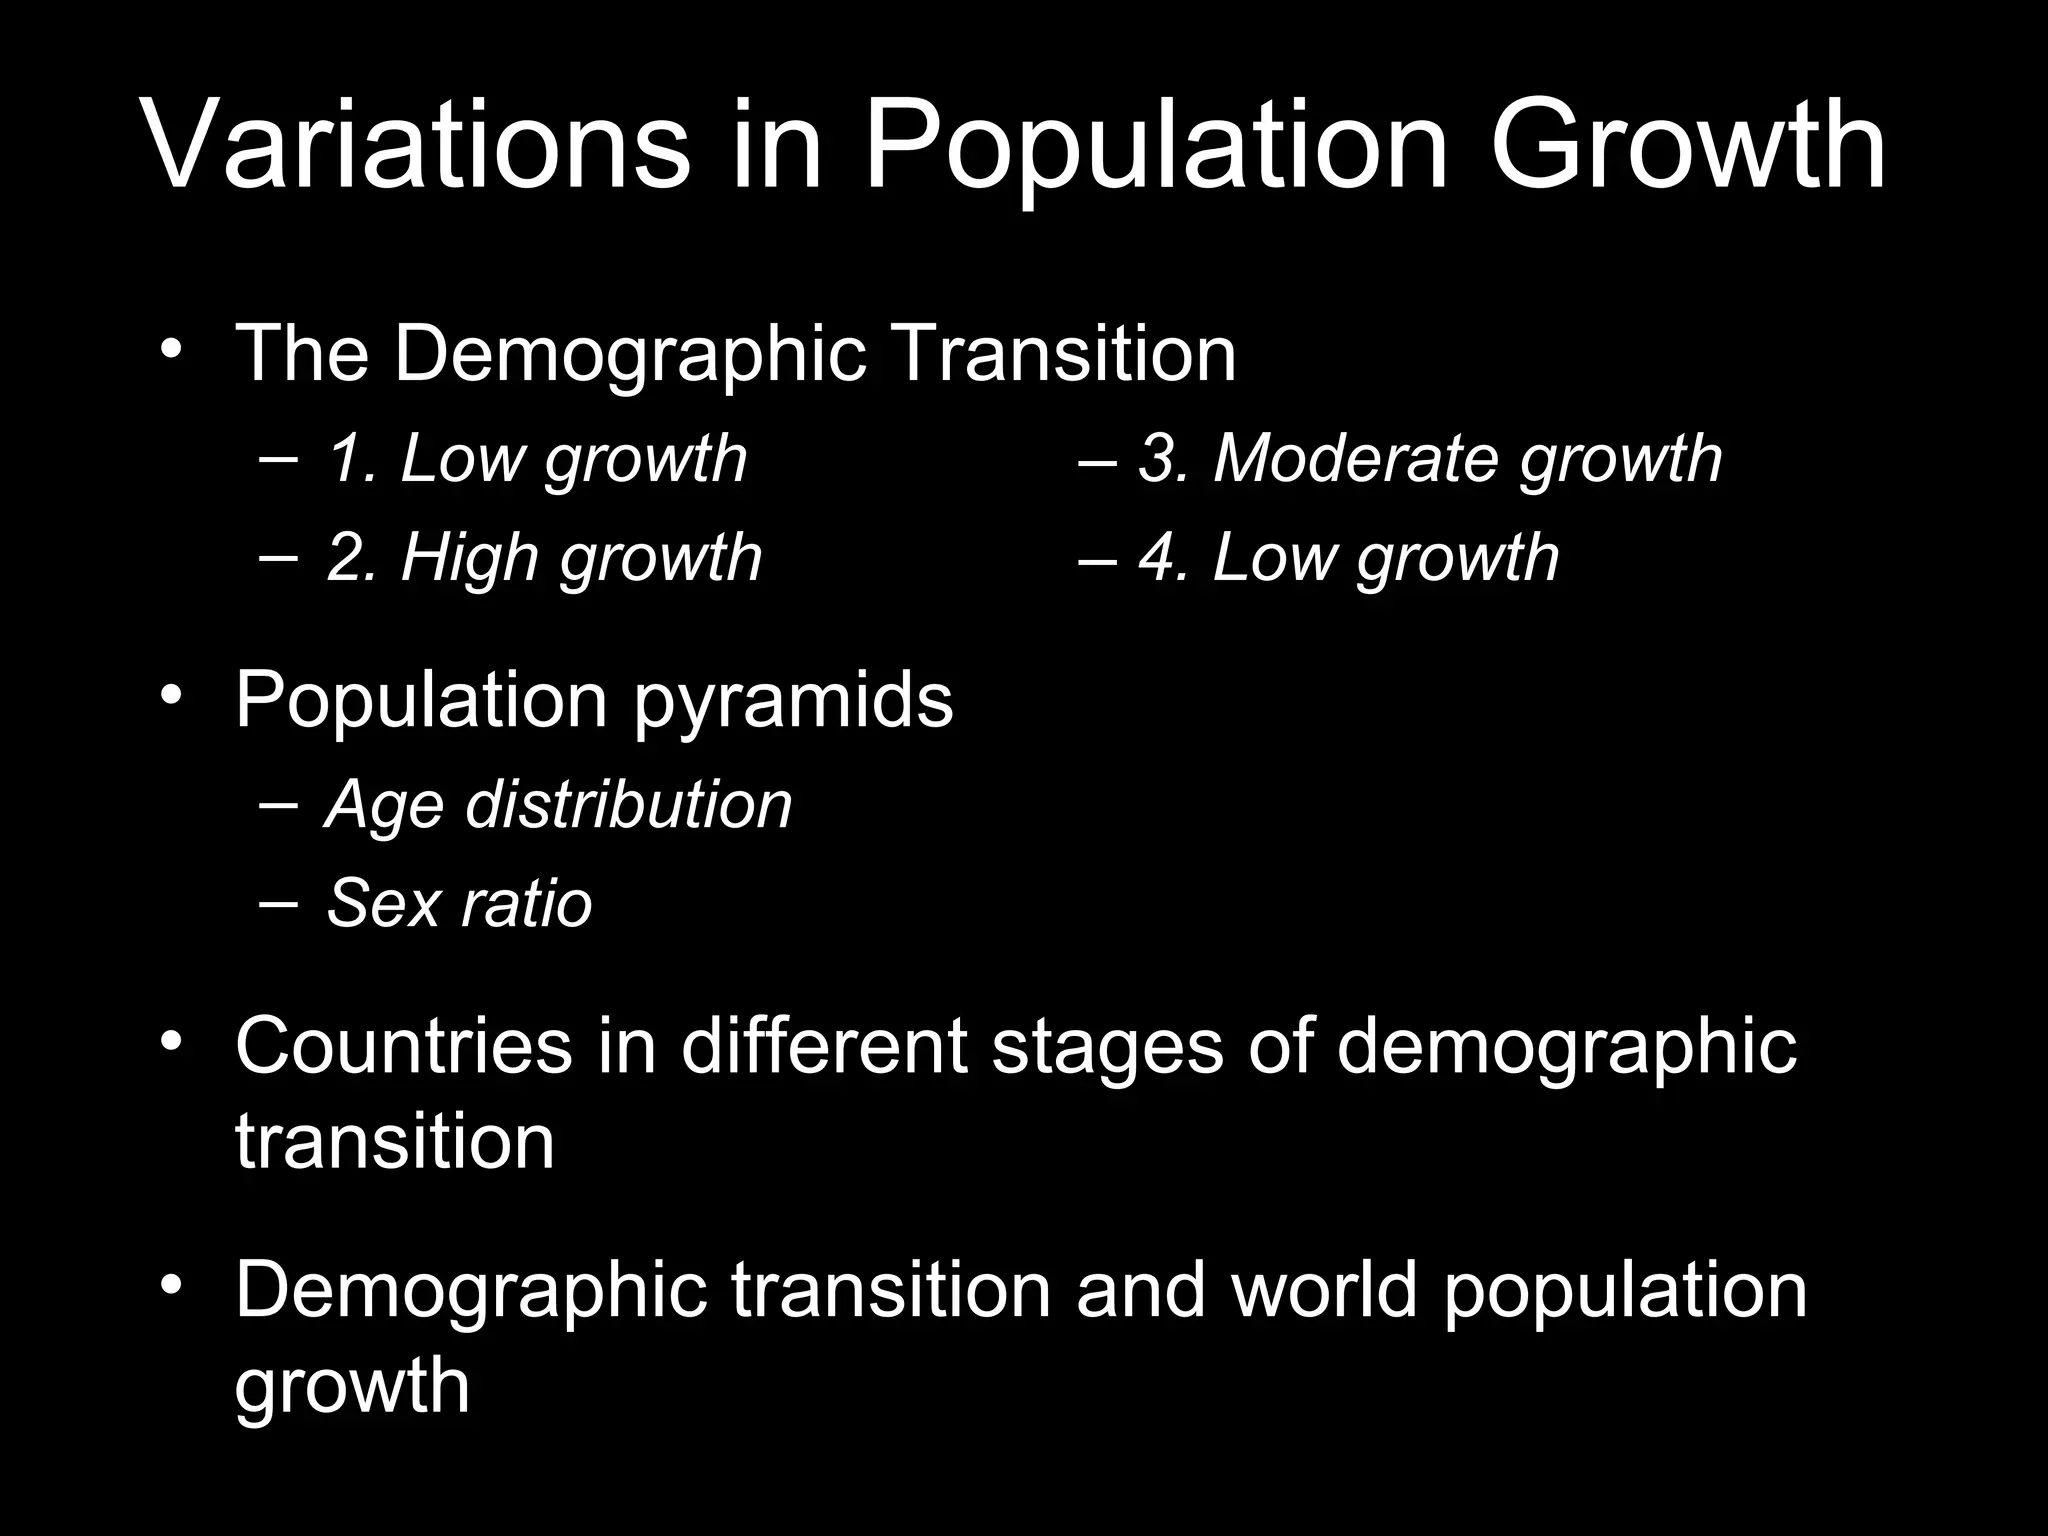
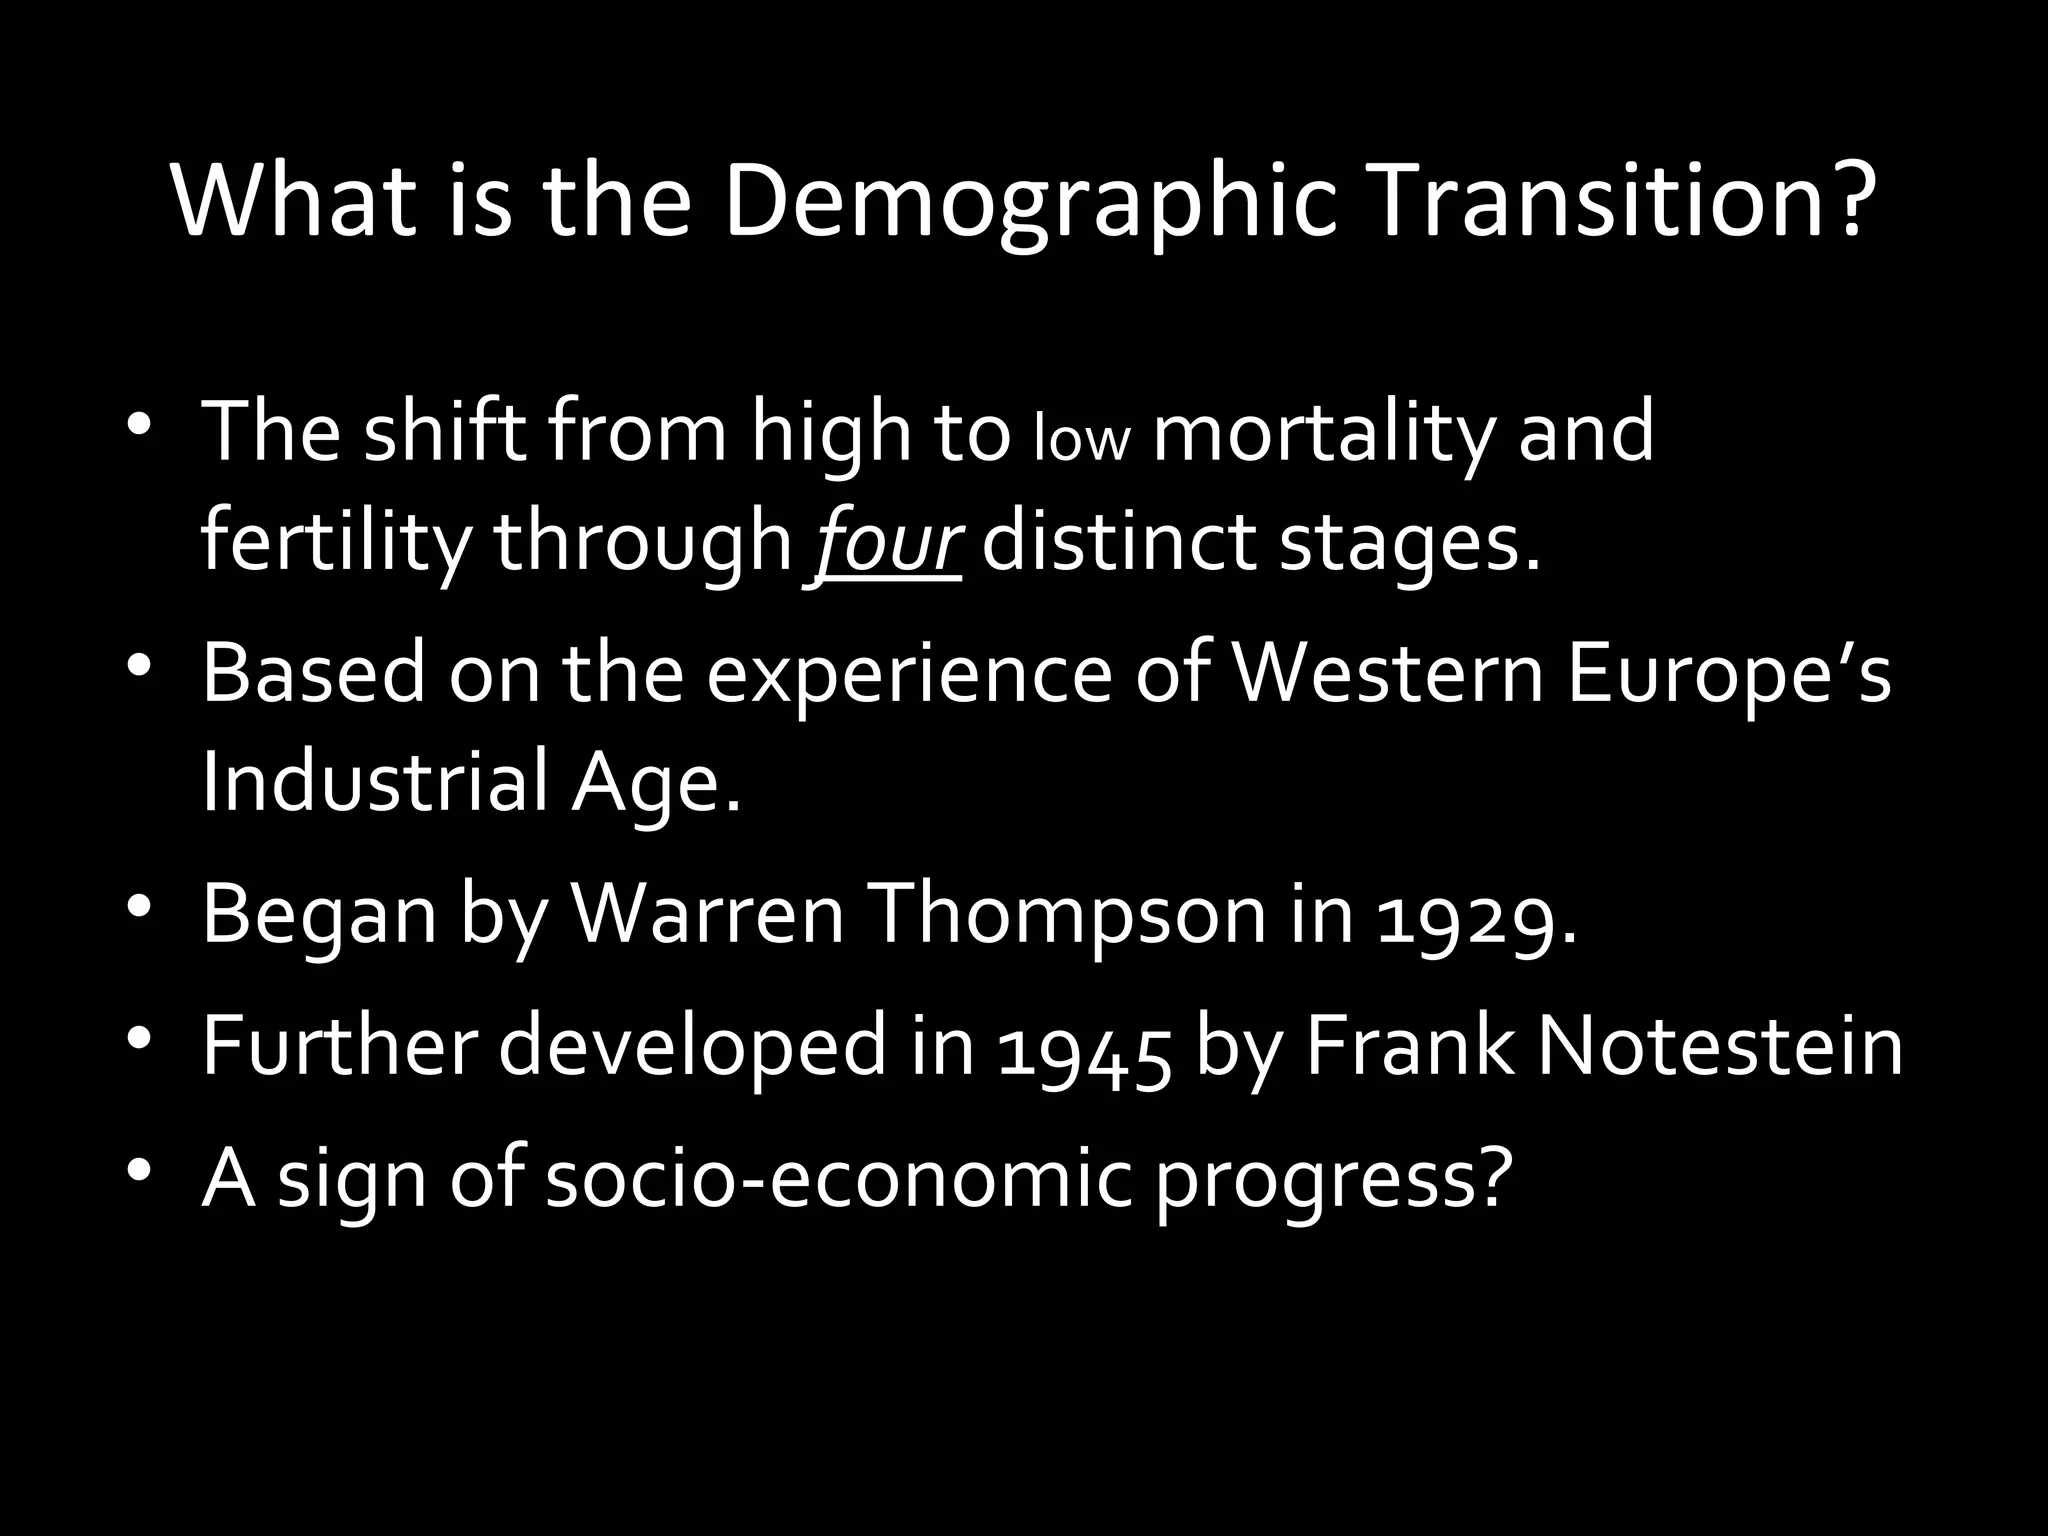
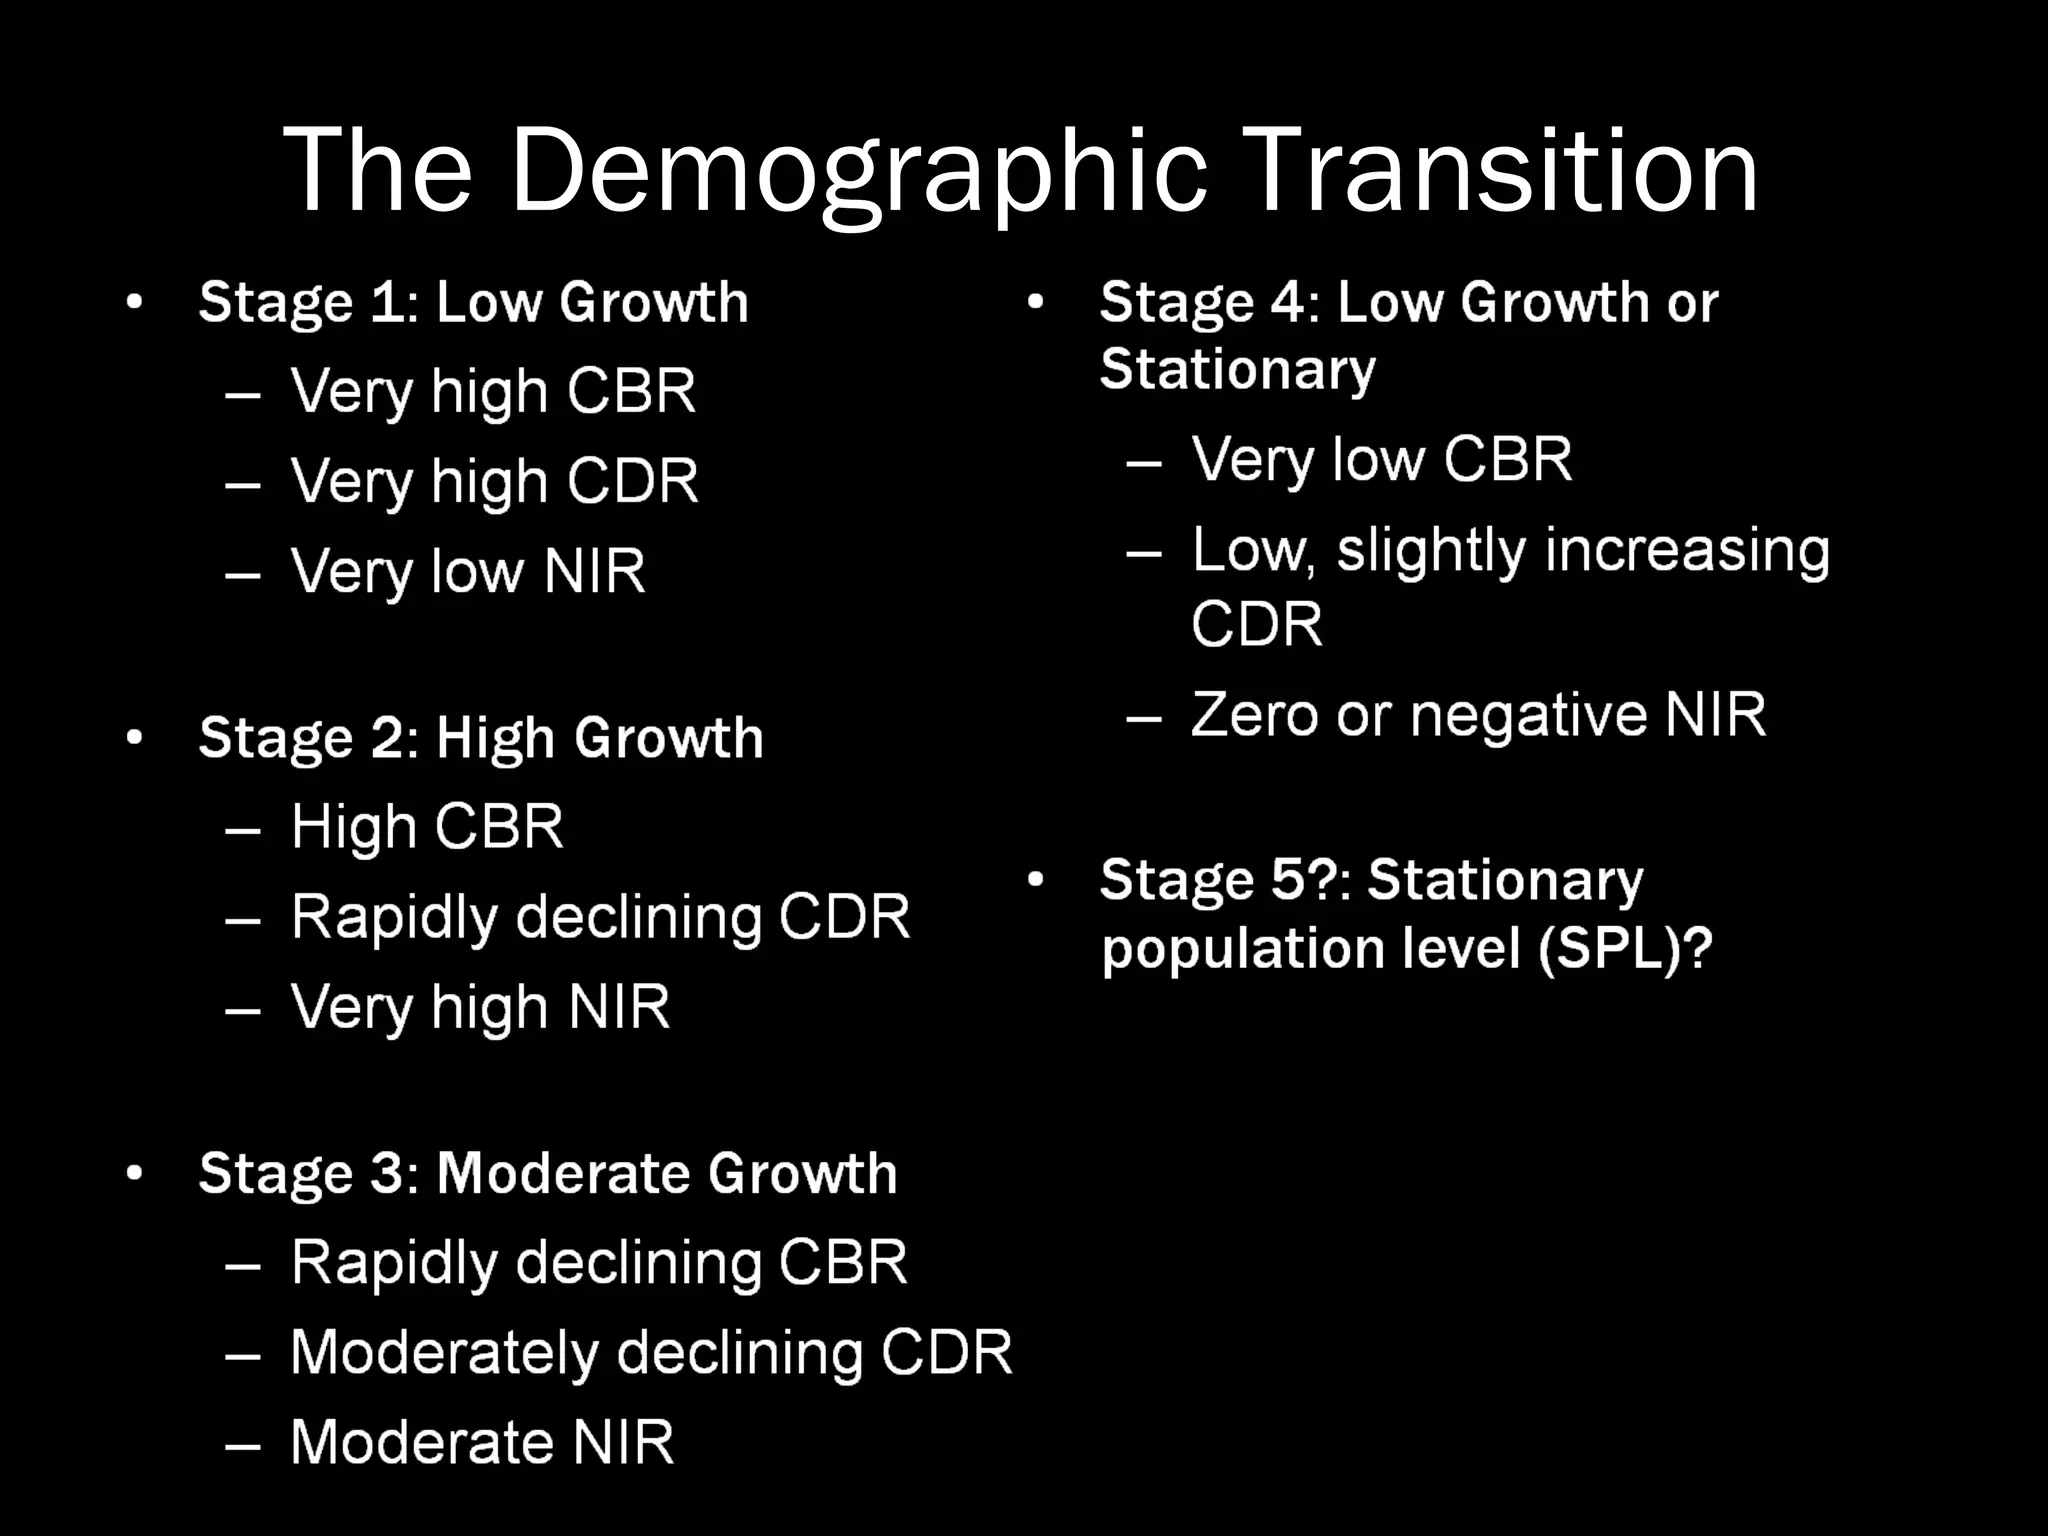
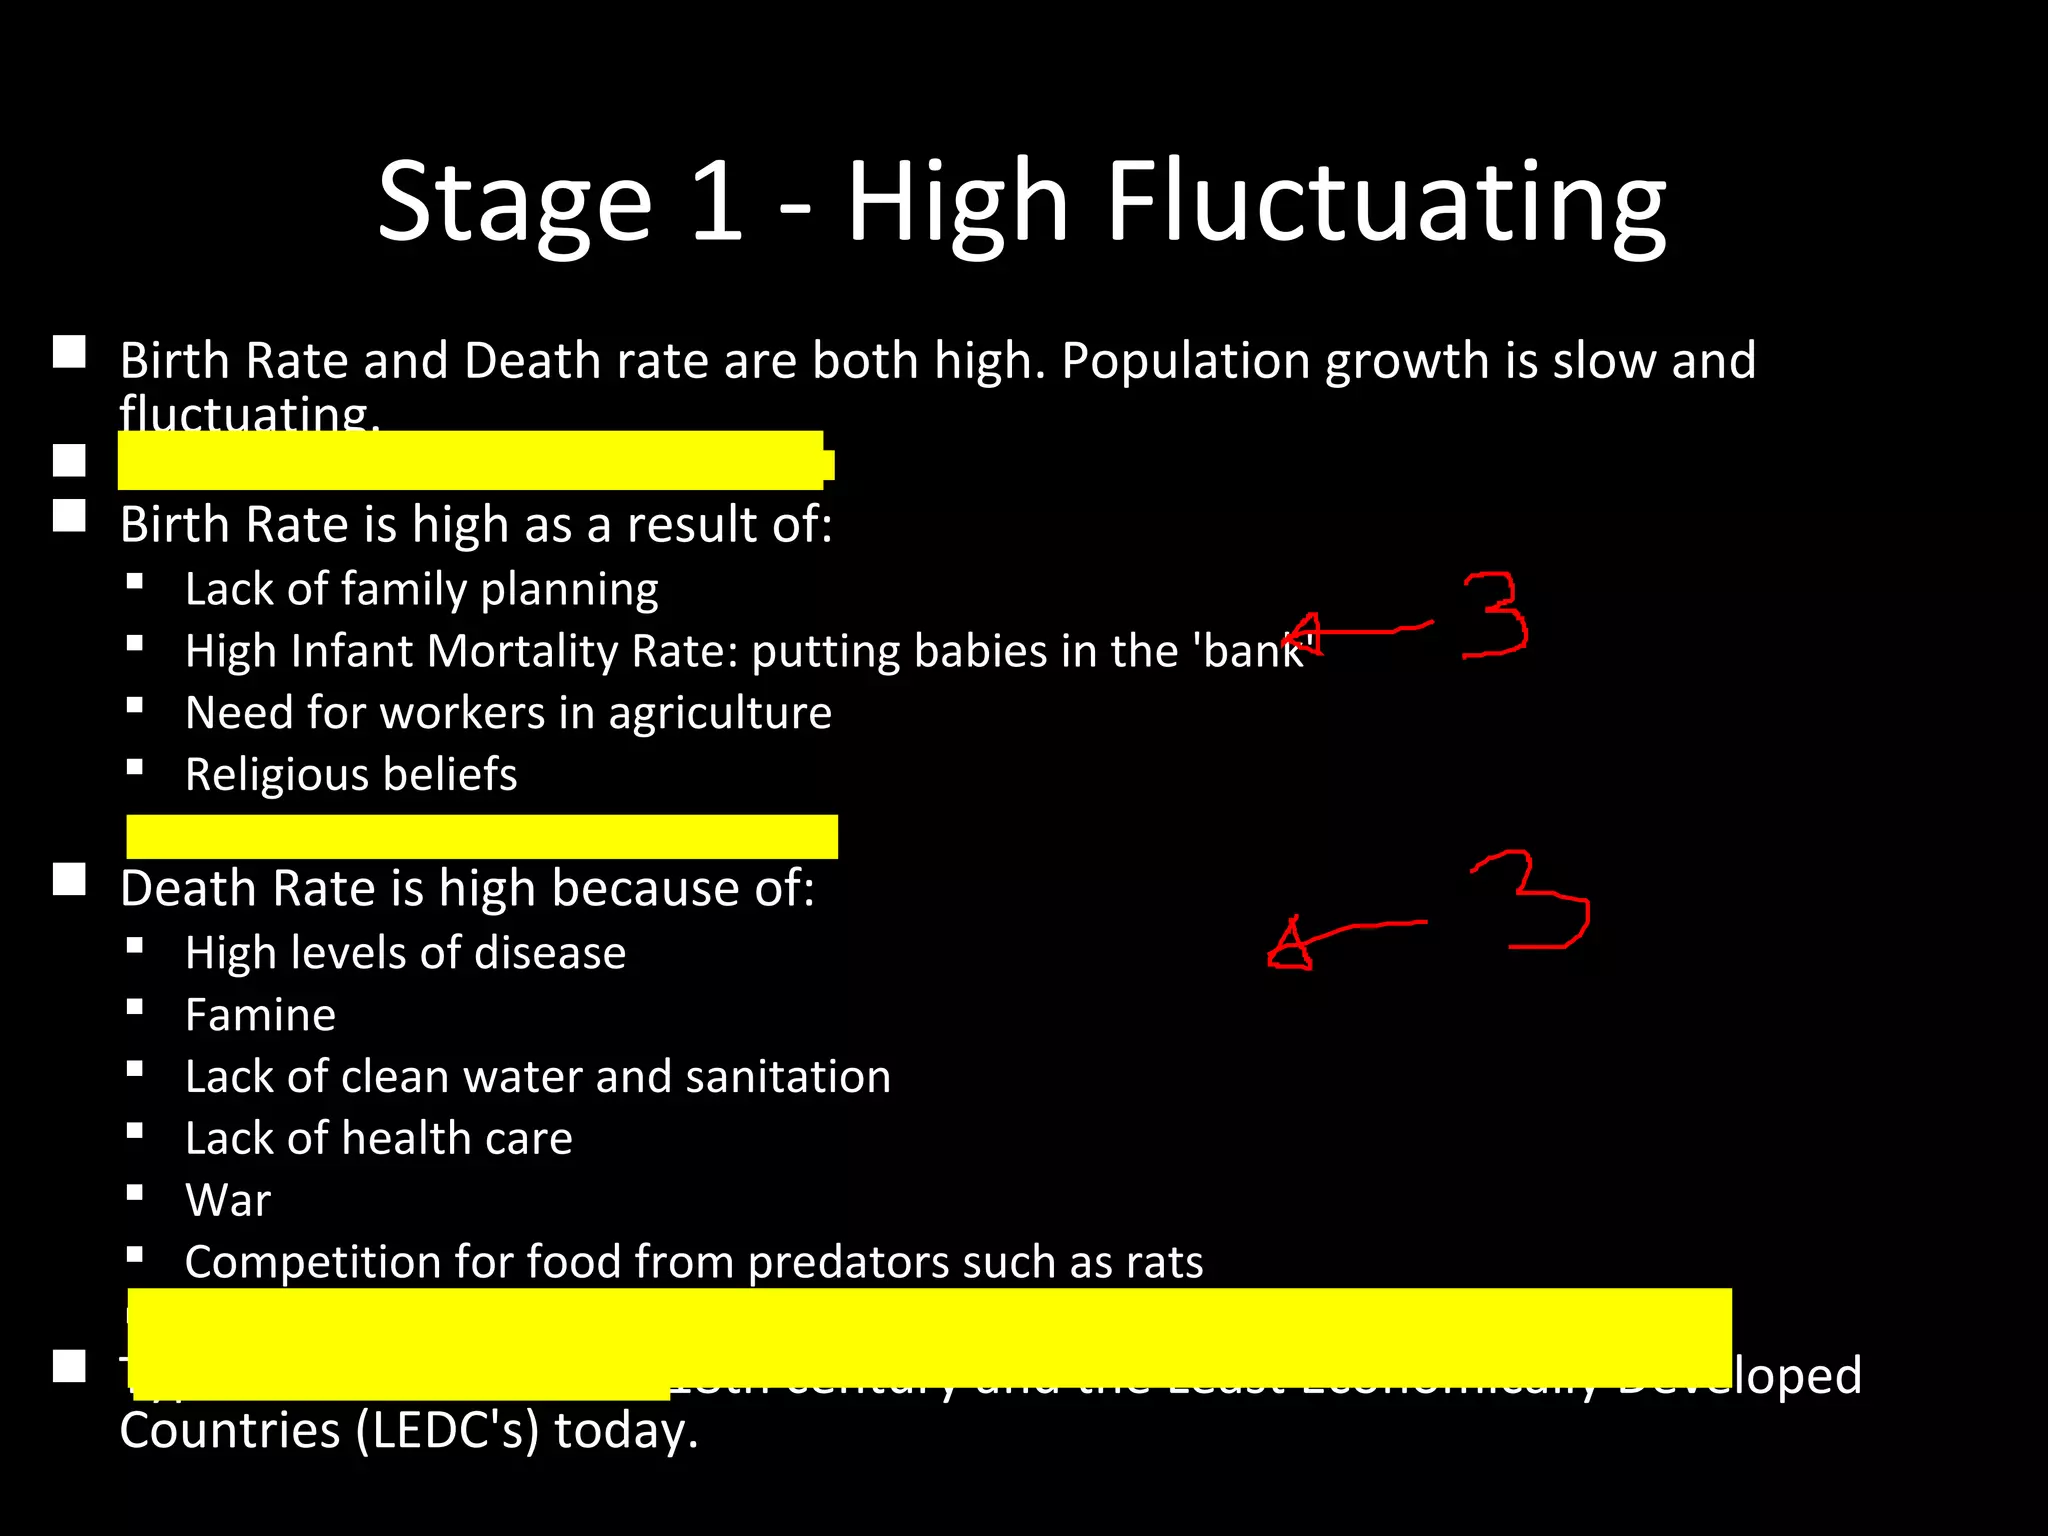
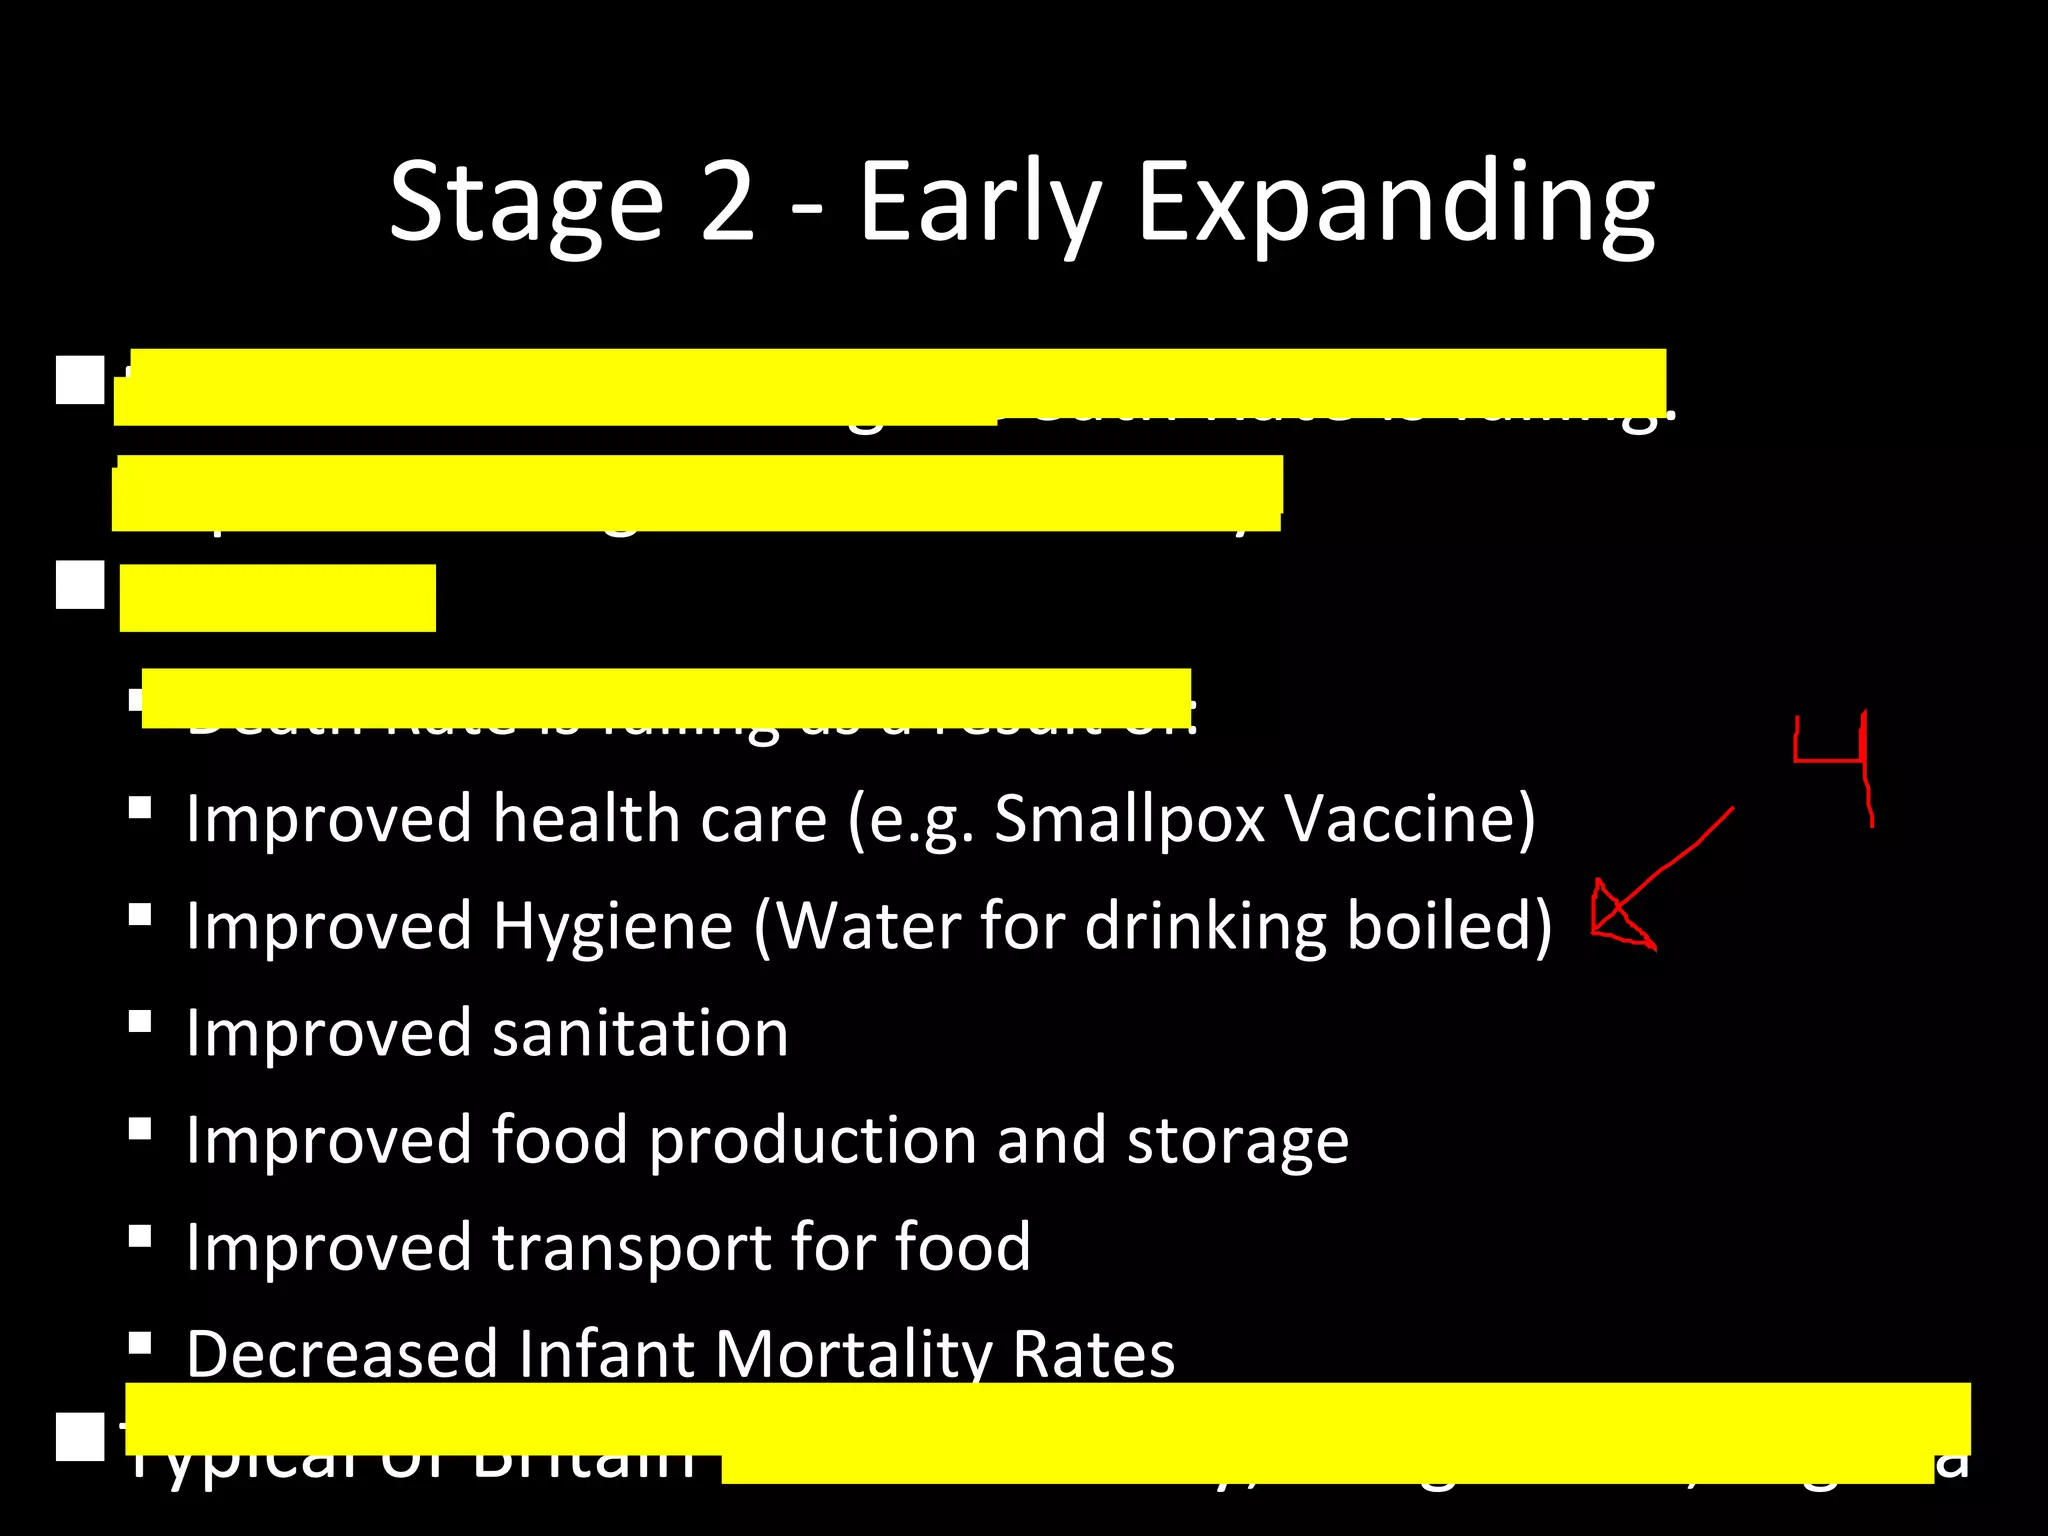
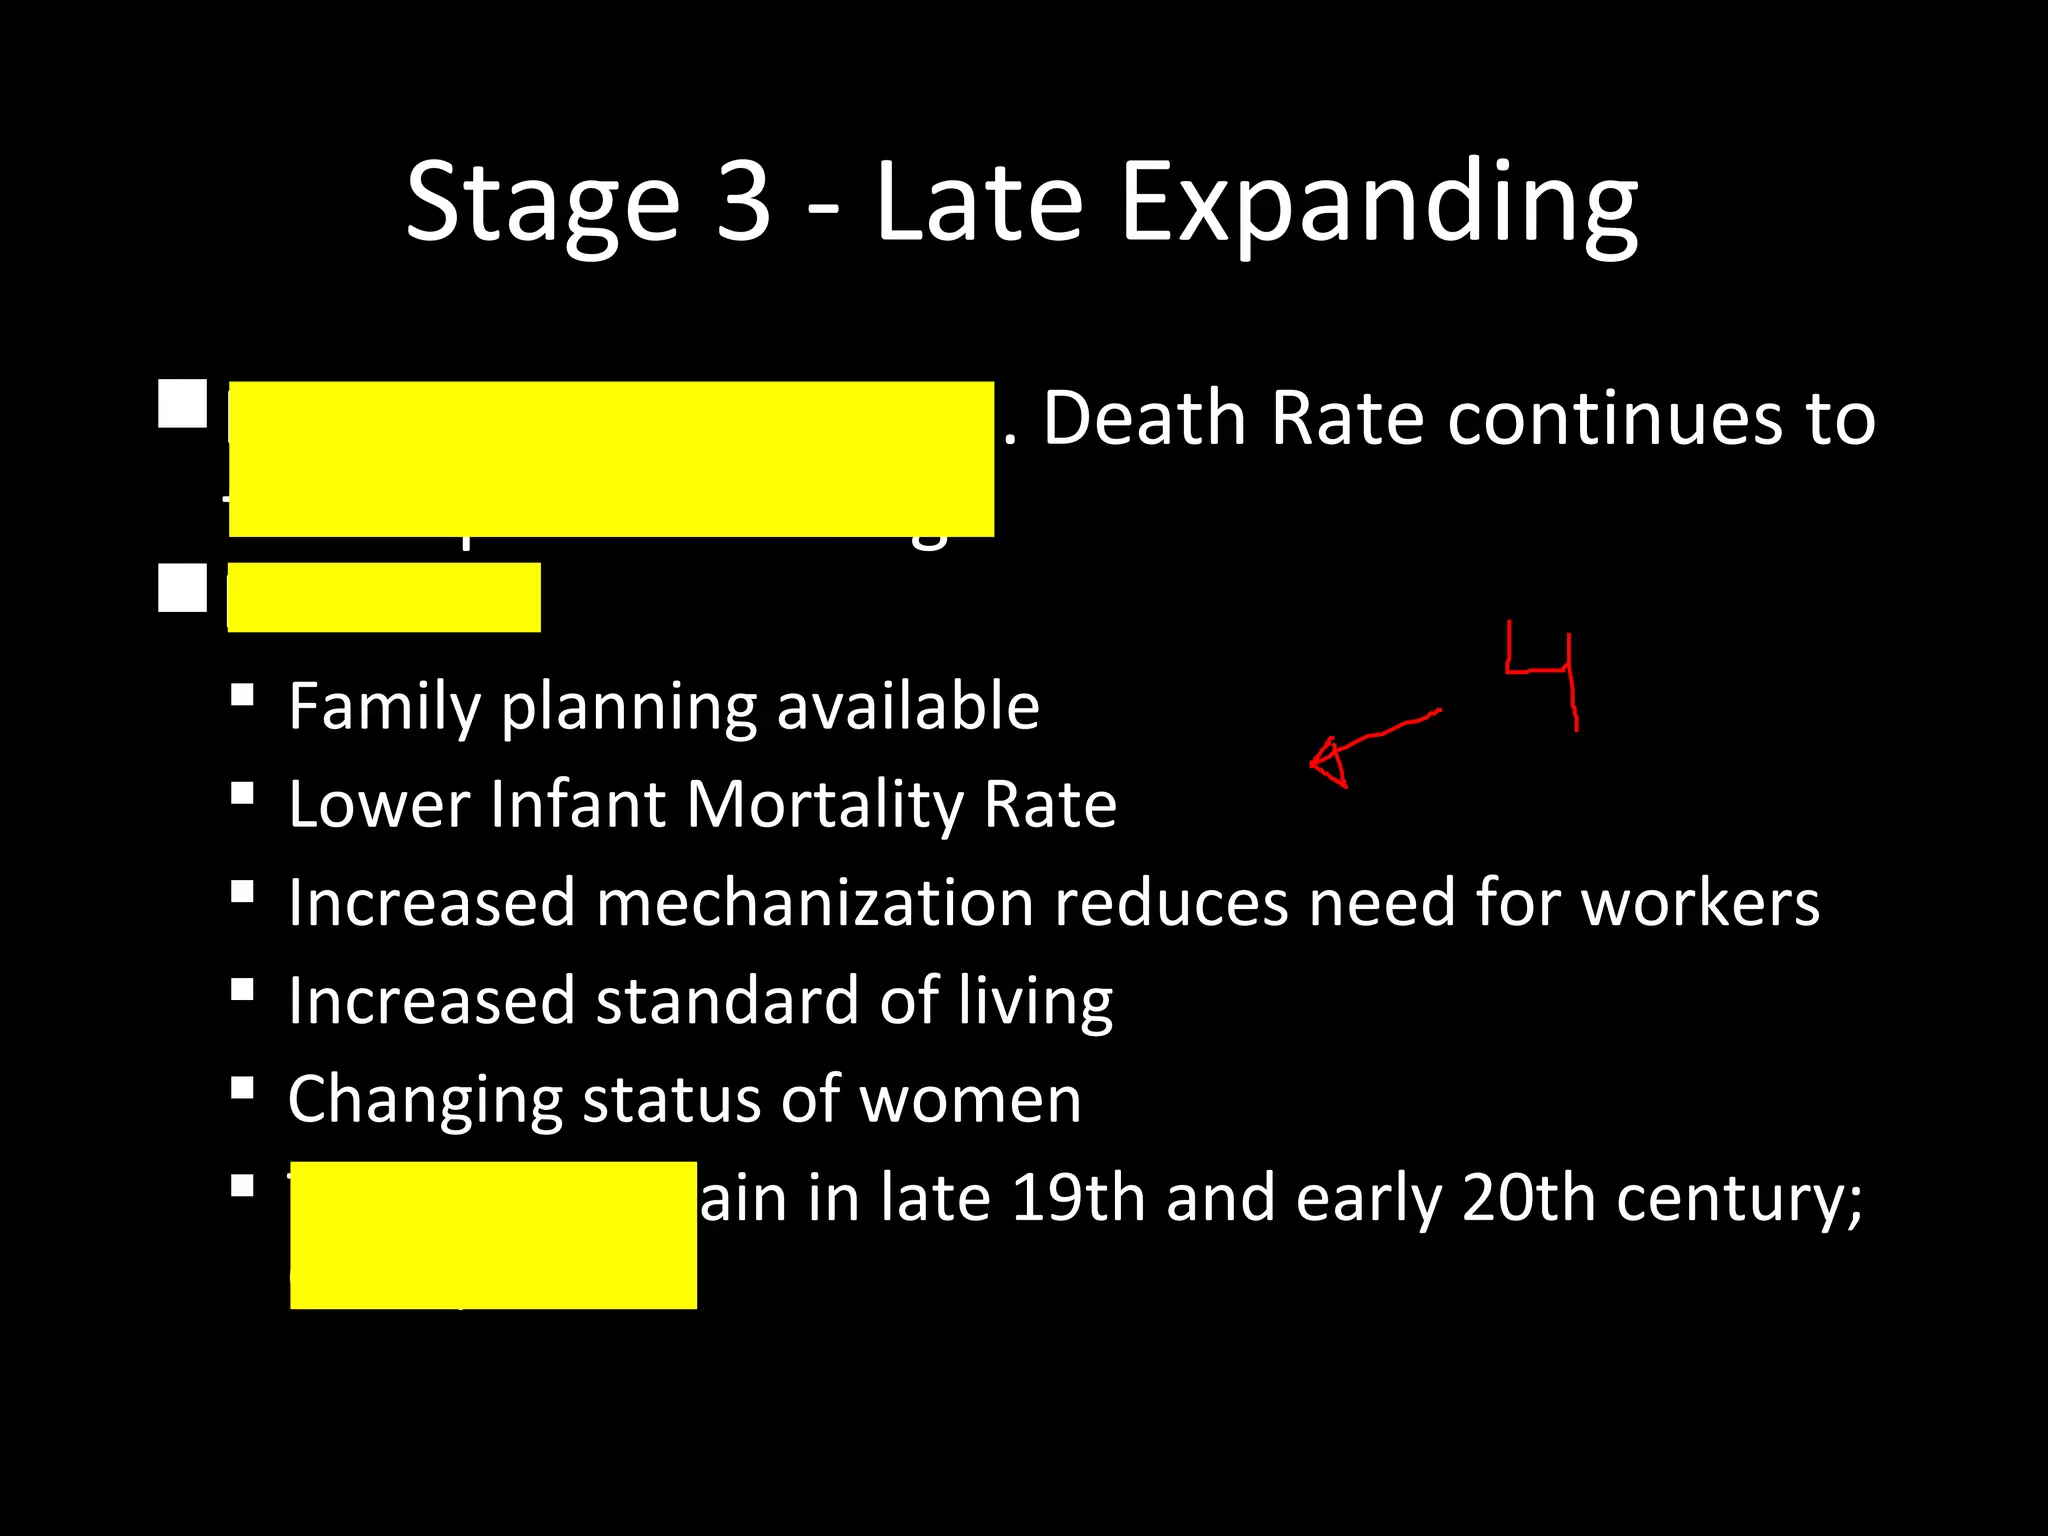
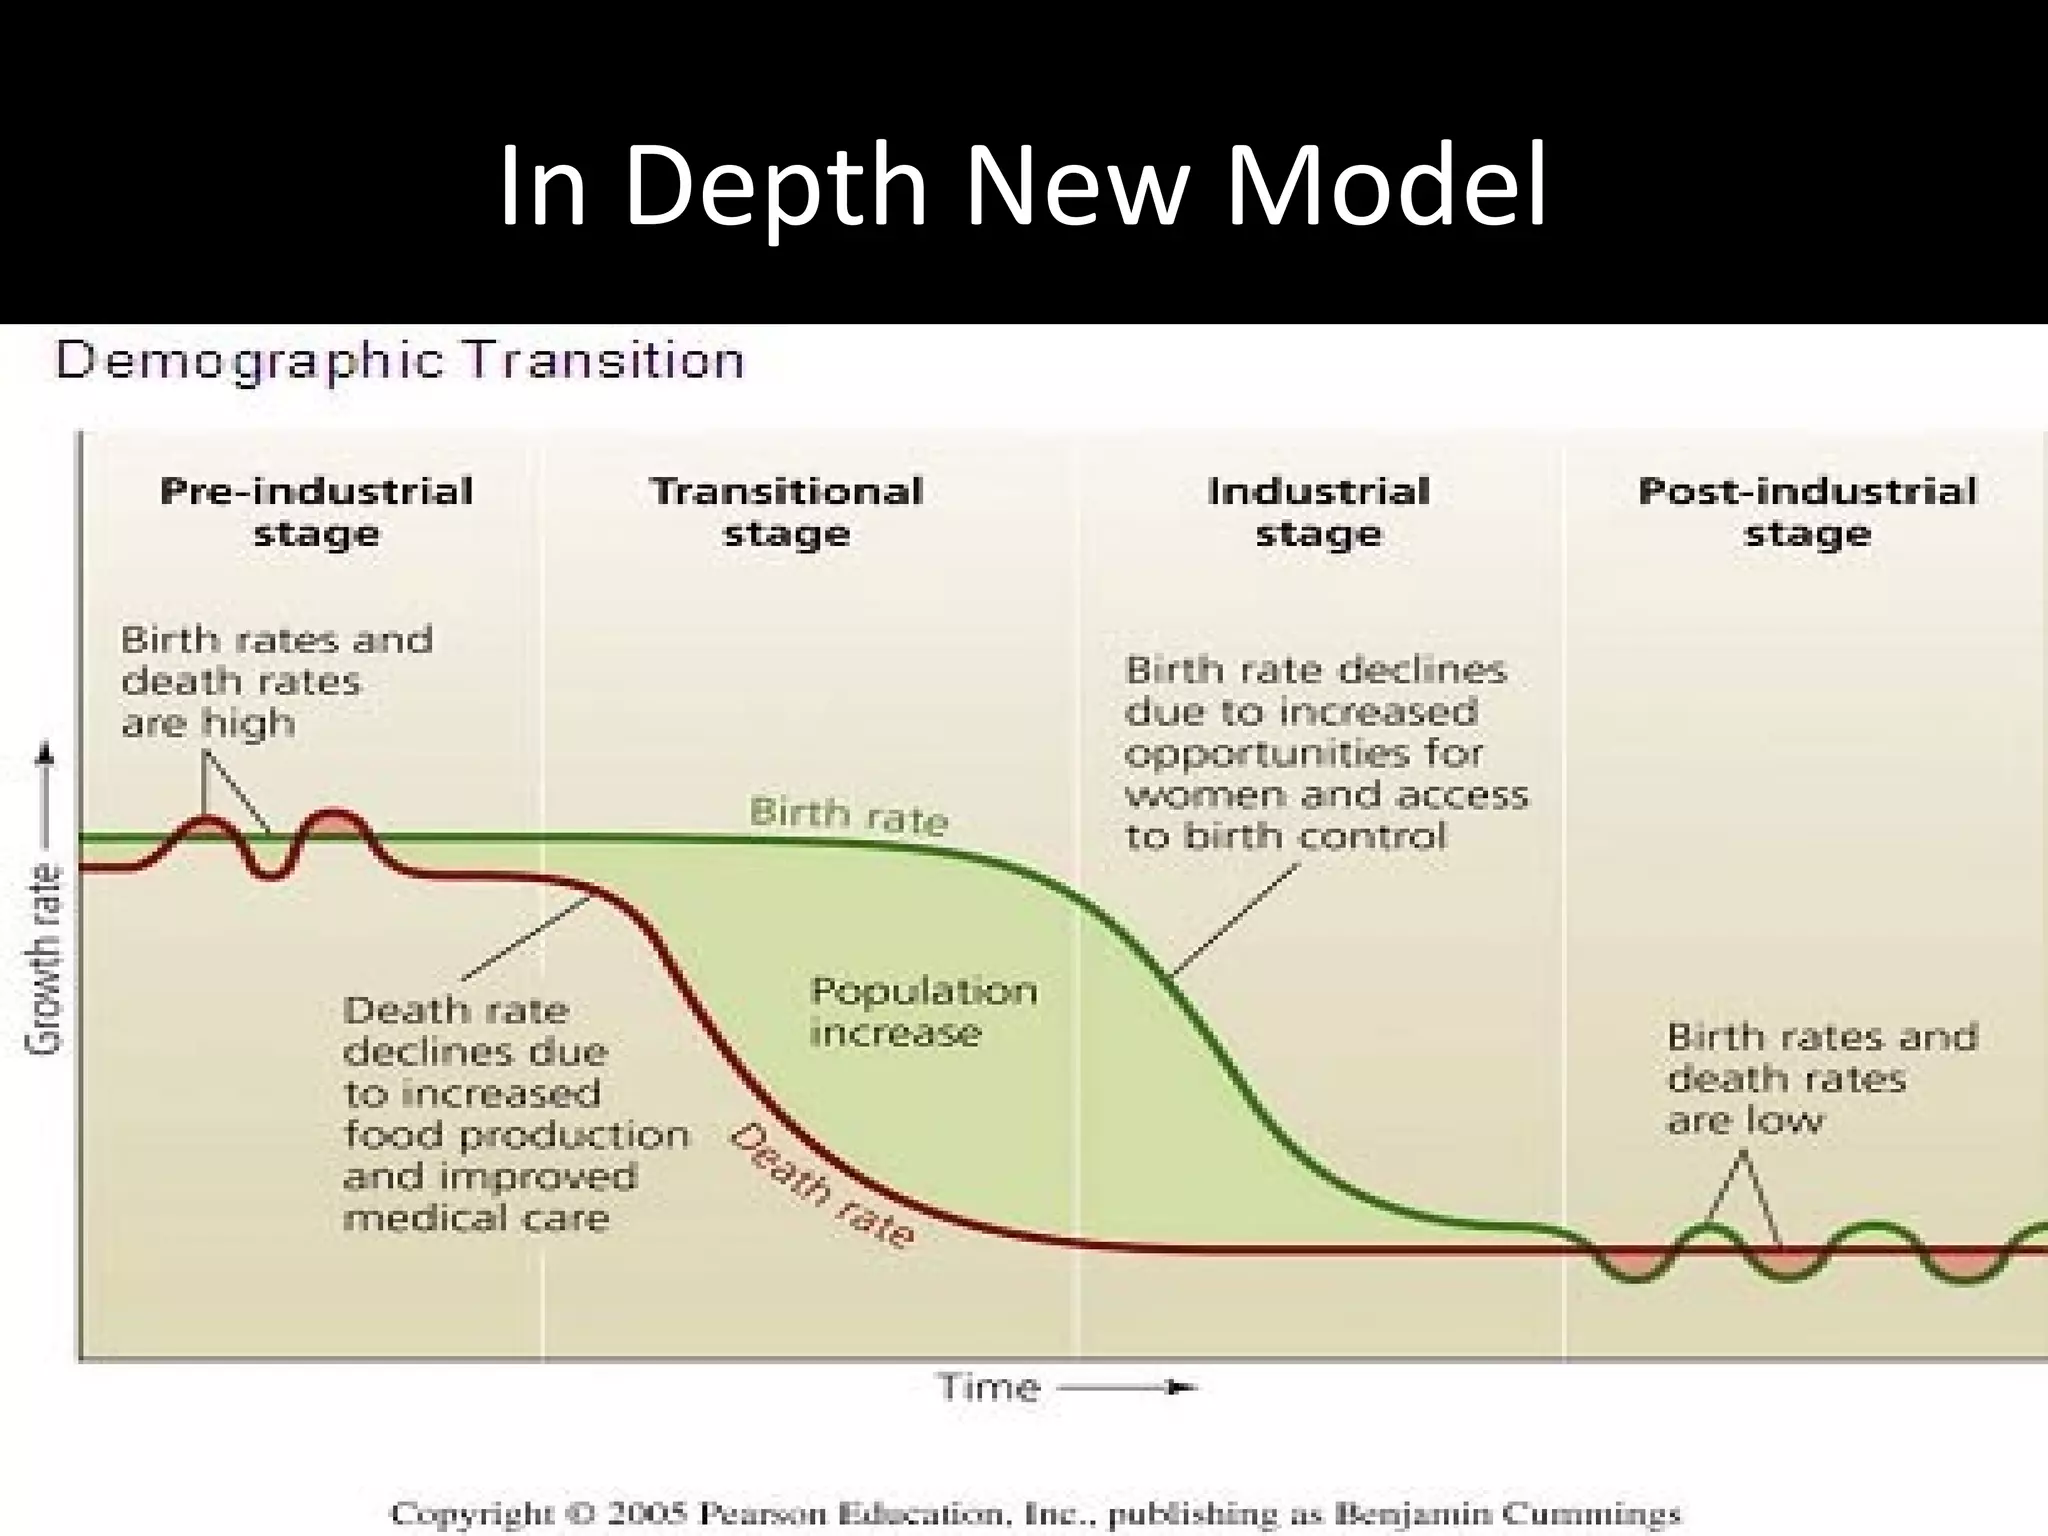
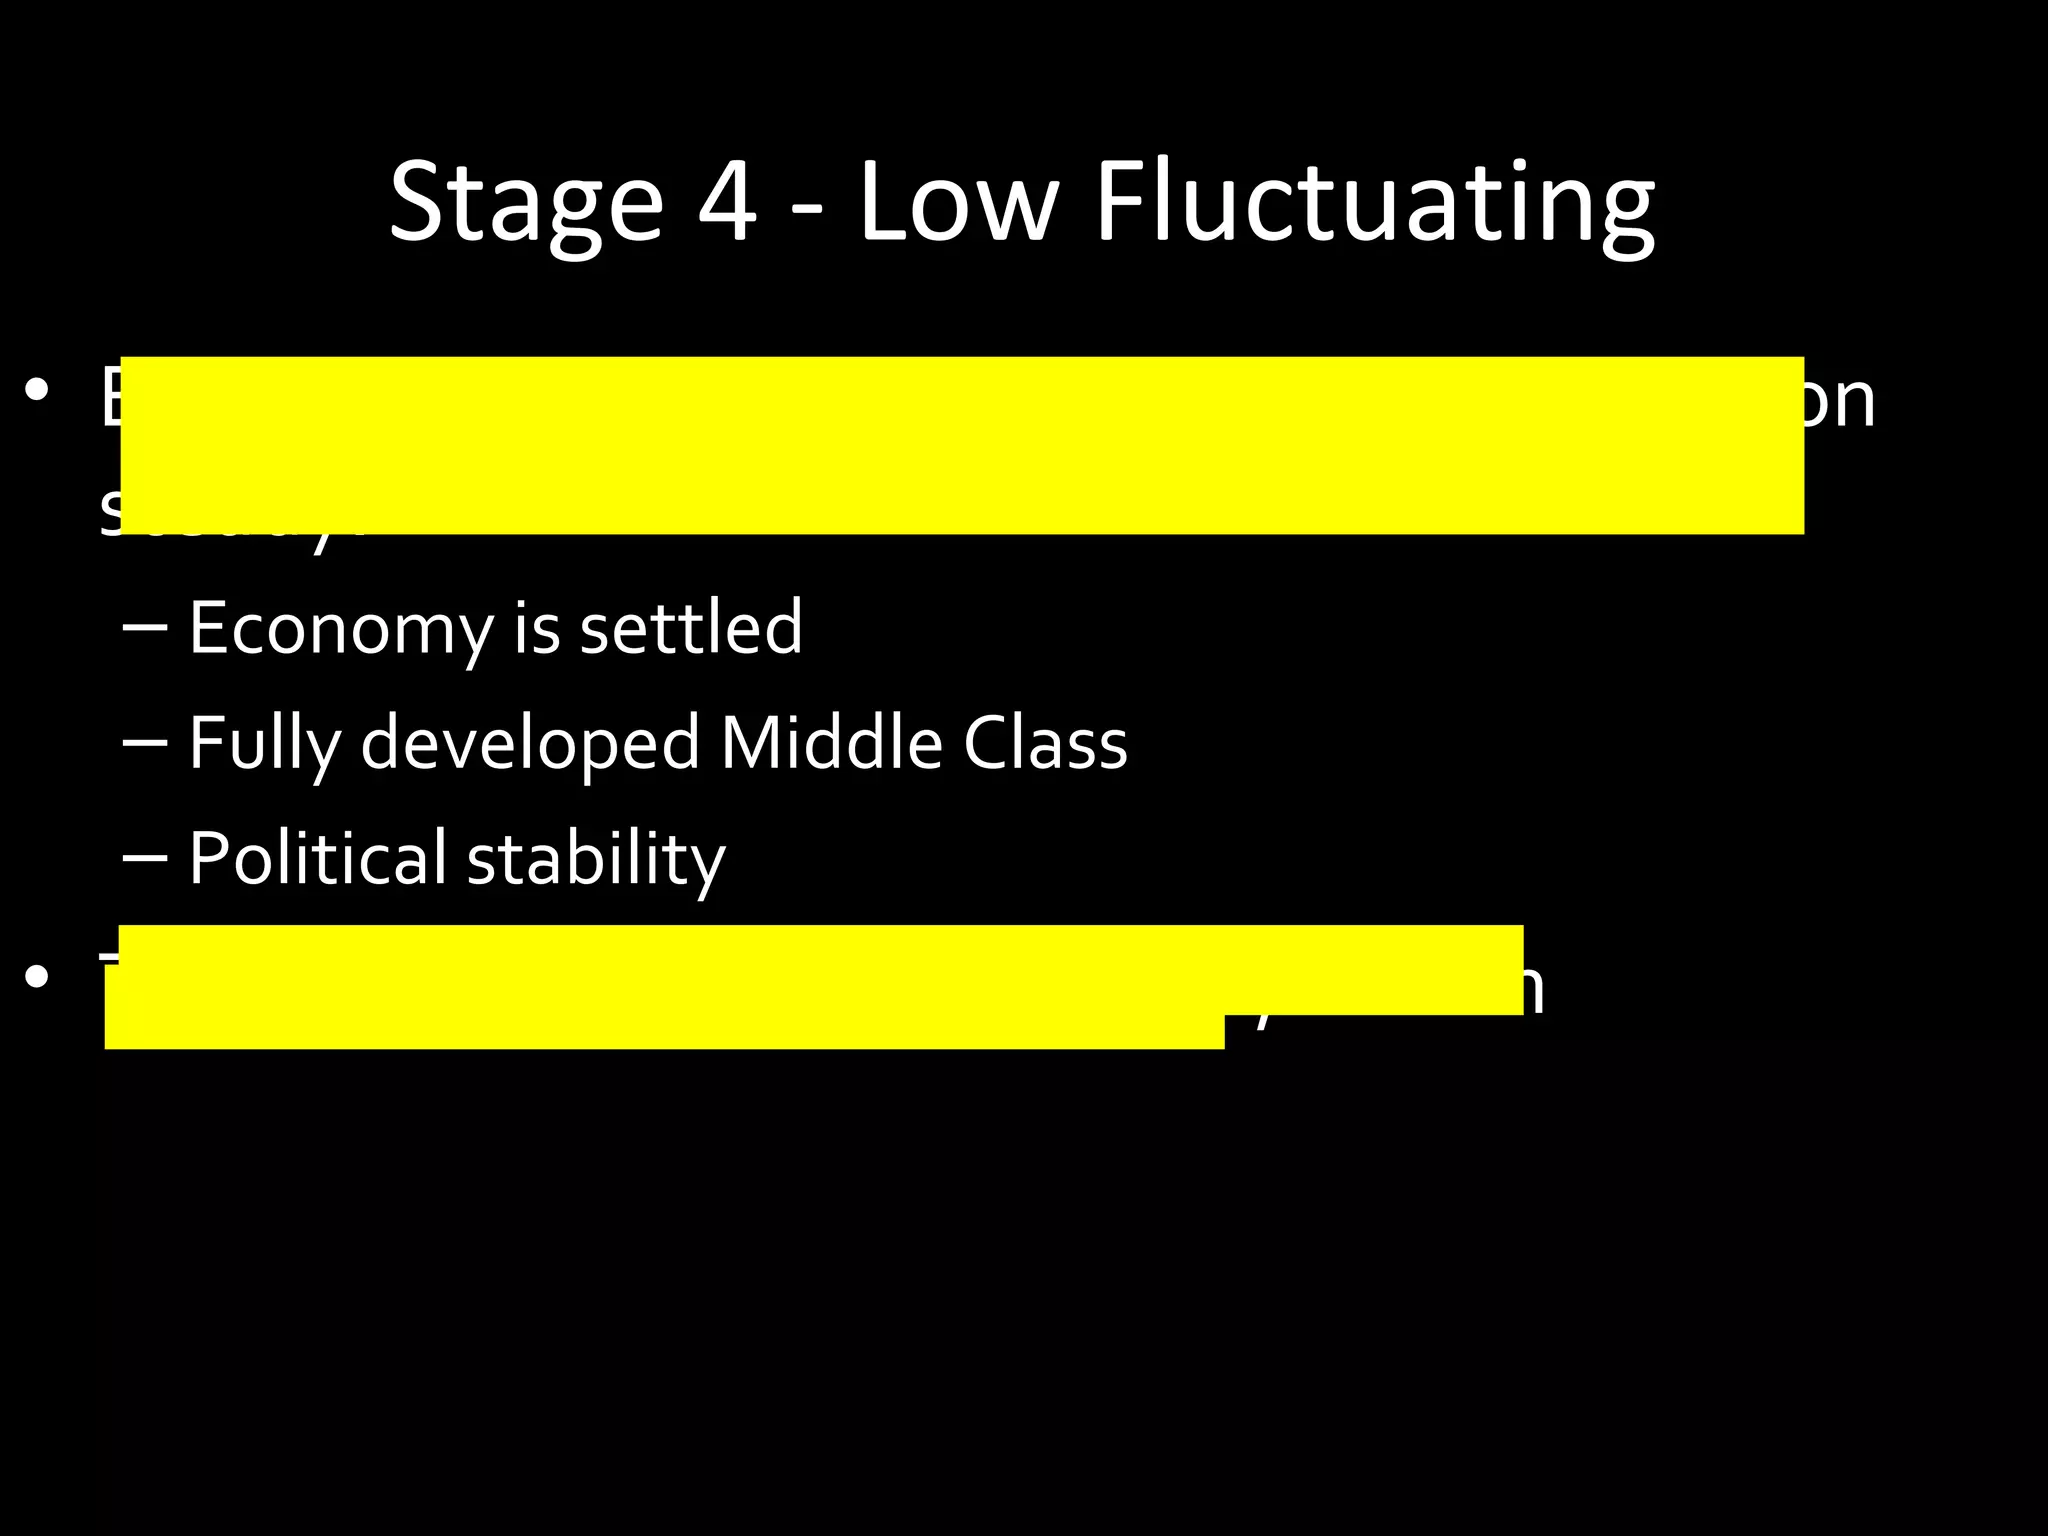
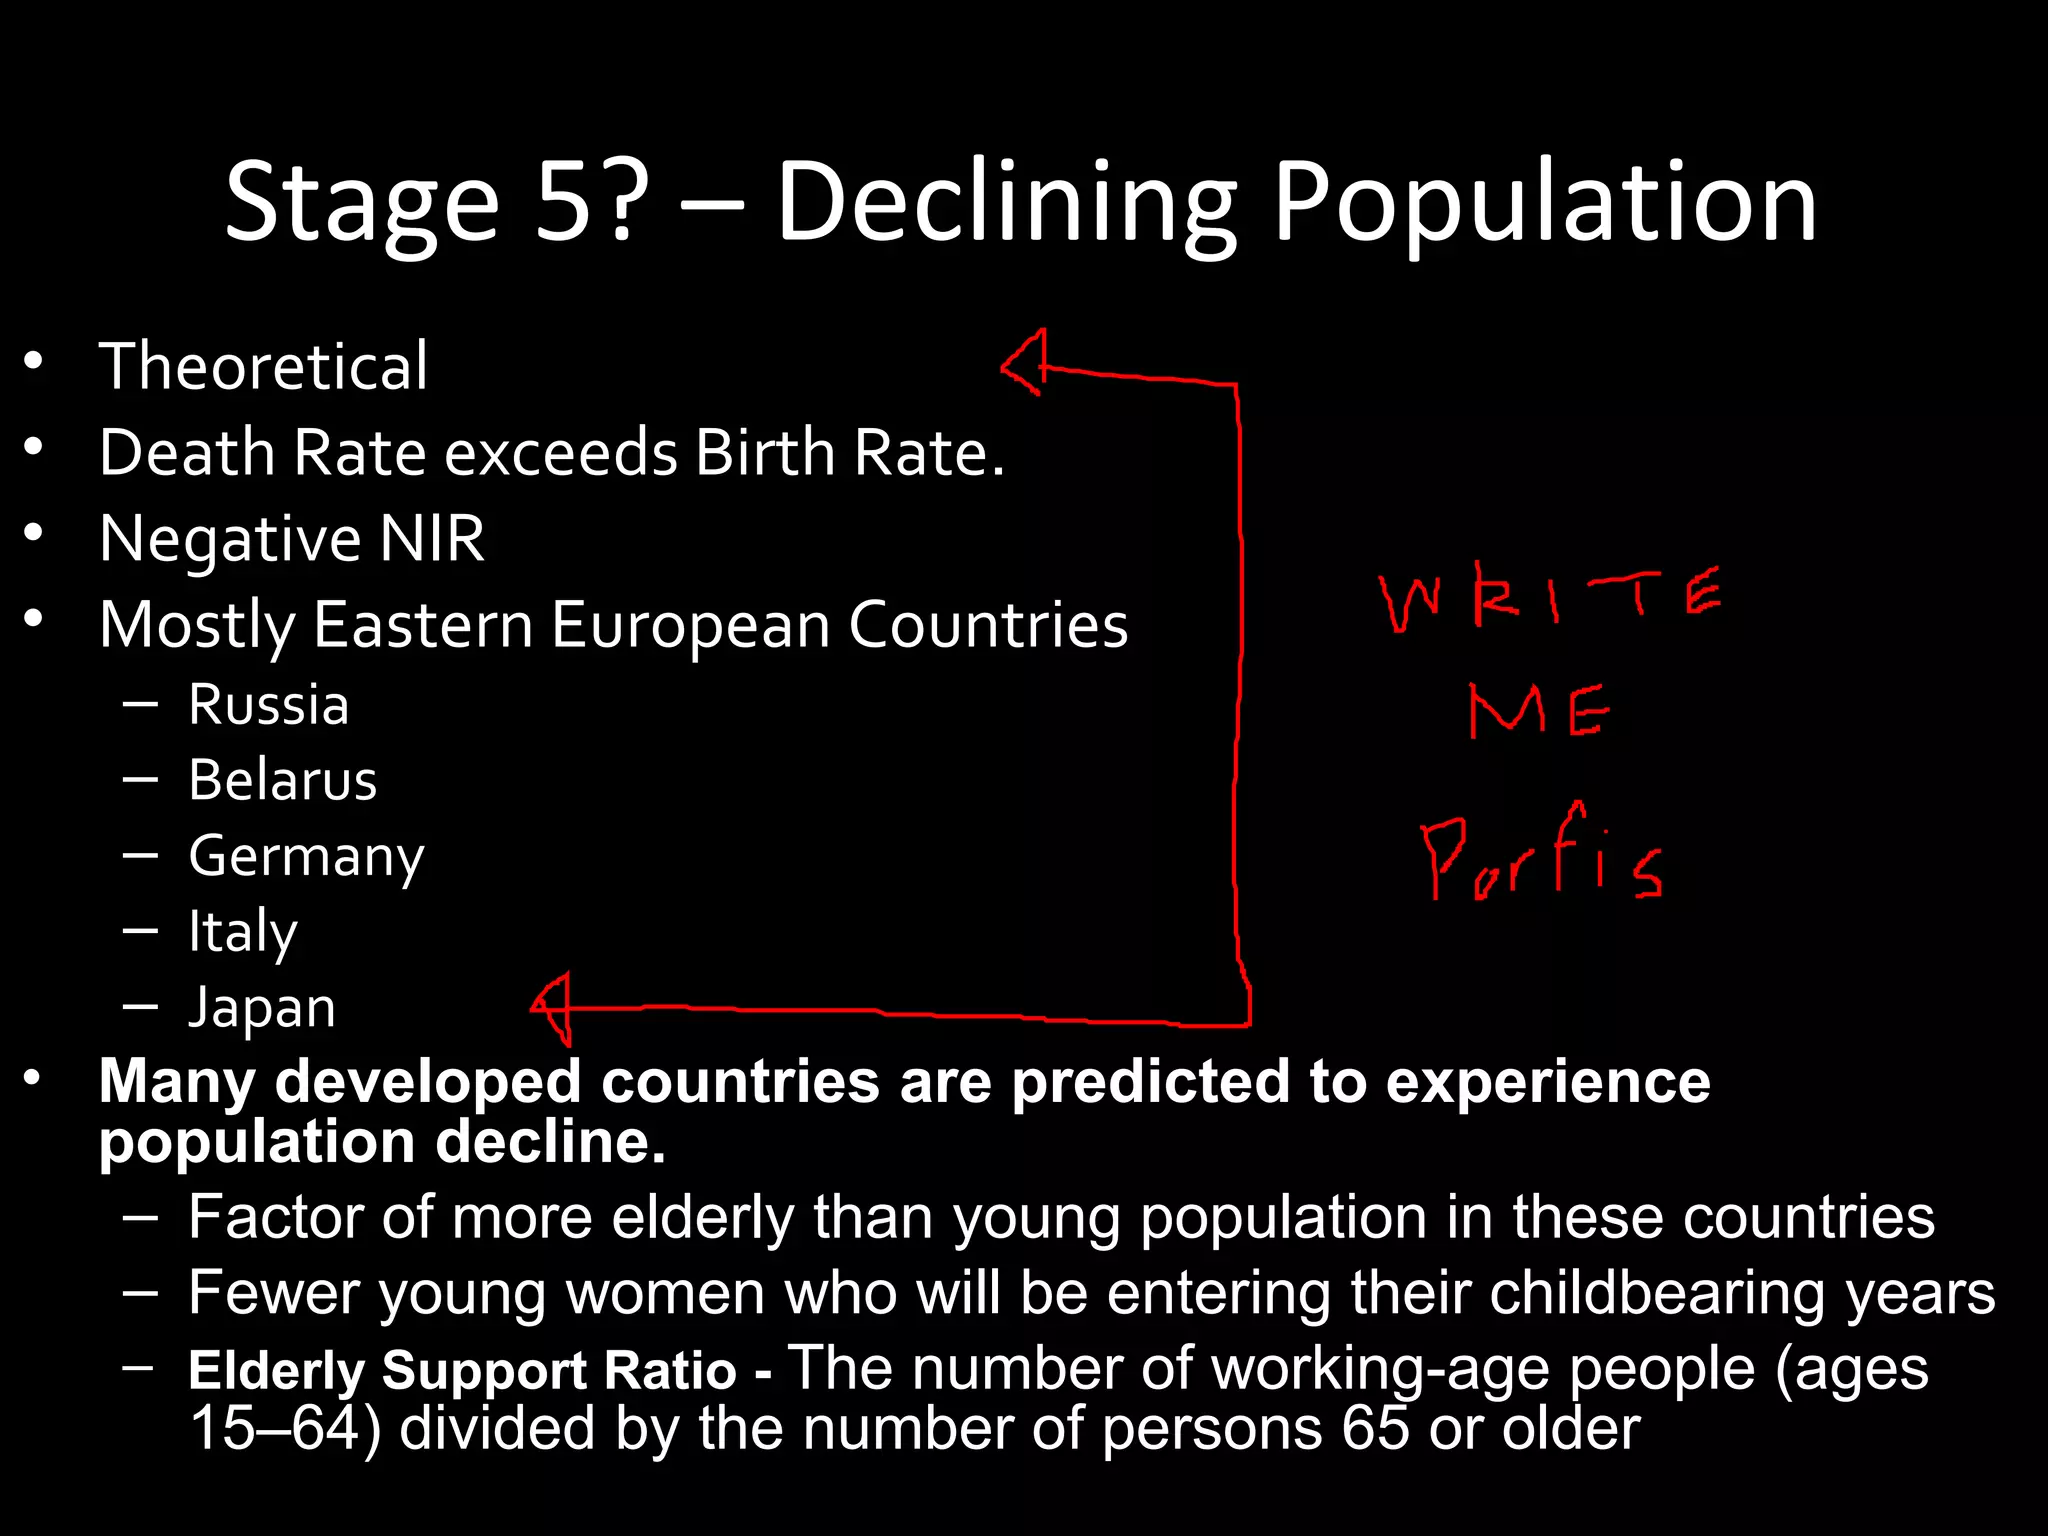
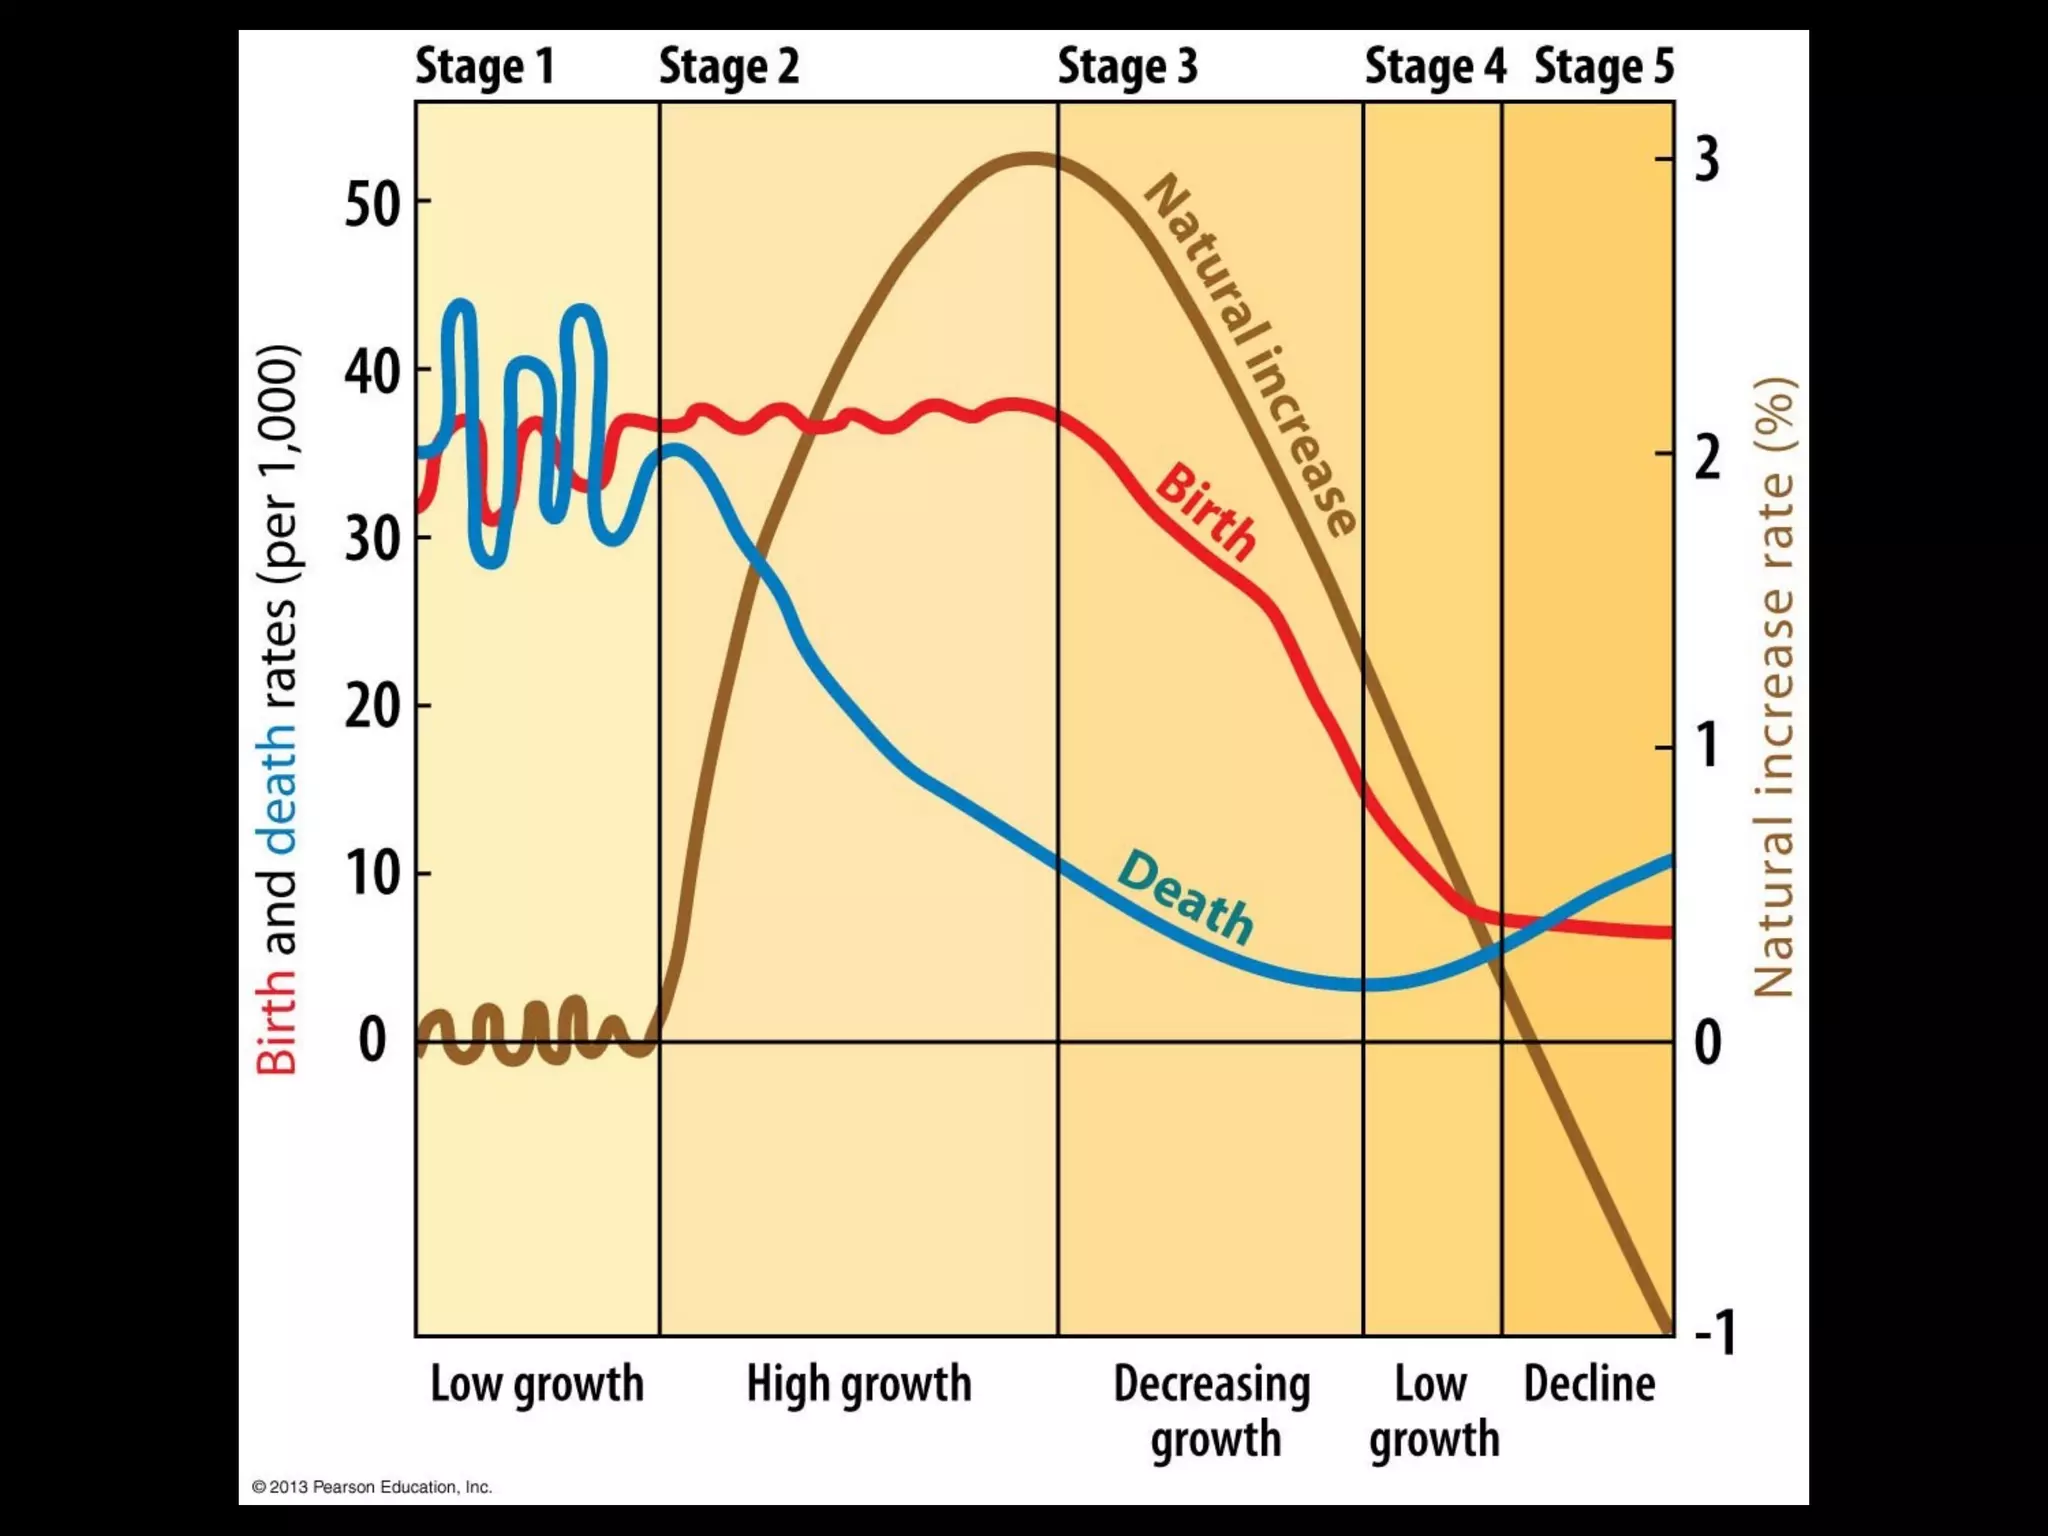
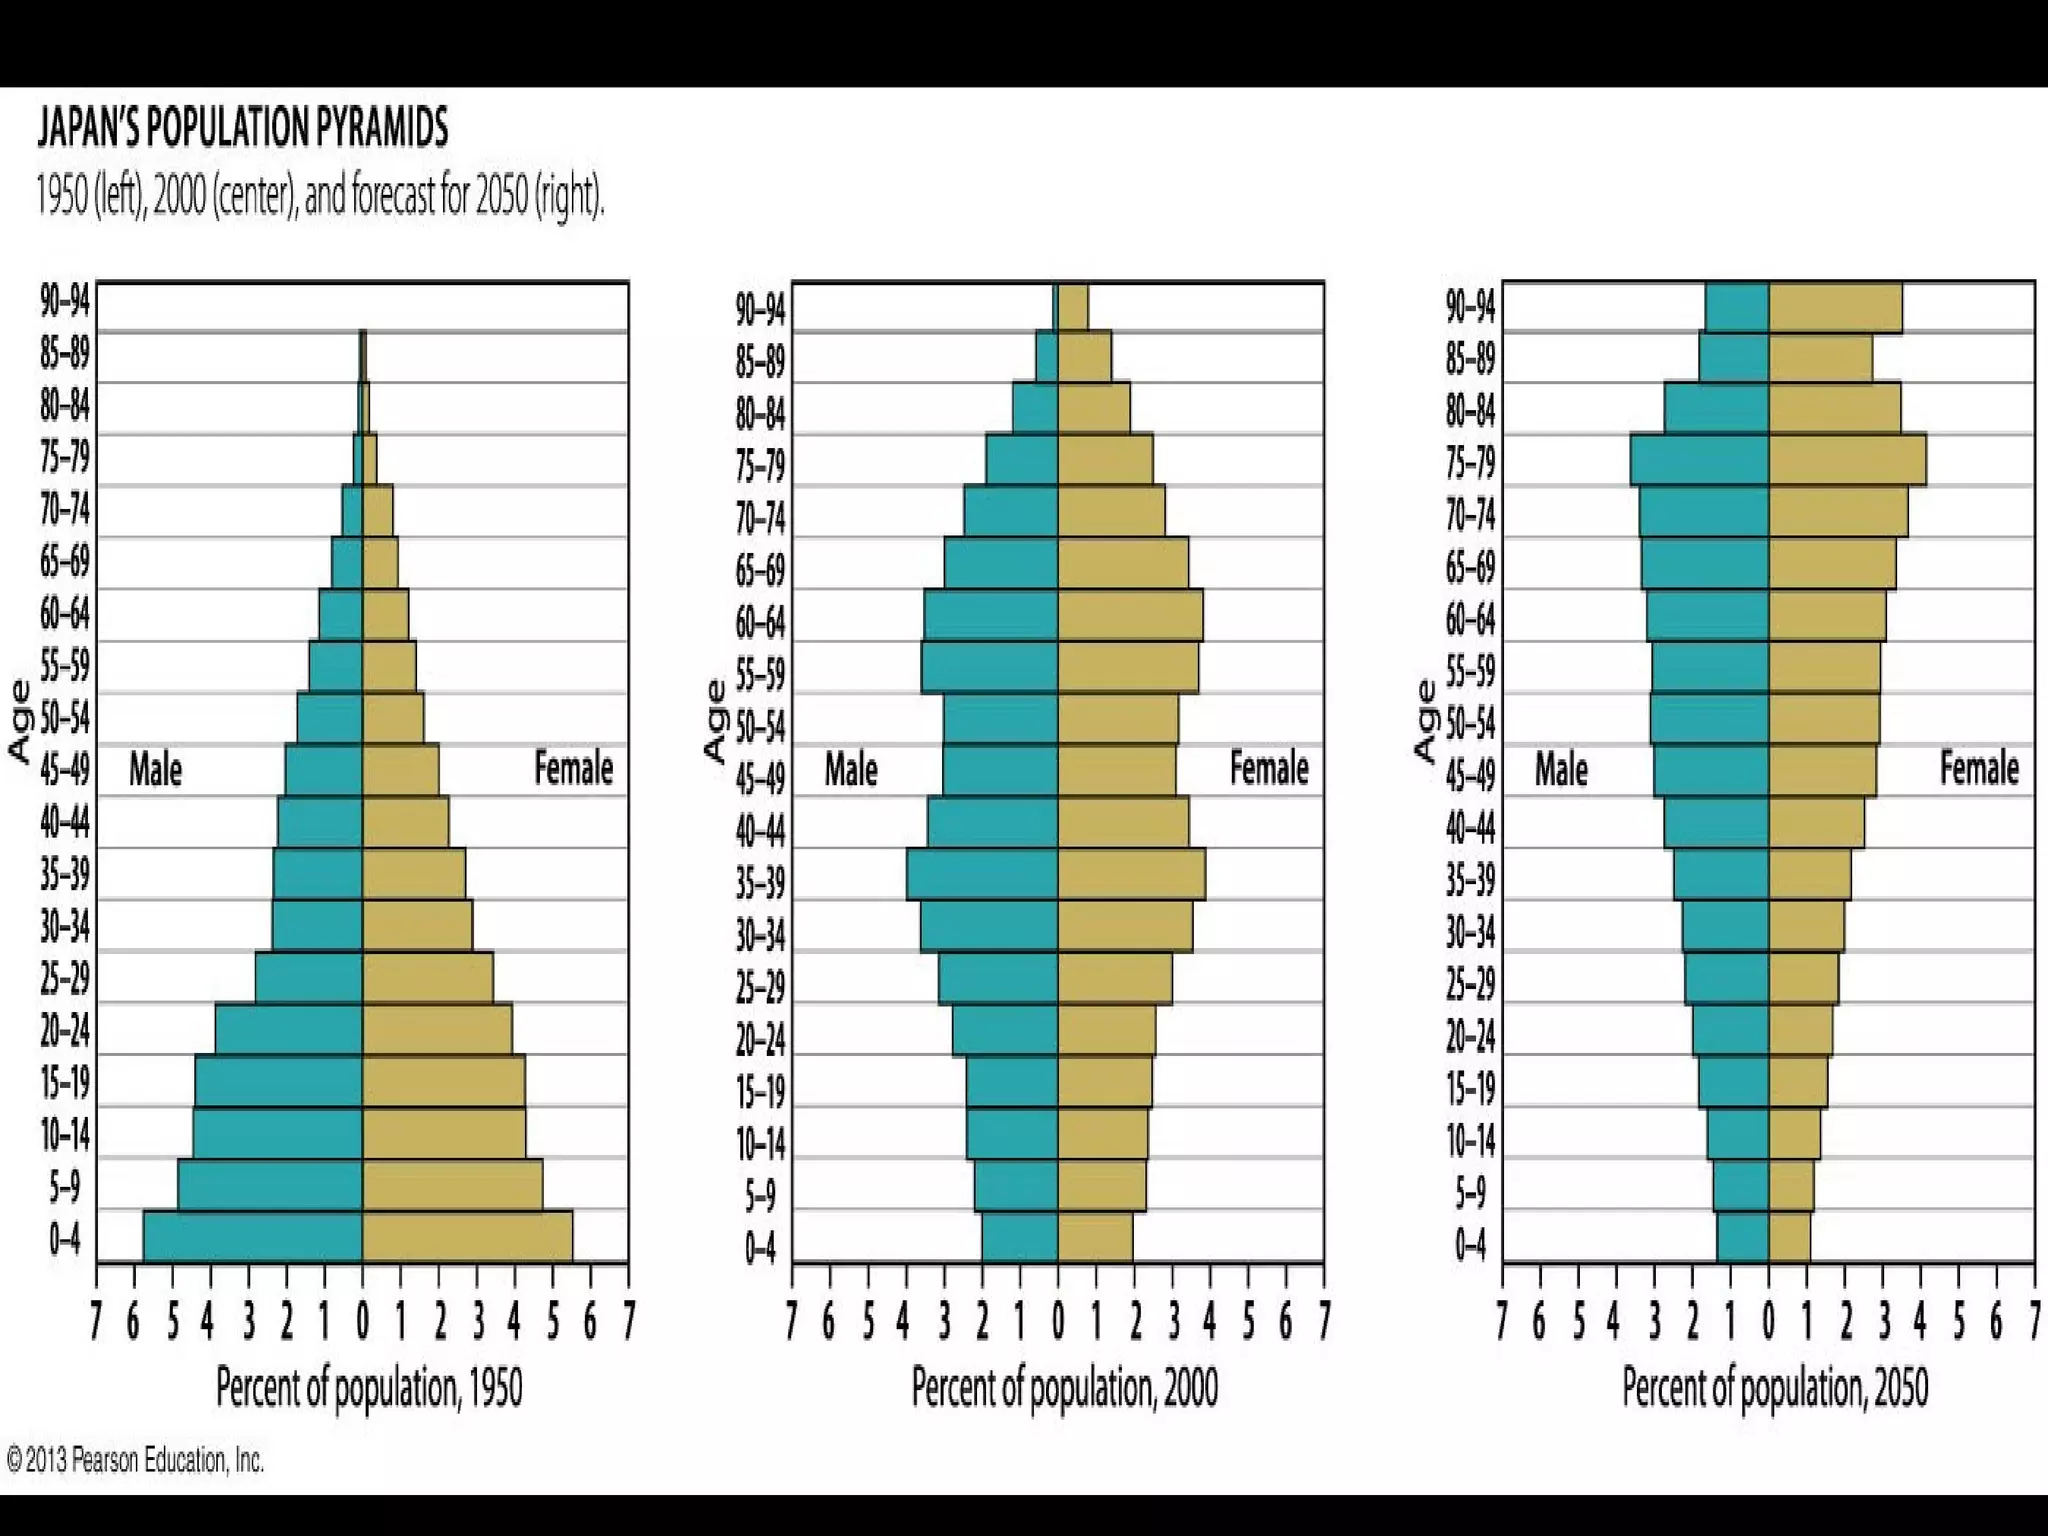
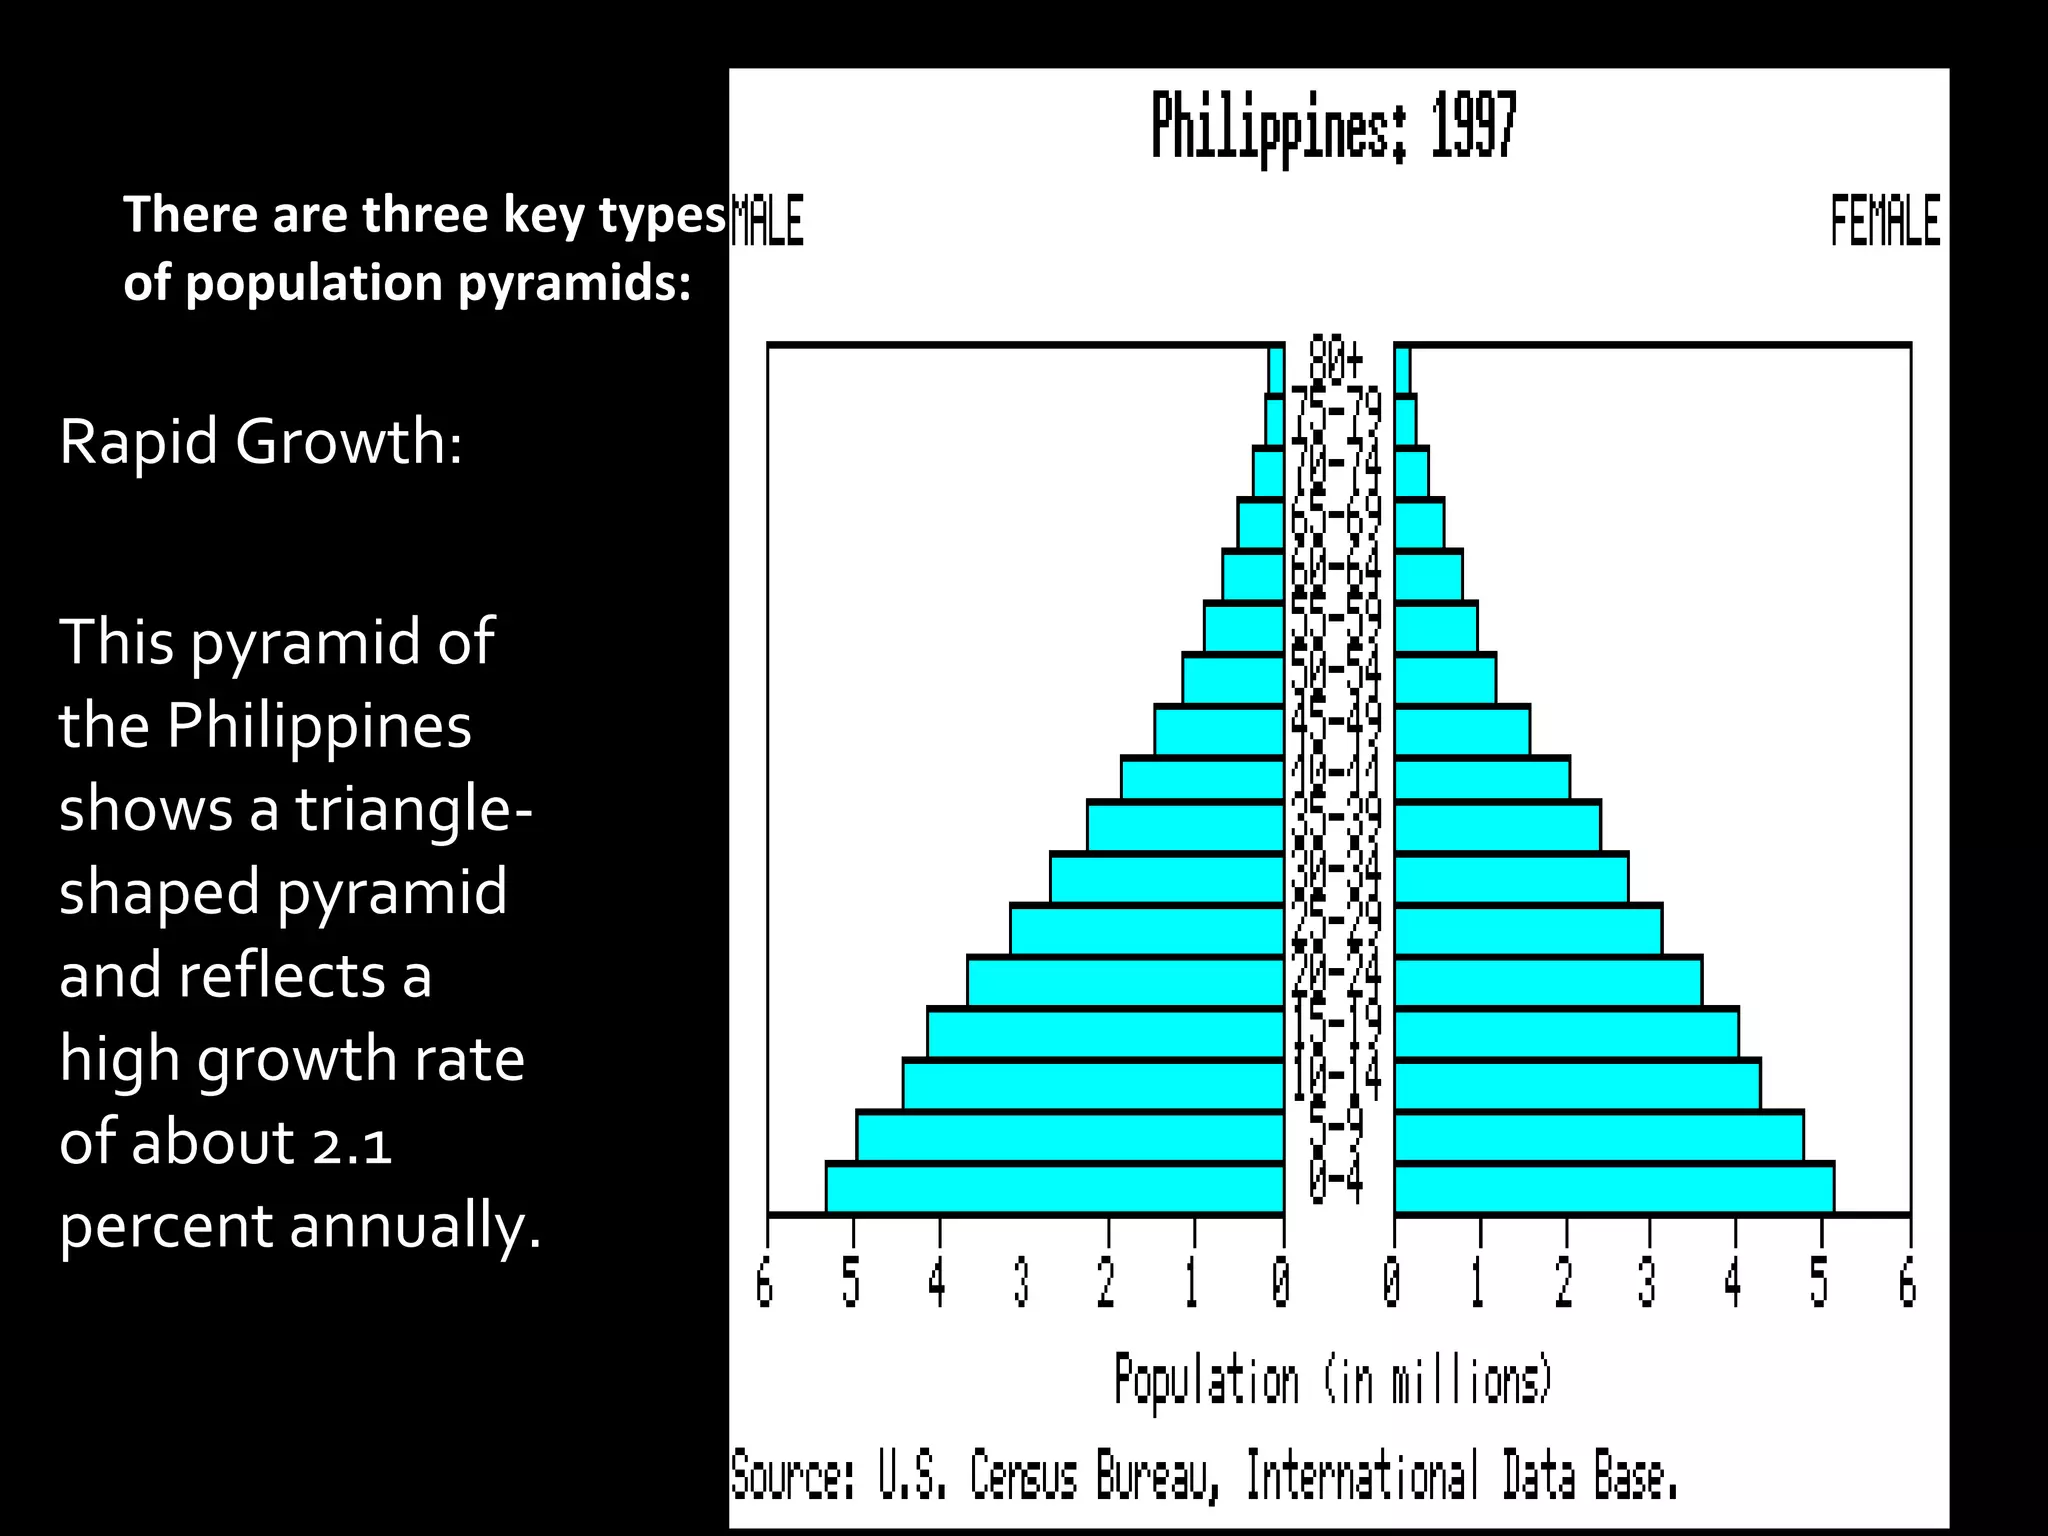
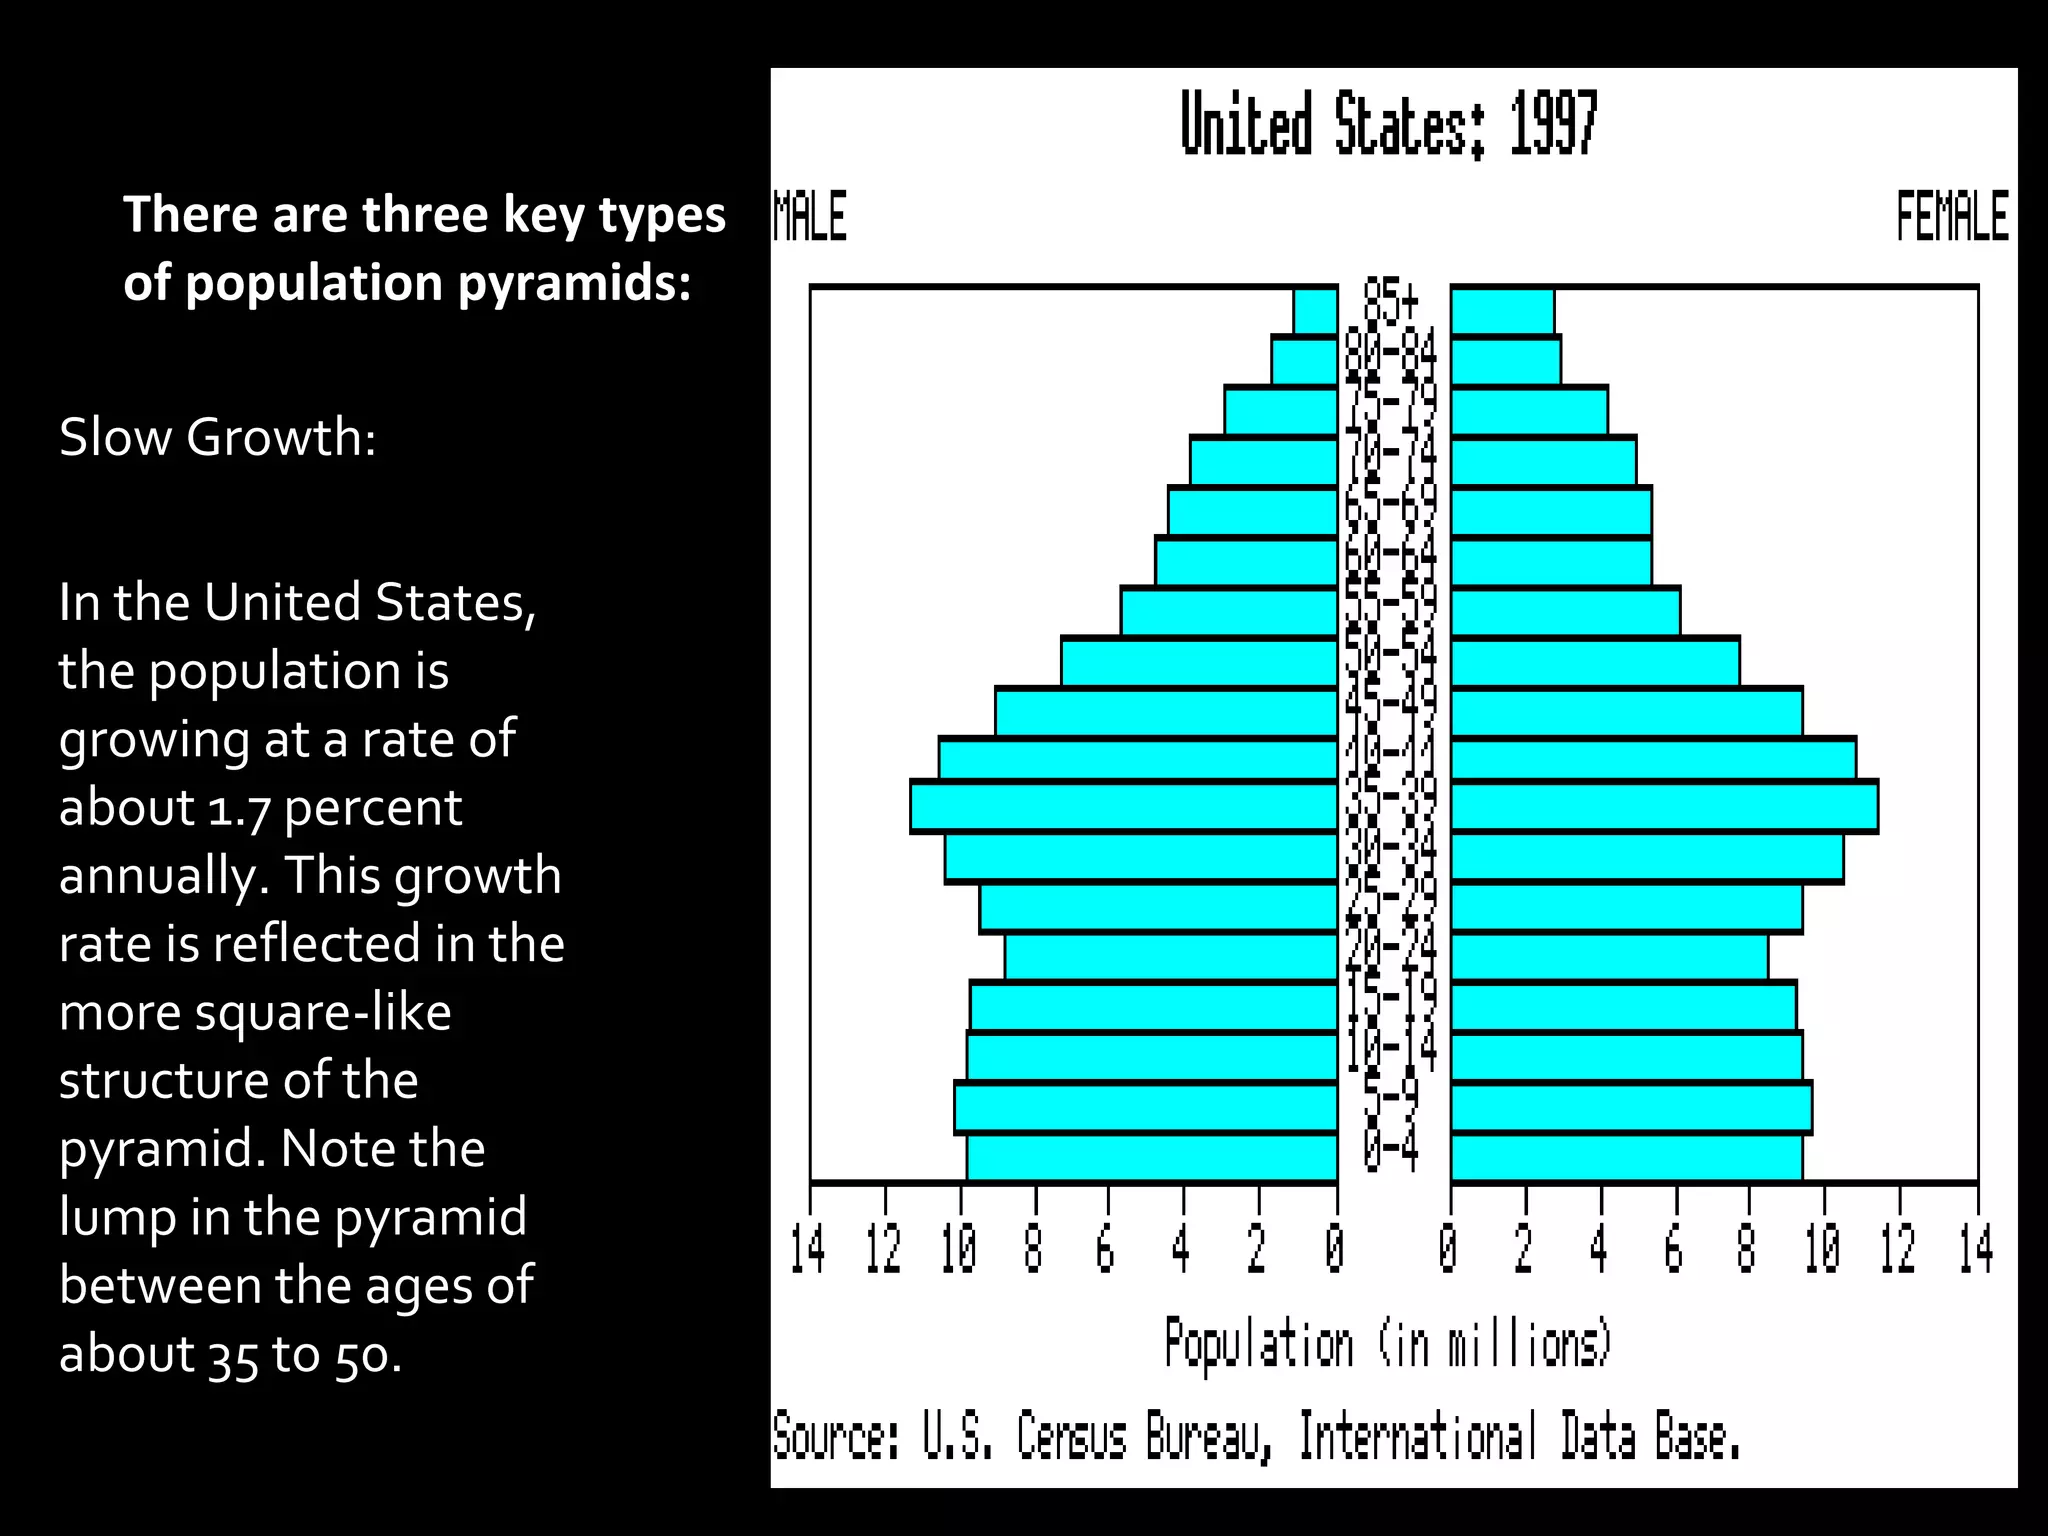
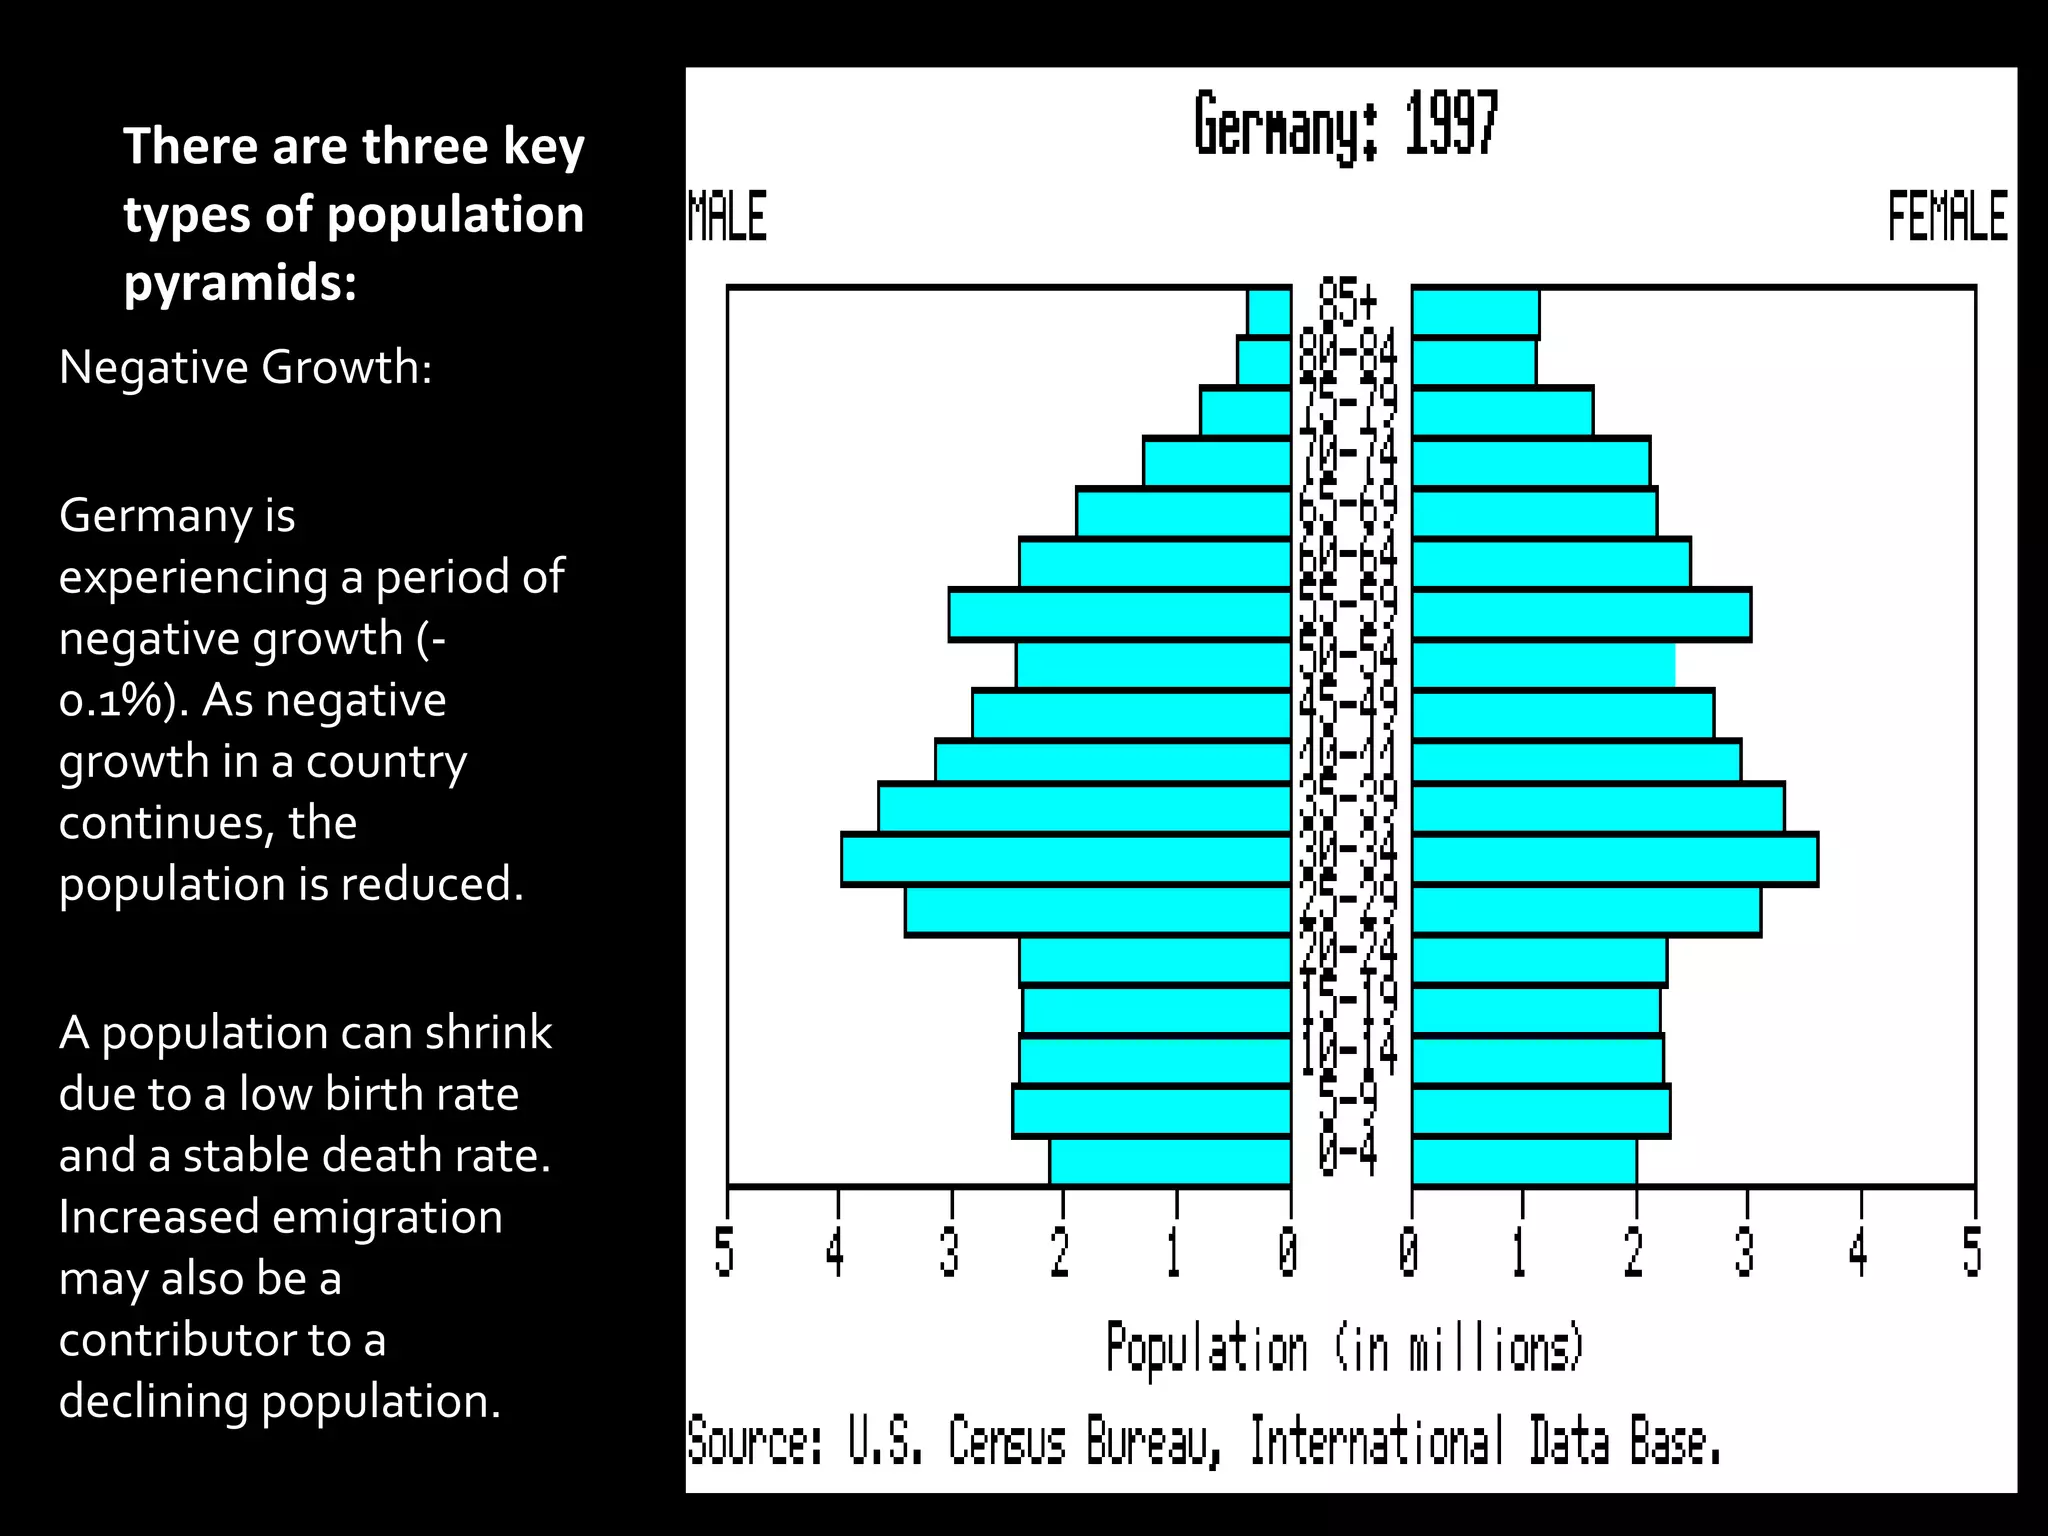
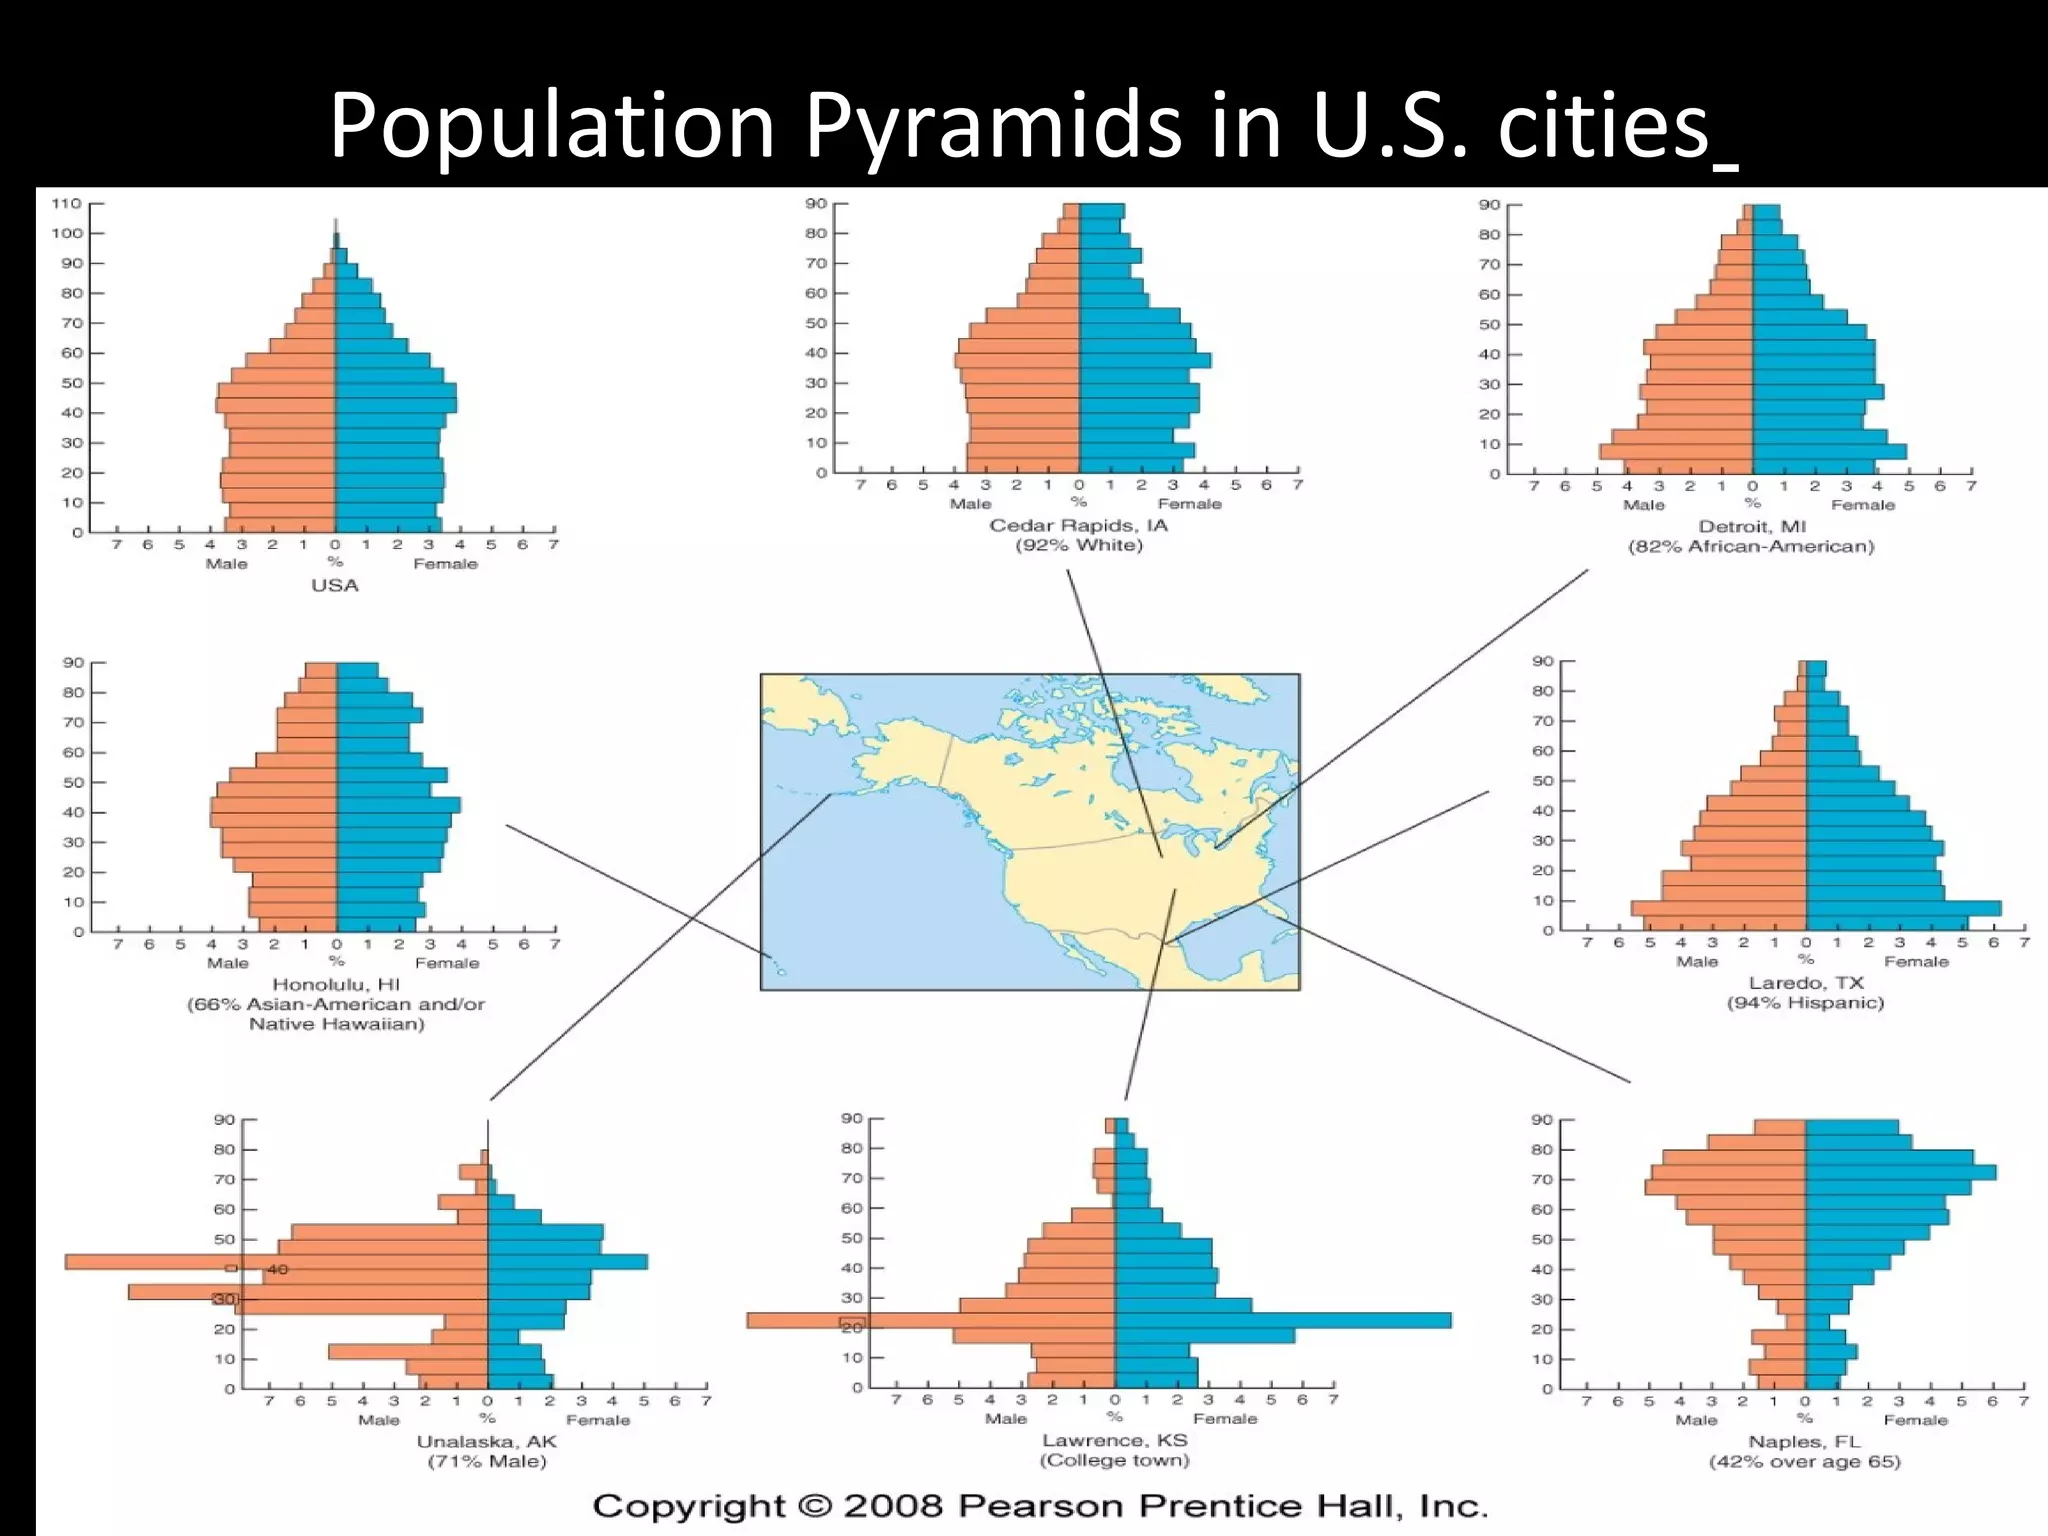
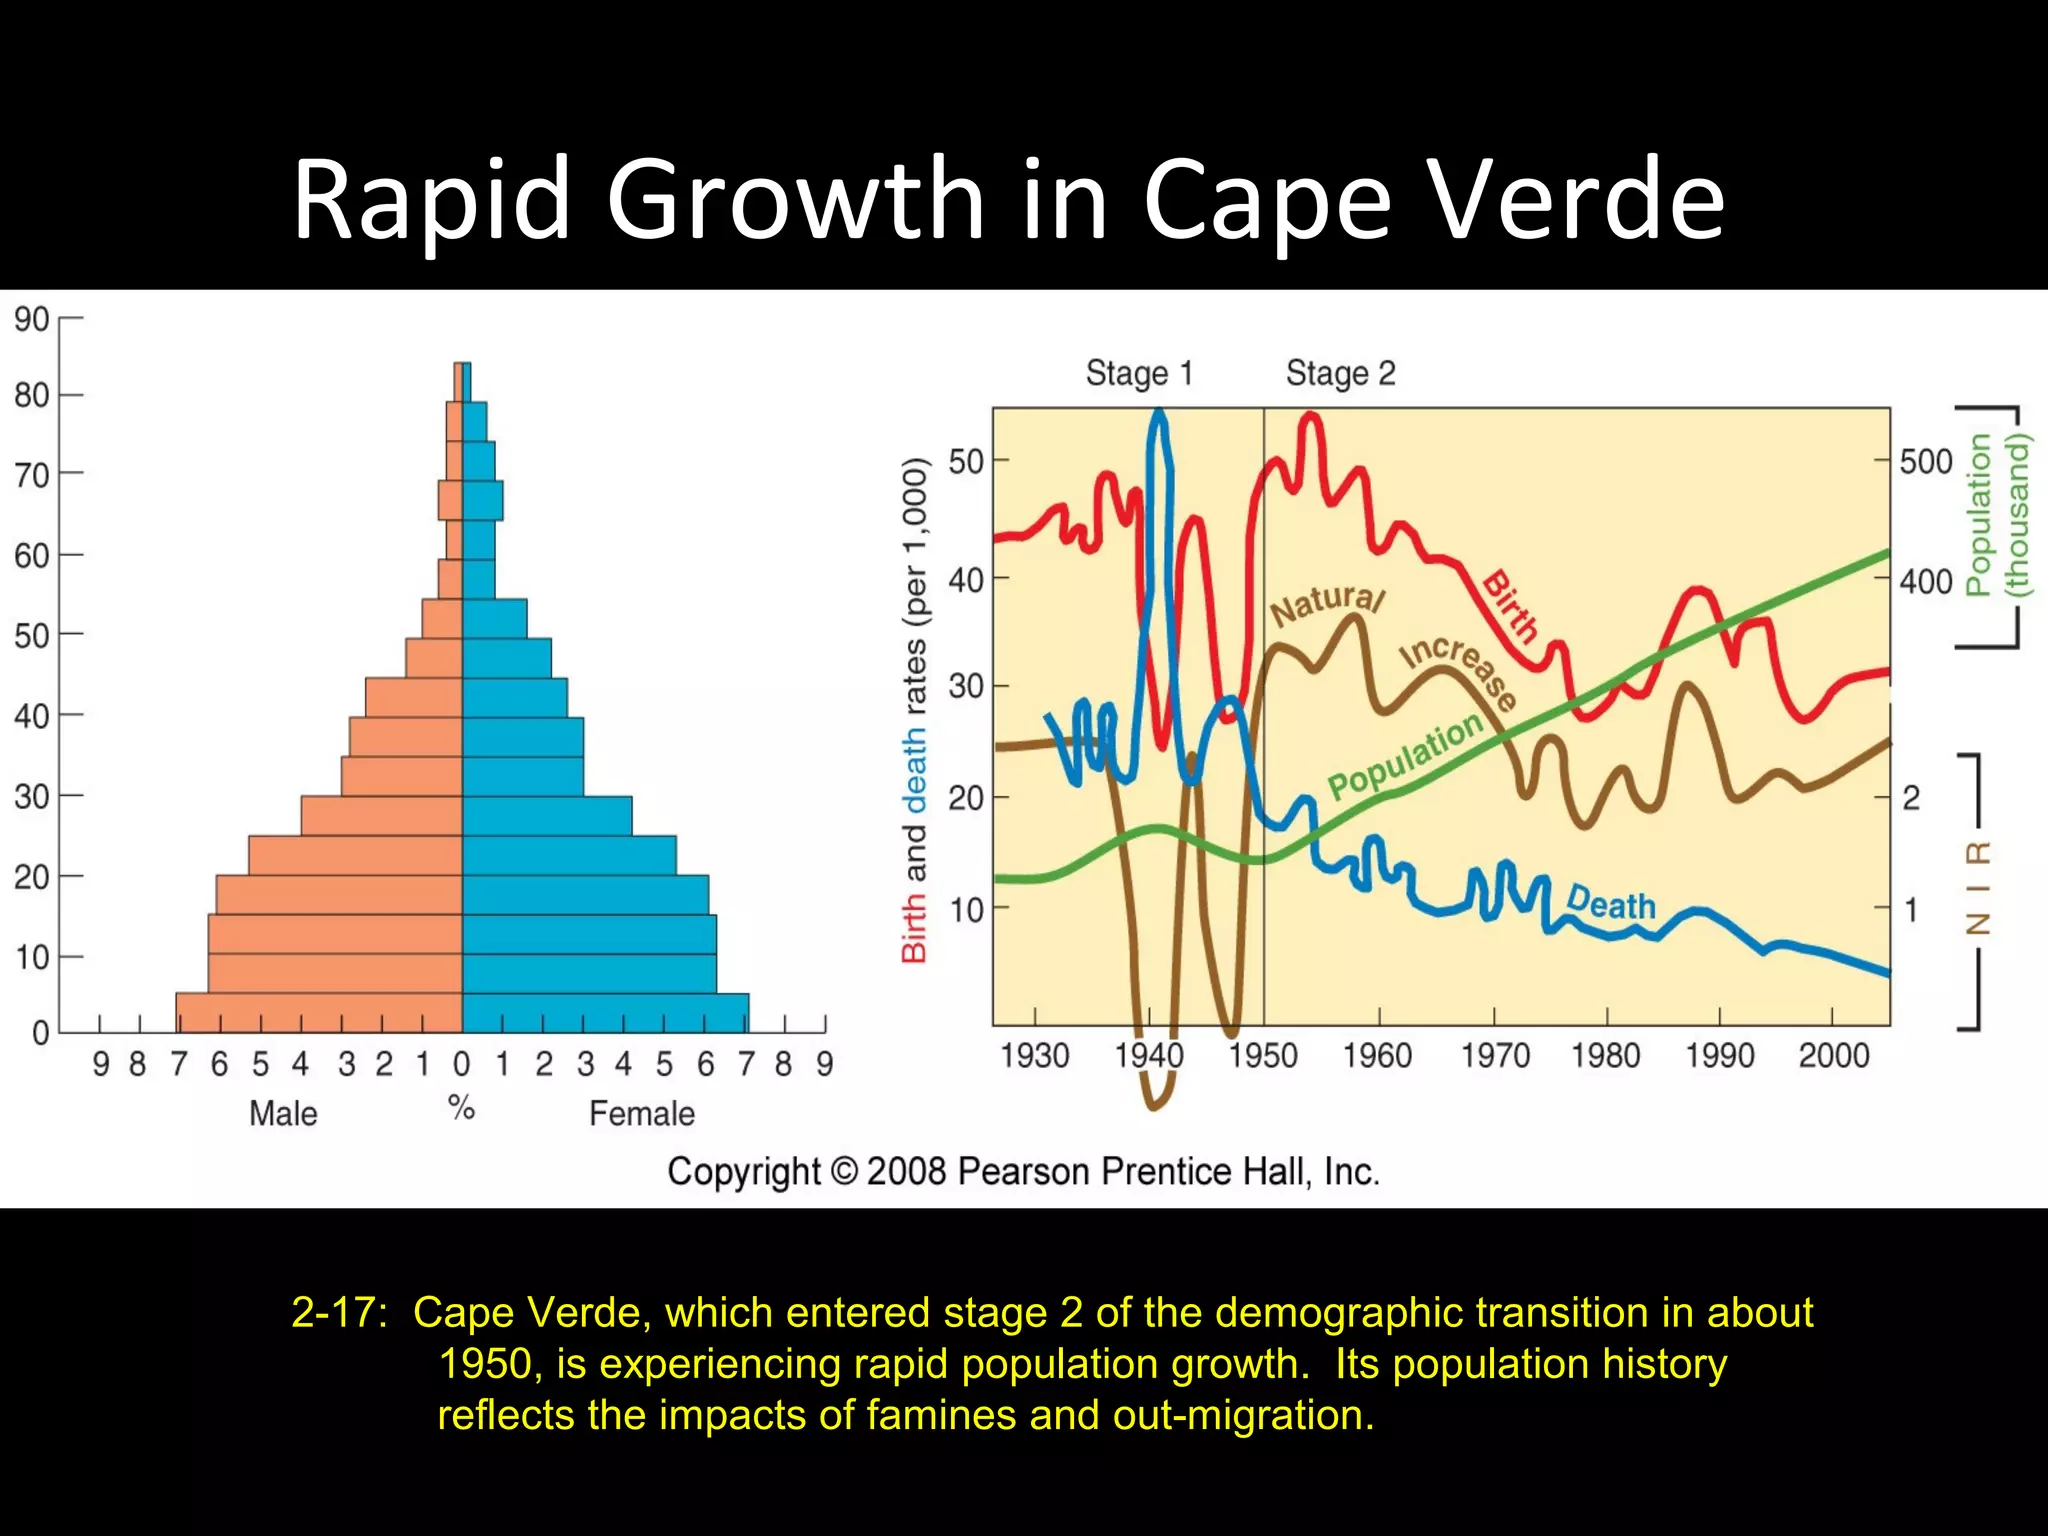
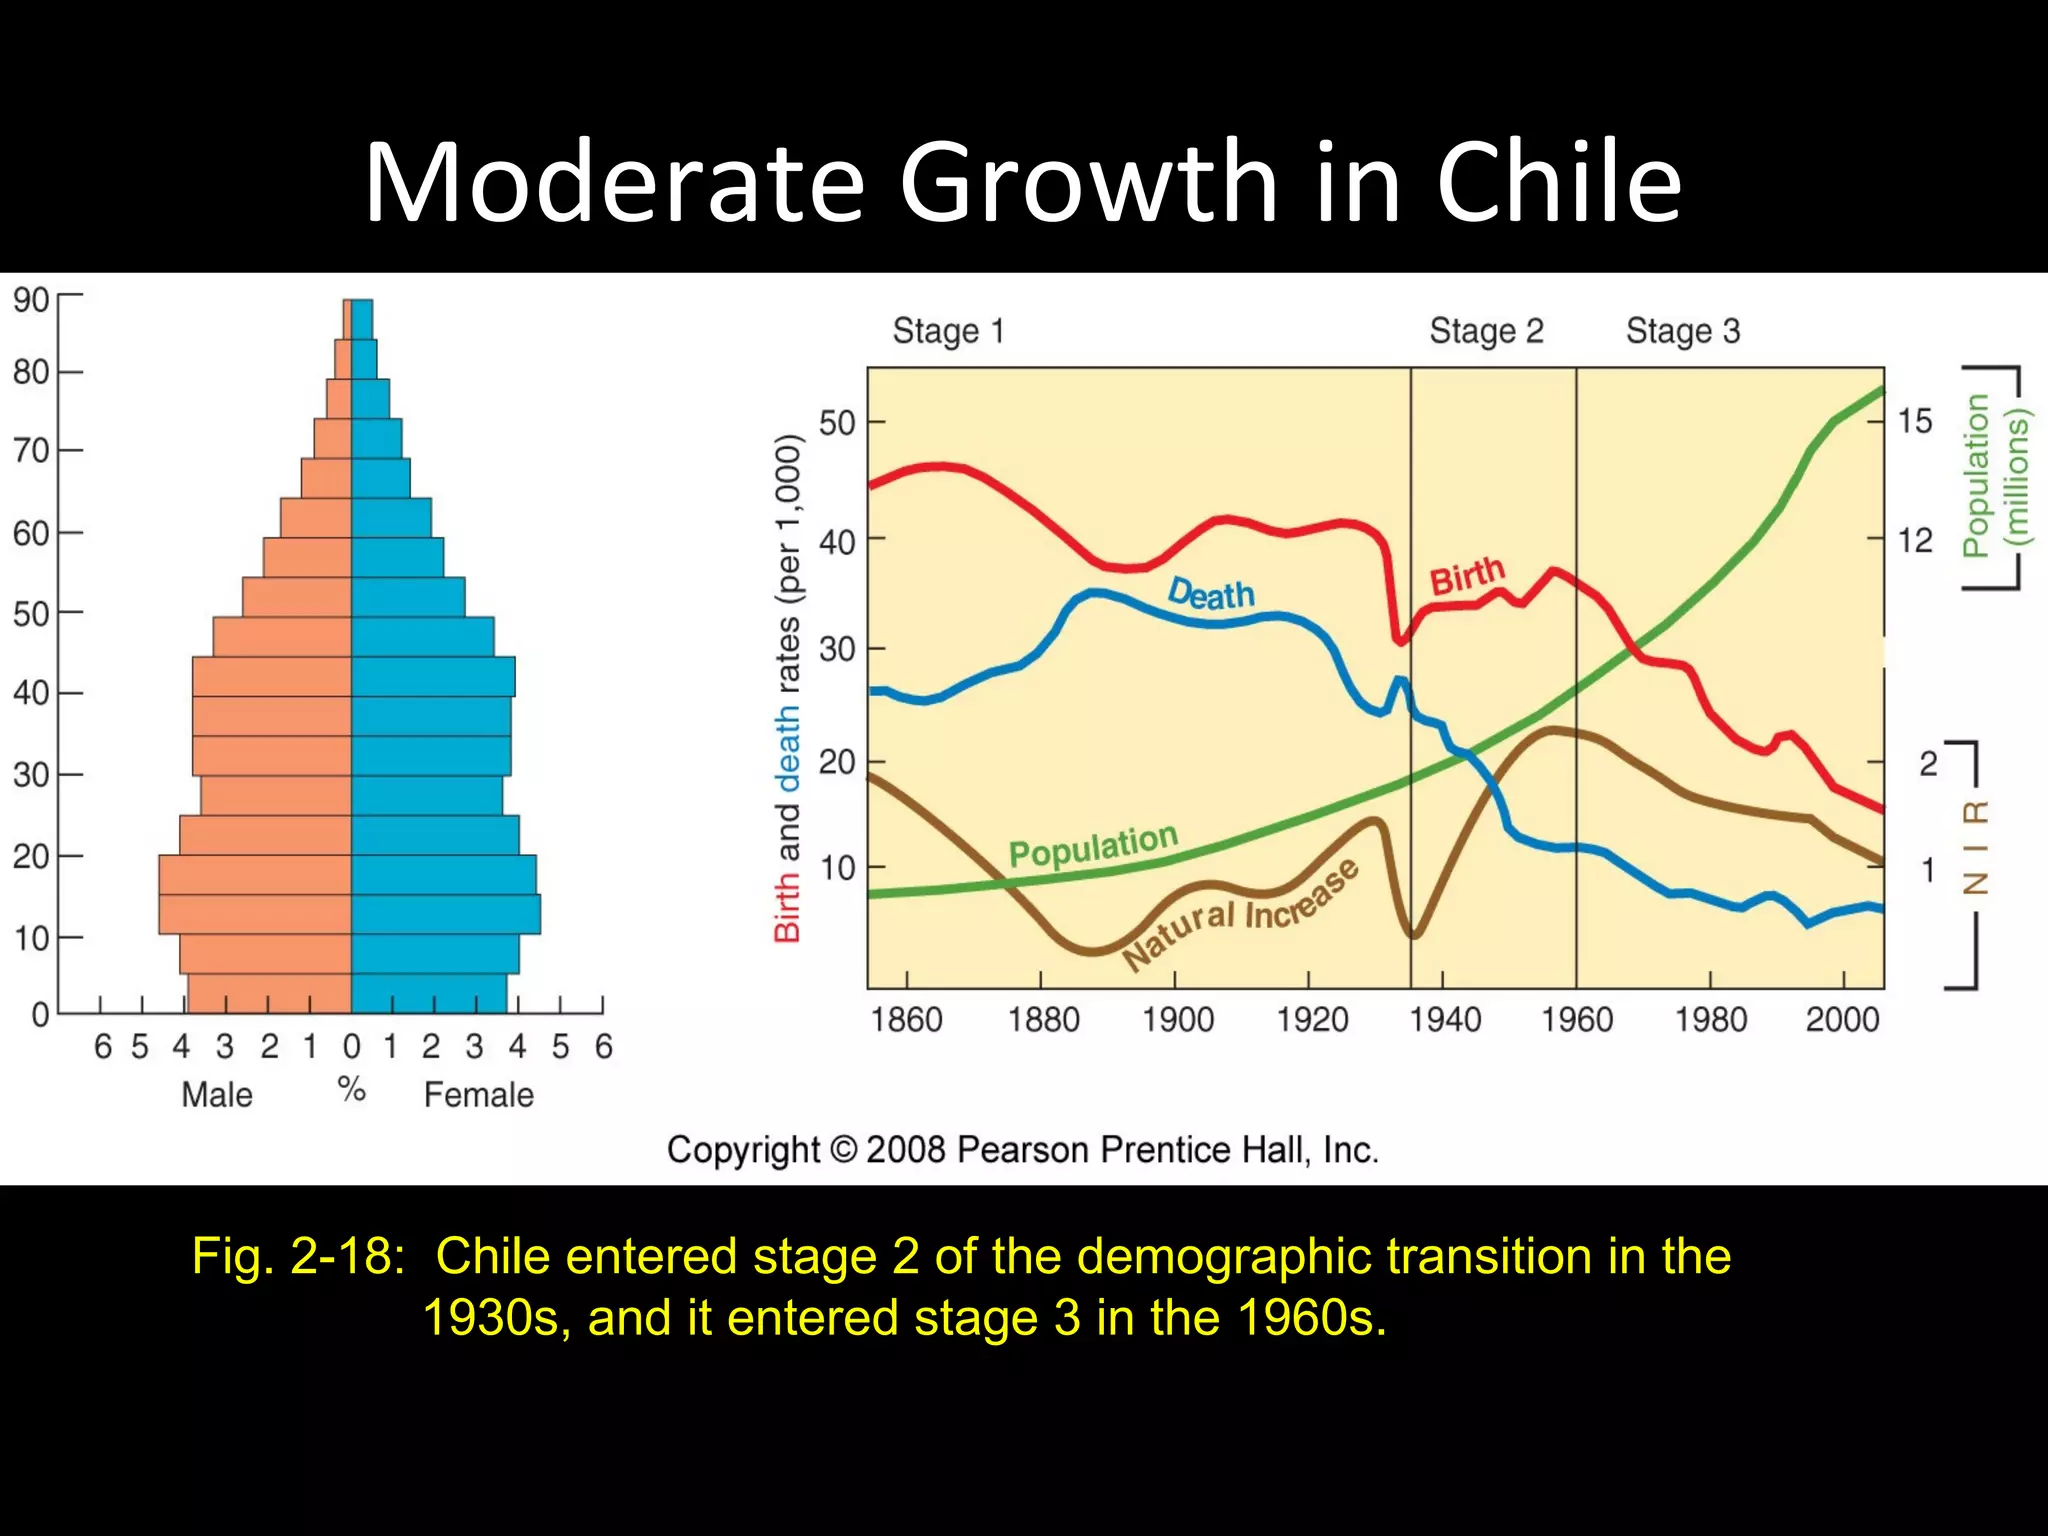
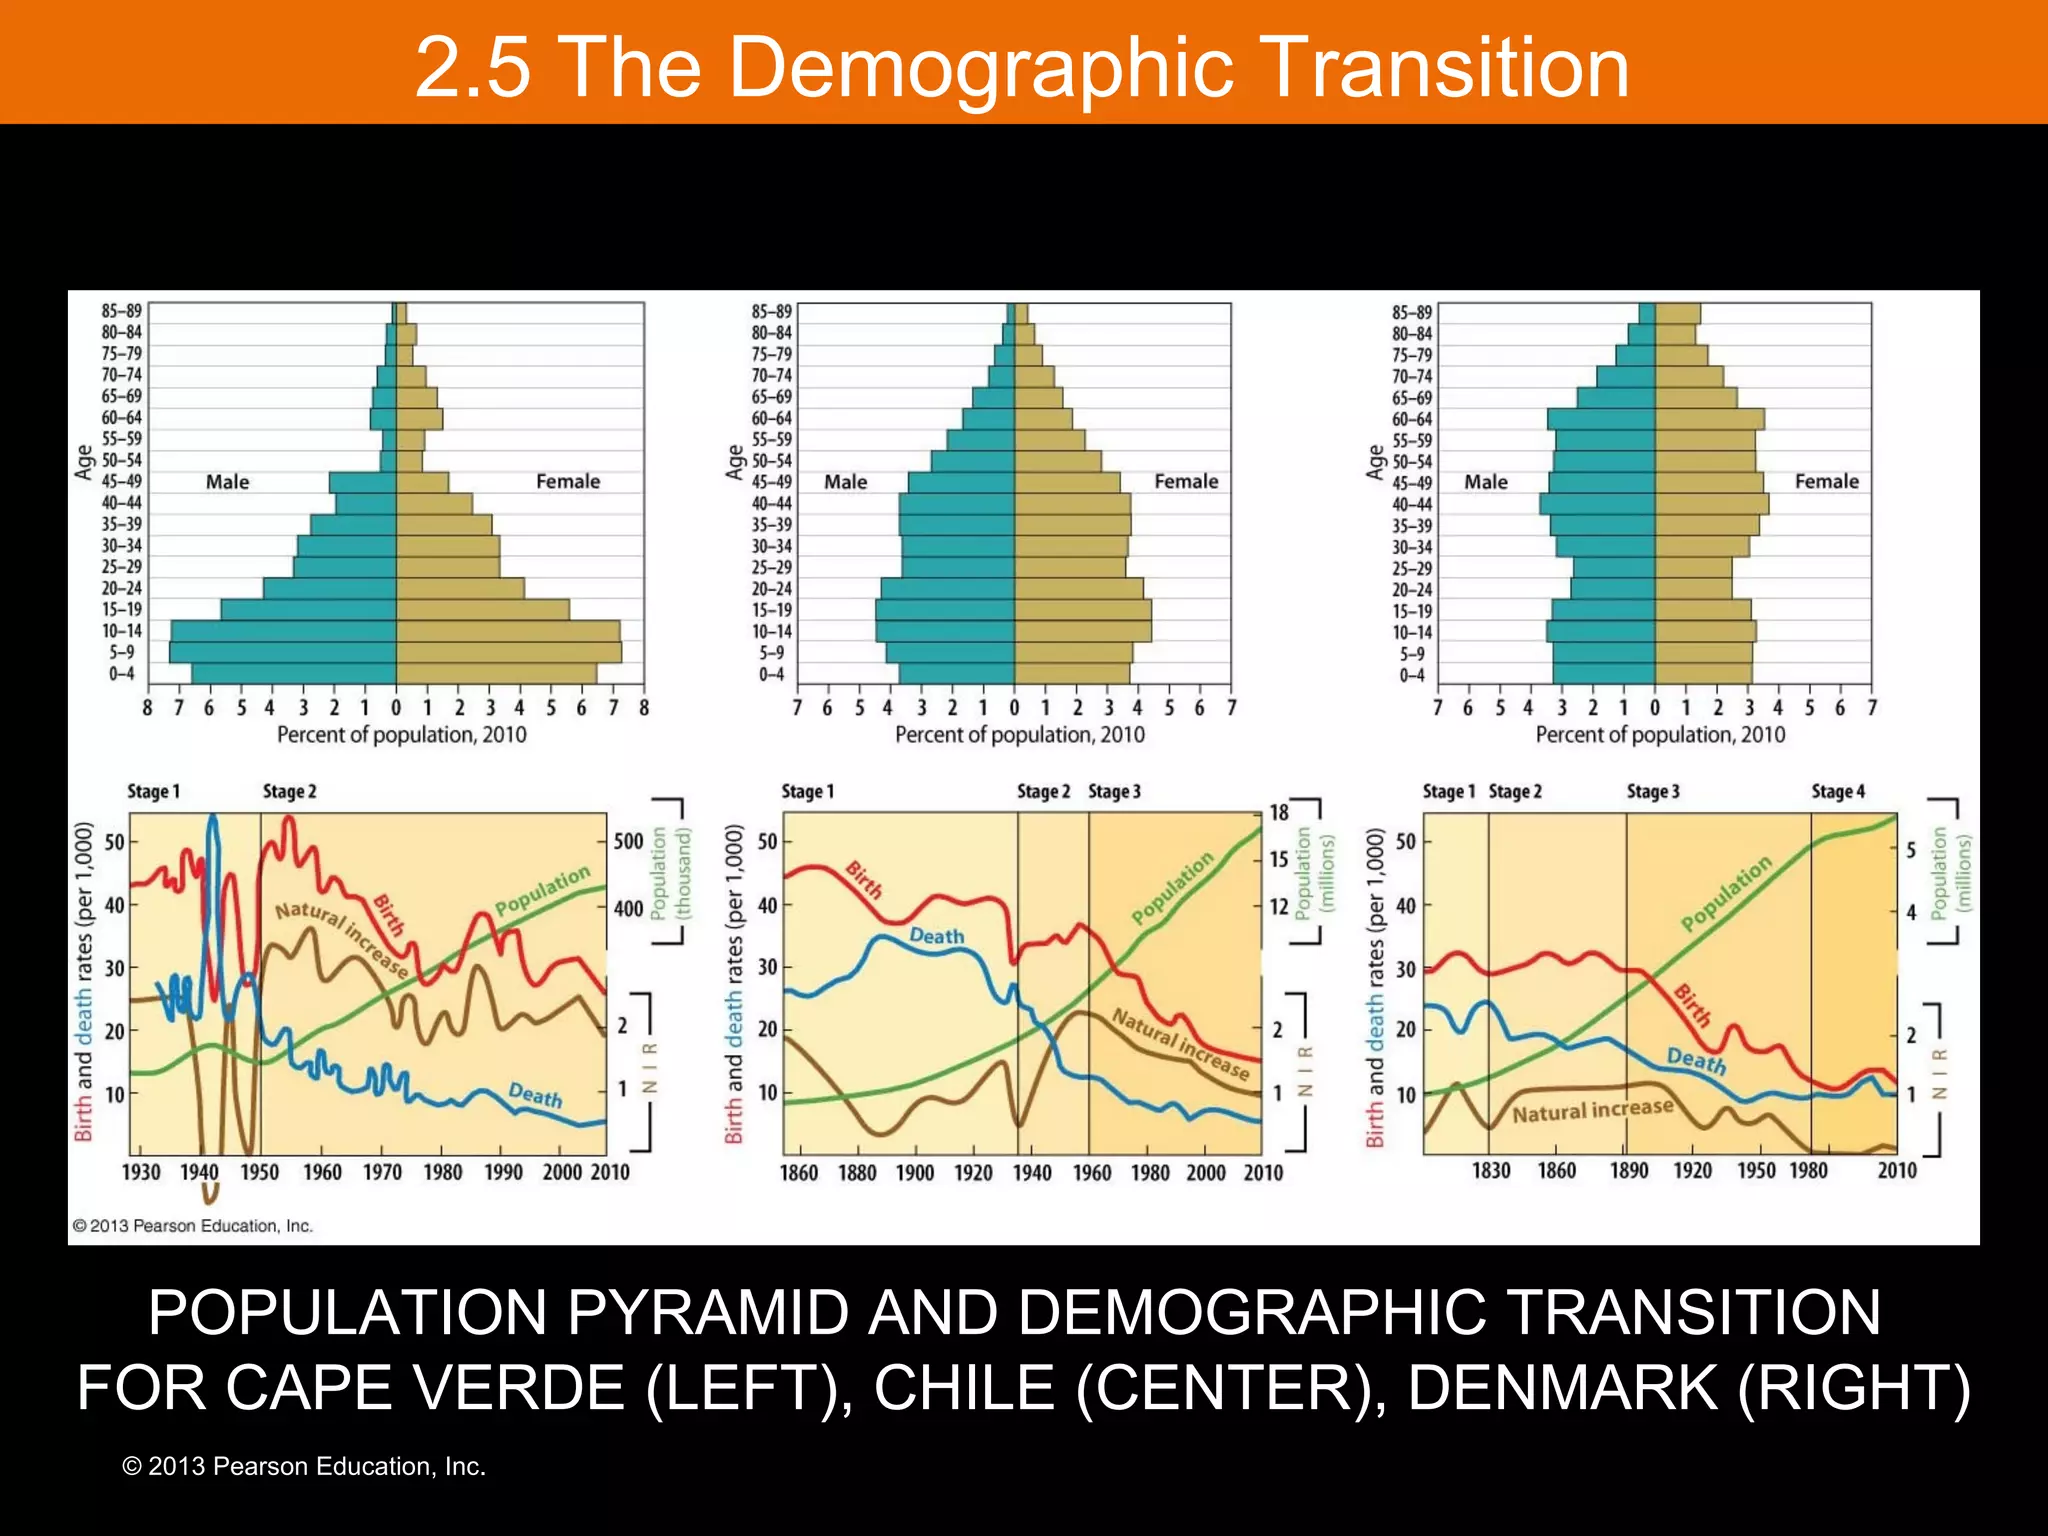
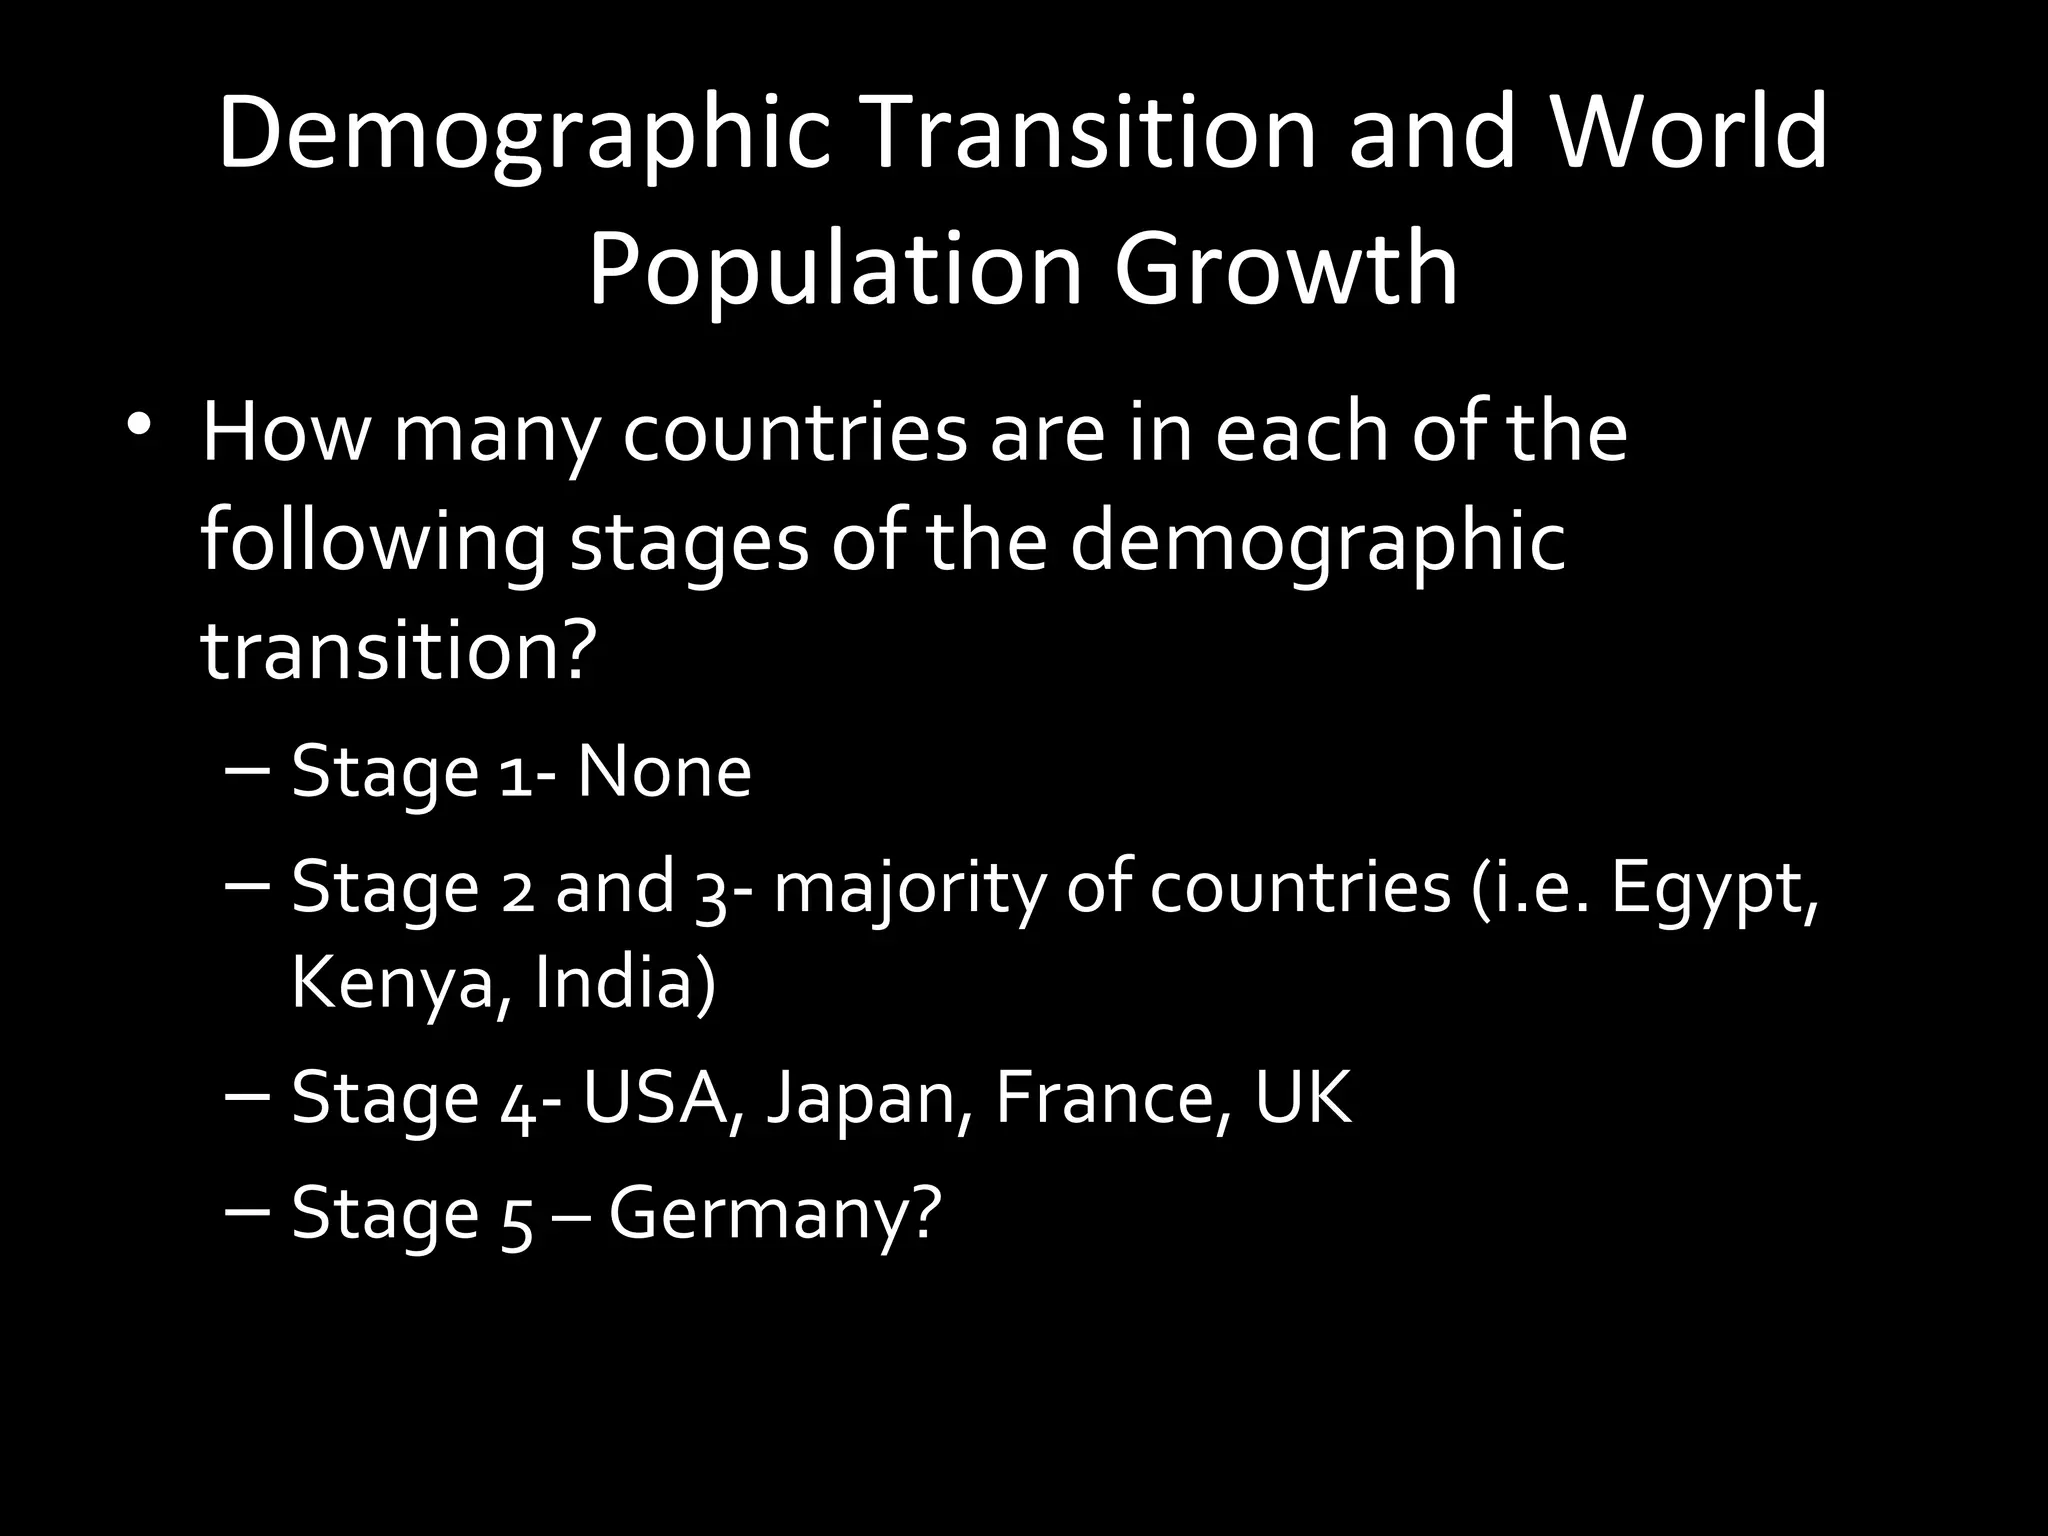
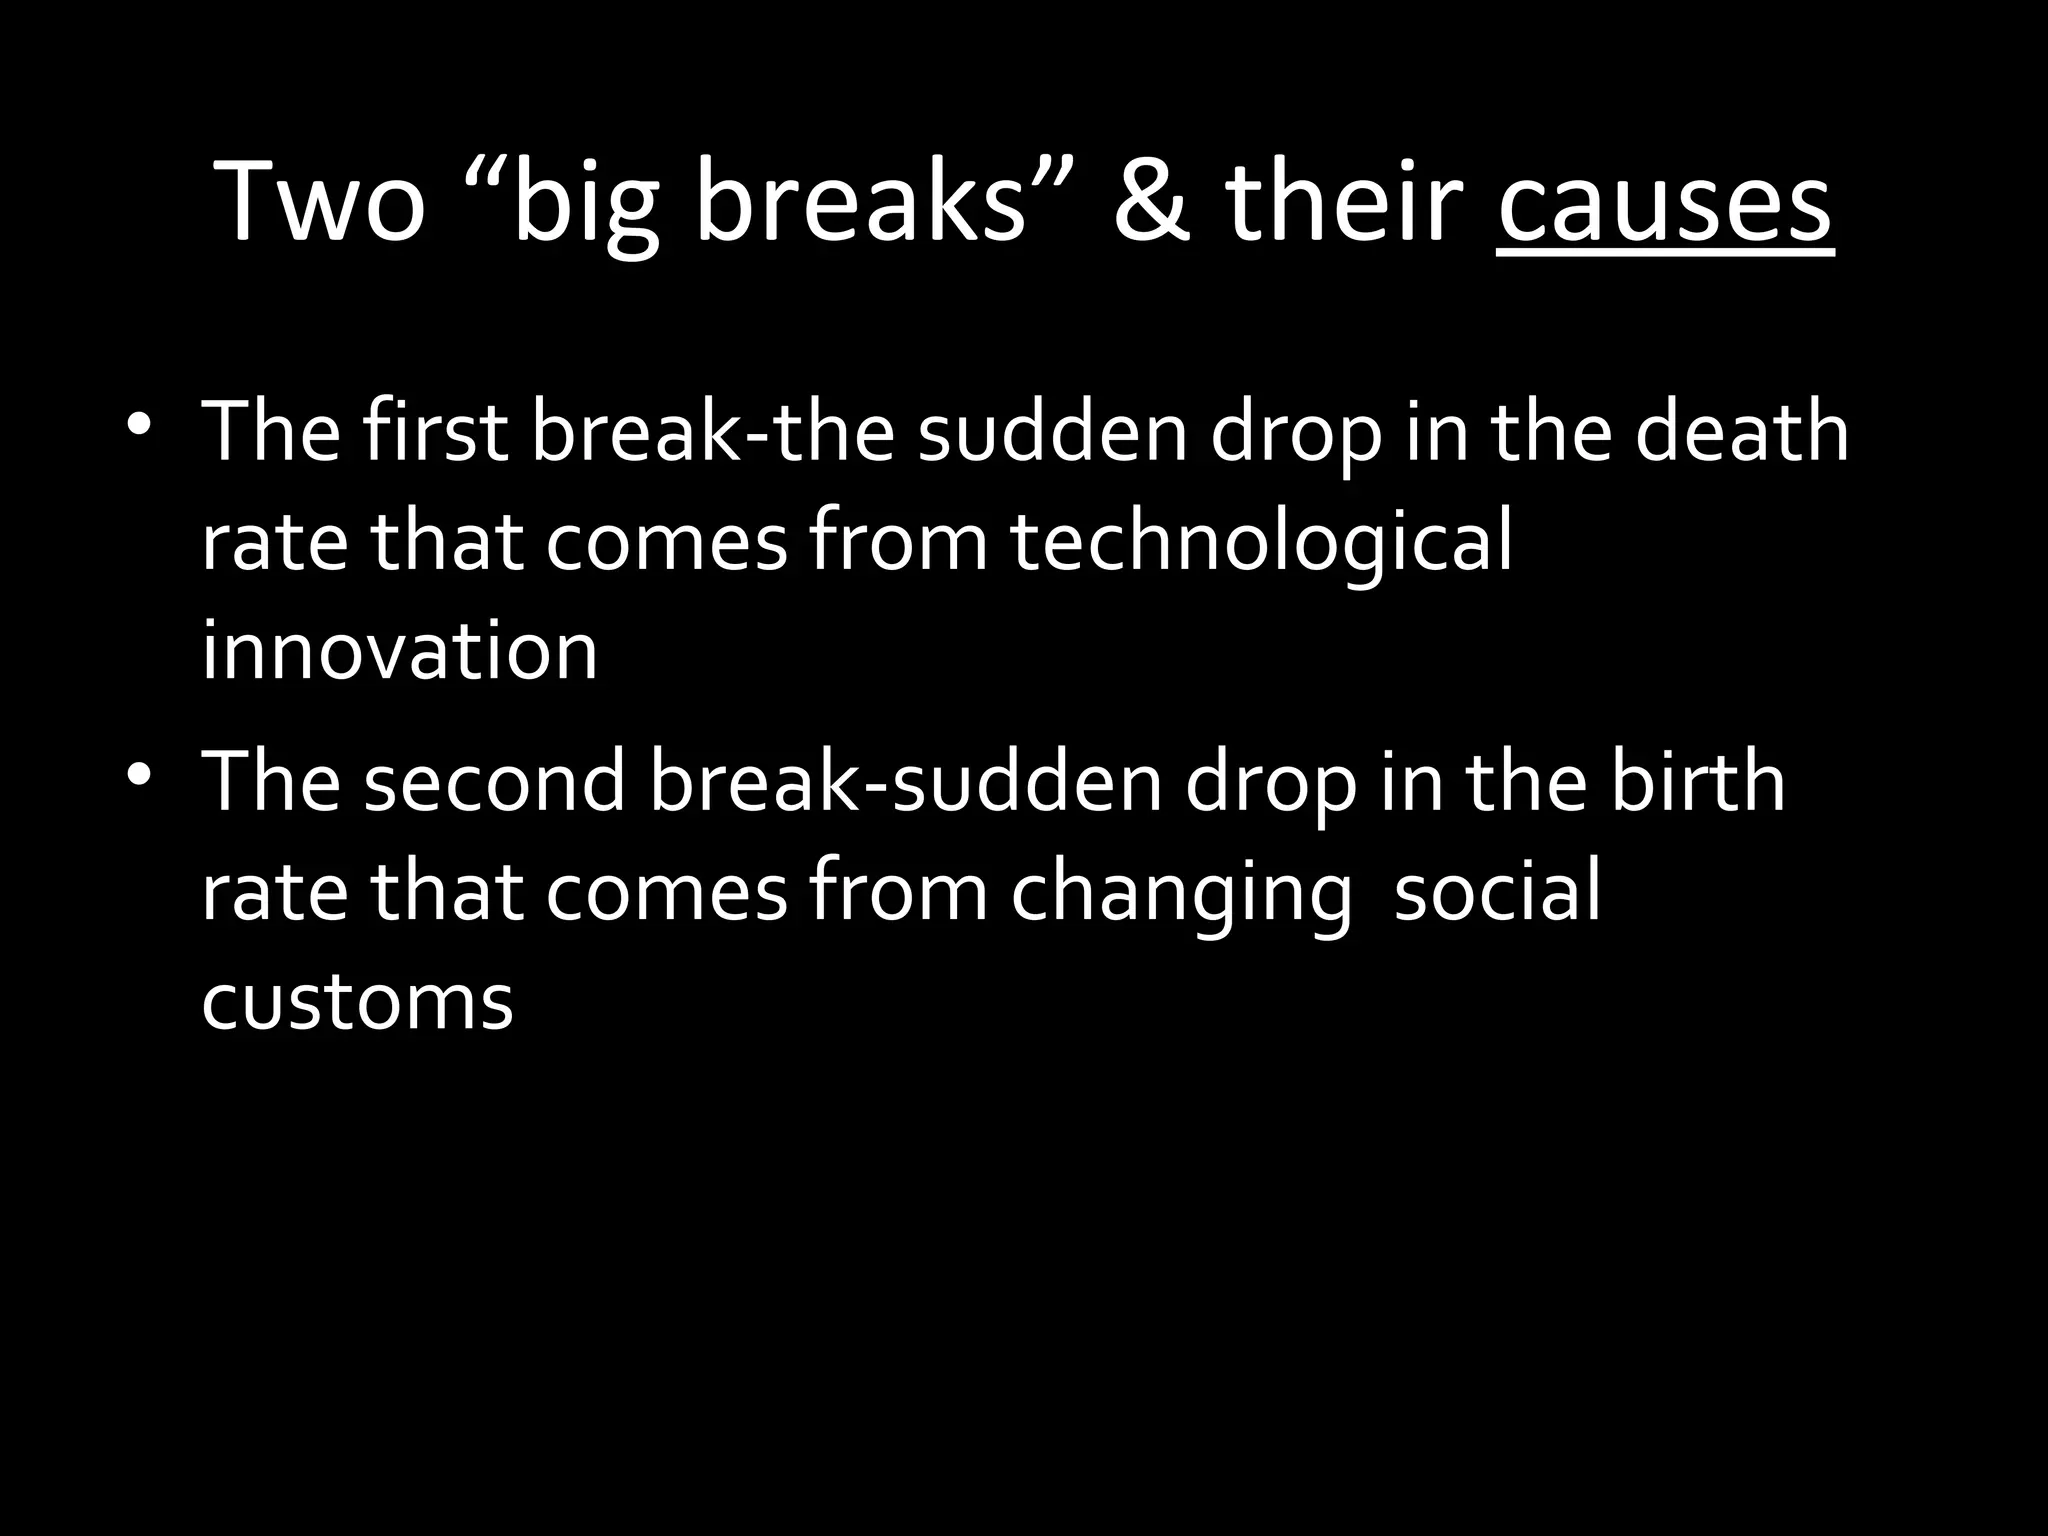
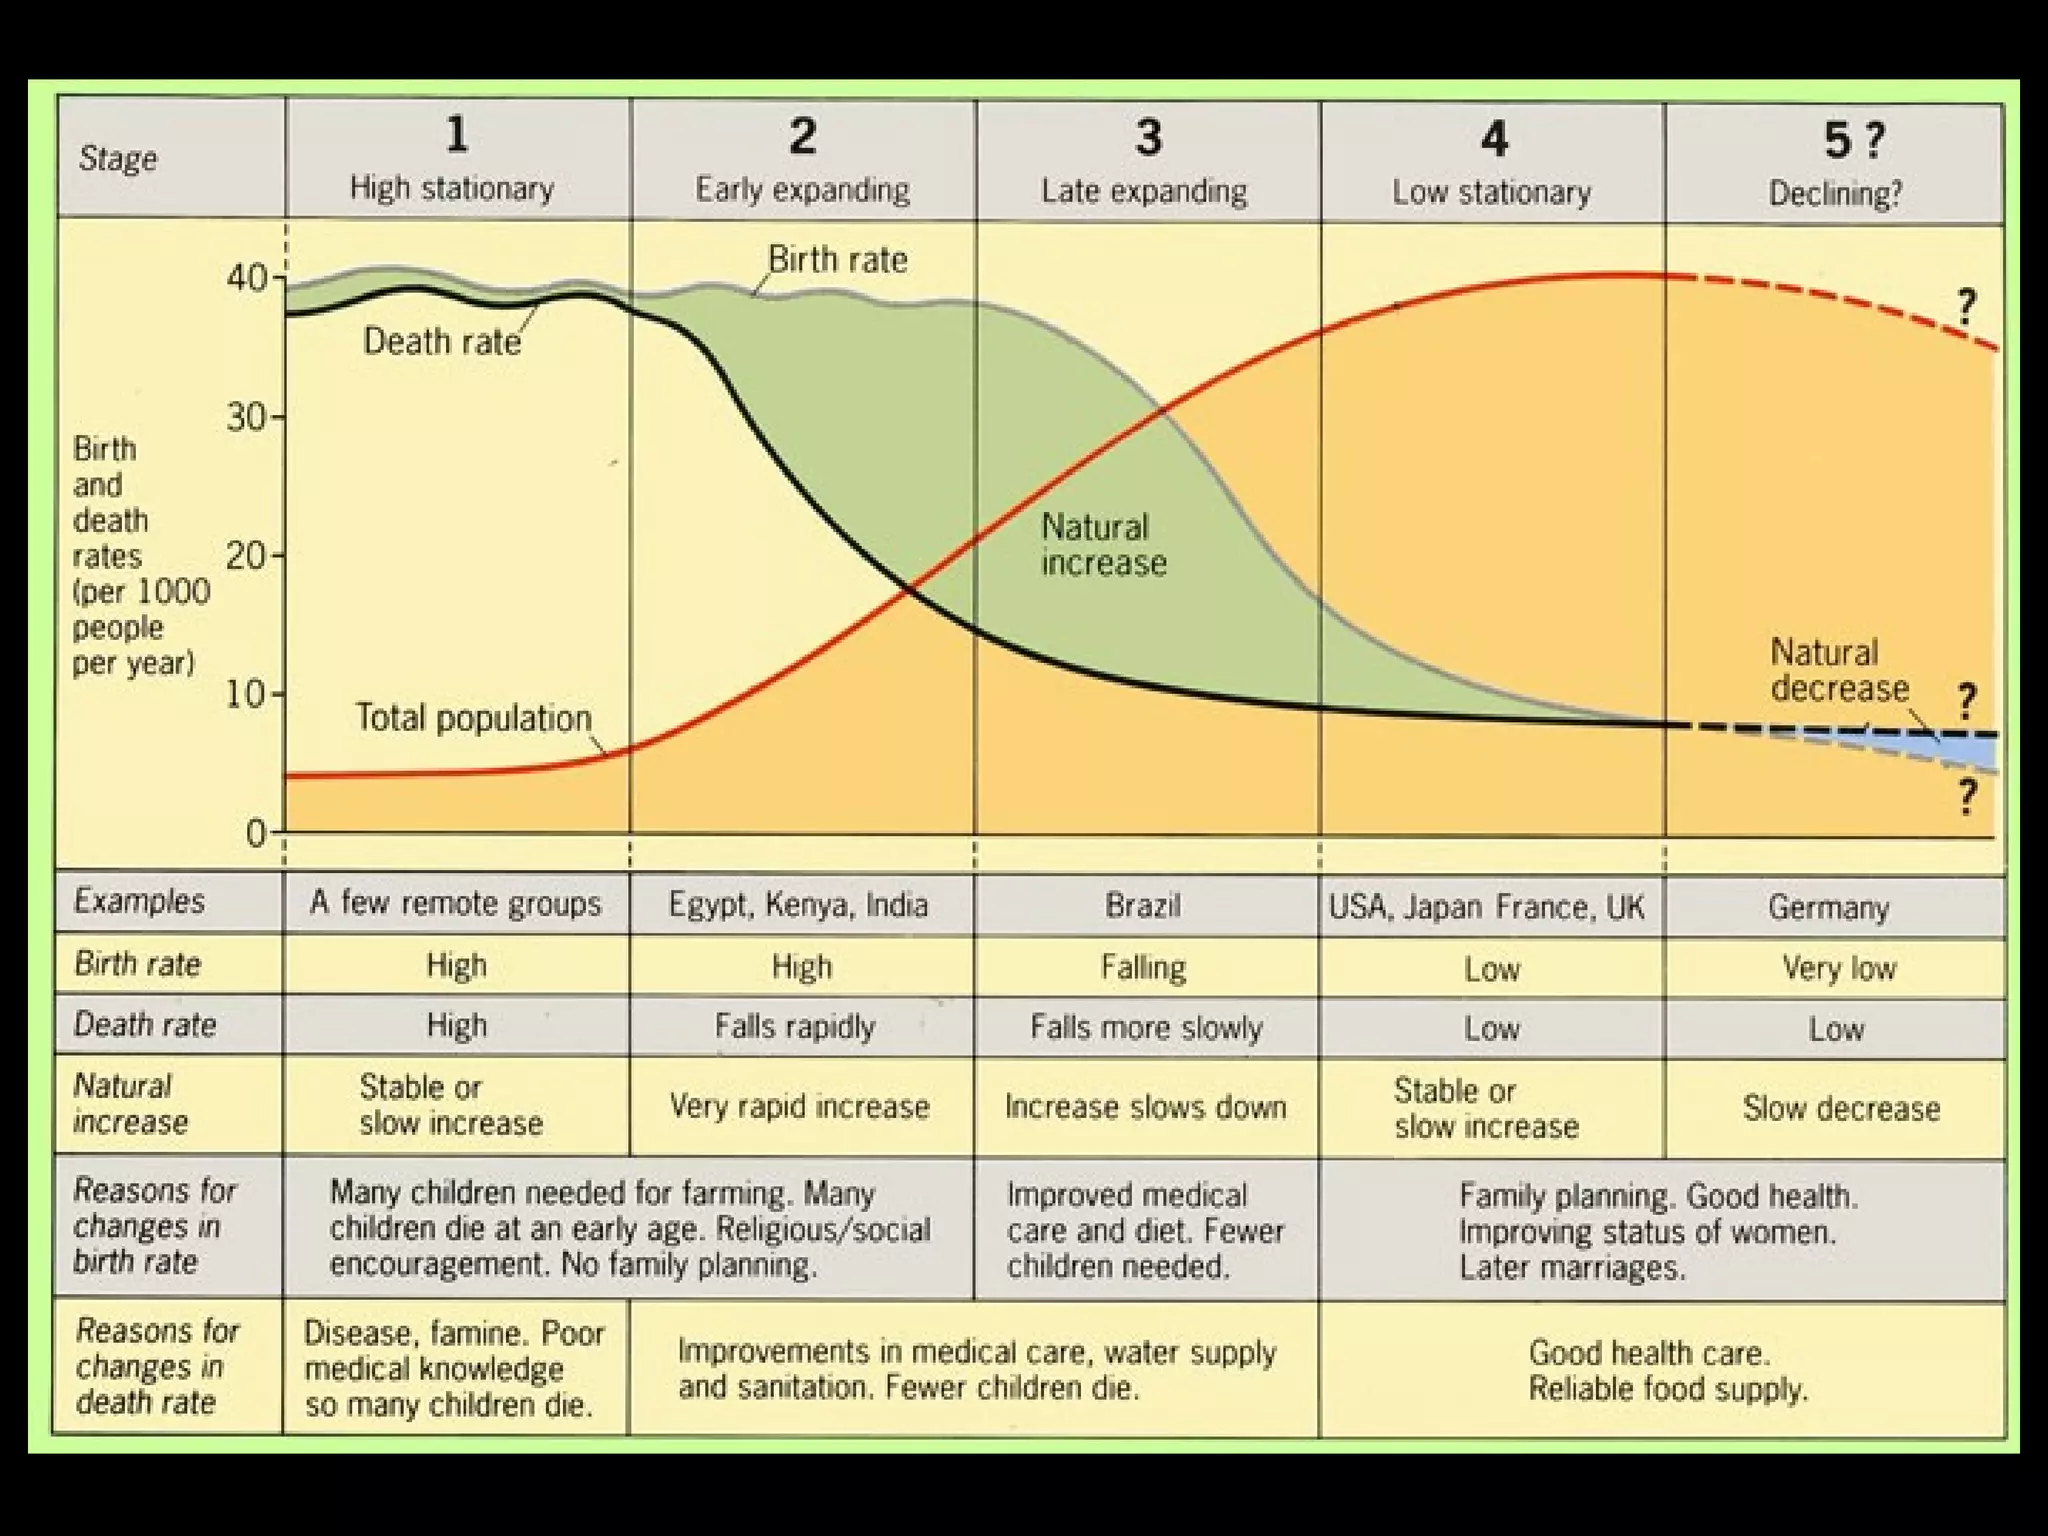
SlideShare a Scribd company logo
1 of 40
AP Human Geography
Key Issue 2-3
Why Is Population Increasing at
Different Rates in Different
Countries?
Variations in Population Growth
• The Demographic Transition
– 1. Low growth – 3. Moderate growth
– 2. High growth – 4. Low growth
• Population pyramids
– Age distribution
– Sex ratio
• Countries in different stages of demographic
transition
• Demographic transition and world population
growth
What is the Demographic Transition?
• The shift from highhigh to low mortality and
fertility through four distinct stages.
• Based on the experience of Western Europe’s
Industrial Age.
• Began by Warren Thompson in 1929.
• Further developed in 1945 by Frank Notestein
• A sign of socio-economic progress?
The Demographic Transition
In Depth New Model
Stage 1 - High Fluctuating
 Birth Rate and Death rate are both high. Population growth is slow and
fluctuating.
 Reasons
 Birth Rate is high as a result of:
 Lack of family planning
 High Infant Mortality Rate: putting babies in the 'bank'
 Need for workers in agriculture
 Religious beliefs
 Children as economic assets
 Death Rate is high because of:
 High levels of disease
 Famine
 Lack of clean water and sanitation
 Lack of health care
 War
 Competition for food from predators such as rats
 Lack of education
 Typical of Britain in the 18th century and the Least Economically Developed
Countries (LEDC's) today.
In Depth New Model
Stage 2 - Early Expanding
Birth Rate remains high. Death Rate is falling.
Population begins to rise steadily.
Reasons
 Death Rate is falling as a result of:
 Improved health care (e.g. Smallpox Vaccine)
 Improved Hygiene (Water for drinking boiled)
 Improved sanitation
 Improved food production and storage
 Improved transport for food
 Decreased Infant Mortality Rates
Typical of Britain in 19th century; Bangladesh; Nigeria
In Depth New Model
Stage 3 - Late Expanding
Birth Rate starts to fall. Death Rate continues to
fall. Population rising.
Reasons:
 Family planning available
 Lower Infant Mortality Rate
 Increased mechanization reduces need for workers
 Increased standard of living
 Changing status of women
 Typical of Britain in late 19th and early 20th century;
China; Brazil.
In Depth New Model
Stage 4 - Low Fluctuating
• Birth Rate and Death Rate both low. Population
steady.
– Economy is settled
– Fully developed Middle Class
– Political stability
• Typical of USA; Sweden; Japan; Britain
In Depth New Model
Stage 5? – Declining Population
• Theoretical
• Death Rate exceeds Birth Rate.
• Negative NIR
• Mostly Eastern European Countries
– Russia
– Belarus
– Germany
– Italy
– Japan
• Many developed countries are predicted to experience
population decline.
– Factor of more elderly than young population in these countries
– Fewer young women who will be entering their childbearing years
– Elderly Support Ratio - The number of working-age people (ages
15–64) divided by the number of persons 65 or older
© 2013 Pearson Education, Inc.
ELDERLY SUPPORT RATIO
Is the Demographic Transition Model Still
Useful?
• How well does the classic model work?
• Is it a useful framework for developing
countries?
• Do developing countries need to share the
experiences of Europe and the United States?
• Is the socioeconomic change experienced by
industrialized countries a prerequisite or a
consequence of demographic transition?
Is the model universally applicable?
• Like all models, the demographic transition model
has its limitations. It failed to consider, or to
predict, several factors and events:
– 1 Birth rates in several MDCs have fallen below death
rates (Germany, Sweden). This has caused, for the first
time, a population decline which suggests that perhaps
the model should have a fifth stage added to it.
– 2 The model assumes that in time all countries pass
through the same four stages. It now seems unlikely,
however, that many LDCs, especially in Africa, will ever
become industrialized.
– 3 The model assumes that the fall in the death rate in
Stage 2 was the consequence of industrialization. In
many countries, the fall in the birth rate in Stage 3 has
been less rapid than the model suggests due to religious
and/or political opposition to birth control (Brazil),
whereas the fall was much more rapid, and came earlier,
in China following the government-introduced ‘one
child’ policy. The timescale of the model, especially in
several South-east Asian countries such as Hong Kong
and Malaysia, is being squashed as they develop at a
much faster rate than did the early industrialized
countries.
– 4 Countries that grew as a consequence of emigration
from Europe (USA, Canada, Australia) did not pass
through the early stages of the model.
Population Pyramid
Population Pyramids = graphic device
that represents a population’s age and
sex composition.
Pyramid describes diagram’s shape
for many countries in 1800’s when
was created.
• The most important demographic characteristic of a
population is its age-sex structure. Age-sex
pyramids (also known as population pyramids)
graphically display this information to improve
understanding and ease comparison.
• Age-sex pyramids display the percentage or actual
amount of a population broken down by gender and
age. The five-year age increments on the y-axis
allow the pyramid to vividly reflect long term trends
in the birth and death rates but also reflect shorter
term baby-booms, wars, and epidemics.
Population Pyramid Overview
Population Pyramids
• The shape of a pyramid is primarily determined by the
crude death rate in the community.
• Dependency ratio-the number of people who are too
young or too old to work, compared to the number of
people in their productive years.
• People who are 0-14 and 65-plus normally are classified
as dependents.
• The “graying” of a population refers to the aging of a
community.
• Population pyramids also foretell future problems from
present population policies or practices. Ex. China’s
population policies skewed in favor of males.
• Number of people who are too young or too old
to work, compared to the number of people in
their productive years
• Indicates financial burden on a society’s
productive population
• Dependency Ratio = measure of # of dependents –
old and young that each 100 people in productive
years (15 – 64)
© 2013 Pearson Education, Inc.
Dependency ratio
Sex Ratio
• The number of males per hundred females in
the population is the sex ratio. In Europe and
North America the ratio of men to women is
about 95:100
• In poorer countries the high mortality rate
during childbirth partly explains the lower
percentage of women.
There are three key types
of population pyramids:
Rapid Growth:
This pyramid of
the Philippines
shows a triangle-
shaped pyramid
and reflects a
high growth rate
of about 2.1
percent annually.
There are three key types
of population pyramids:
Slow Growth:
In the United States,
the population is
growing at a rate of
about 1.7 percent
annually. This growth
rate is reflected in the
more square-like
structure of the
pyramid. Note the
lump in the pyramid
between the ages of
about 35 to 50.
In wealthy countries with very slow rate of
population growth – population is nearly equally
divided - so pyramids have
• Almost vertical sides.
• War can be reflected by showing depleted age
cohorts and male – female disparities.
• The % of a country’s population in each age group
strongly influences demand for goods and services
within that national economy.
• Country with high % of young has high demand for
educational facilities and health delivery services.
There are three key
types of population
pyramids:
Negative Growth:
Germany is
experiencing a period of
negative growth (-
0.1%). As negative
growth in a country
continues, the
population is reduced.
A population can shrink
due to a low birth rate
and a stable death rate.
Increased emigration
may also be a
contributor to a
declining population.
Population Pyramids in U.S. cities
Countries In Different Stages of
Demographic Transition
Rapid Growth in Cape Verde
Fig. 2-17: Cape Verde, which entered stage 2 of the demographic transition in about
1950, is experiencing rapid population growth. Its population history
reflects the impacts of famines and out-migration.
Moderate Growth in Chile
Fig. 2-18: Chile entered stage 2 of the demographic transition in the
1930s, and it entered stage 3 in the 1960s.
Low Growth in Denmark
Fig. 2-19: Denmark has been in stage 4 of the demographic transition
since the 1970s, with little population growth since then. Its
population pyramid shows increasing numbers of elderly and
few children.
2.5 The Demographic Transition
© 2013 Pearson Education, Inc.
POPULATION PYRAMID AND DEMOGRAPHIC TRANSITION
FOR CAPE VERDE (LEFT), CHILE (CENTER), DENMARK (RIGHT)
Census taking in China
Demographic Transition and World
Population Growth
• How many countries are in each of the
following stages of the demographic
transition?
– Stage 1- None
– Stage 2 and 3- majority of countries (i.e. Egypt,
Kenya, India)
– Stage 4- USA, Japan, France, UK
– Stage 5 – Germany?
Two “big breaks” & their causes
• The first break-the sudden drop in the death
rate that comes from technological
innovation
• The second break-sudden drop in the birth
rate that comes from changing social
customs
Demographic model

More Related Content

What's hot

Population change revision
Population change revisionPopulation change revision
Population change revisioncpugh5345
 
L2 ap factors affecting population growth
L2 ap factors affecting population growthL2 ap factors affecting population growth
L2 ap factors affecting population growthSHS Geog
 
Demography a global trend
Demography a global trendDemography a global trend
Demography a global trendOpen Knowledge
 
Causes and Consequences of Rapid Population Growth
Causes and Consequences of Rapid Population GrowthCauses and Consequences of Rapid Population Growth
Causes and Consequences of Rapid Population GrowthUnica Chiara
 
Igcse Population Change Review
Igcse Population Change ReviewIgcse Population Change Review
Igcse Population Change ReviewEcumene
 
AS GEOGRAPHY REVISION - MIGRATION - 5.1 MIGRATION AS POPULATION CHANGE
AS GEOGRAPHY REVISION - MIGRATION - 5.1 MIGRATION AS POPULATION CHANGEAS GEOGRAPHY REVISION - MIGRATION - 5.1 MIGRATION AS POPULATION CHANGE
AS GEOGRAPHY REVISION - MIGRATION - 5.1 MIGRATION AS POPULATION CHANGEGeorge Dumitrache
 
GEOGRAPHY IGCSE: POPULATION STRUCTURE
GEOGRAPHY IGCSE: POPULATION STRUCTUREGEOGRAPHY IGCSE: POPULATION STRUCTURE
GEOGRAPHY IGCSE: POPULATION STRUCTUREGeorge Dumitrache
 
Unit 2 - The population of the world
Unit 2 - The population of the worldUnit 2 - The population of the world
Unit 2 - The population of the worldJosep Villarroya
 
Global inequalities
Global inequalitiesGlobal inequalities
Global inequalitiesXaveria Desi
 
Falling fertility
Falling fertility Falling fertility
Falling fertility Smawi GH
 
Honors geo. ch 6 p.p.
Honors geo. ch 6 p.p.Honors geo. ch 6 p.p.
Honors geo. ch 6 p.p.tobin15
 
Population Structure
Population StructurePopulation Structure
Population StructureSHS Geog
 
Implications of population change
Implications of population changeImplications of population change
Implications of population changePLANETGE0GRAPHY
 
analysis of population growth
analysis of population growthanalysis of population growth
analysis of population growthasifmandal
 
Population 2020 - Demographics can be a potent driver of the pace and process...
Population 2020 - Demographics can be a potent driver of the pace and process...Population 2020 - Demographics can be a potent driver of the pace and process...
Population 2020 - Demographics can be a potent driver of the pace and process...DESMOND YUEN
 

What's hot (20)

Population change revision
Population change revisionPopulation change revision
Population change revision
 
L2 ap factors affecting population growth
L2 ap factors affecting population growthL2 ap factors affecting population growth
L2 ap factors affecting population growth
 
Demography a global trend
Demography a global trendDemography a global trend
Demography a global trend
 
Population Growth
Population GrowthPopulation Growth
Population Growth
 
Dtm notes
Dtm notesDtm notes
Dtm notes
 
Causes and Consequences of Rapid Population Growth
Causes and Consequences of Rapid Population GrowthCauses and Consequences of Rapid Population Growth
Causes and Consequences of Rapid Population Growth
 
Igcse Population Change Review
Igcse Population Change ReviewIgcse Population Change Review
Igcse Population Change Review
 
AS GEOGRAPHY REVISION - MIGRATION - 5.1 MIGRATION AS POPULATION CHANGE
AS GEOGRAPHY REVISION - MIGRATION - 5.1 MIGRATION AS POPULATION CHANGEAS GEOGRAPHY REVISION - MIGRATION - 5.1 MIGRATION AS POPULATION CHANGE
AS GEOGRAPHY REVISION - MIGRATION - 5.1 MIGRATION AS POPULATION CHANGE
 
GEOGRAPHY IGCSE: POPULATION STRUCTURE
GEOGRAPHY IGCSE: POPULATION STRUCTUREGEOGRAPHY IGCSE: POPULATION STRUCTURE
GEOGRAPHY IGCSE: POPULATION STRUCTURE
 
Demographic Transition
Demographic TransitionDemographic Transition
Demographic Transition
 
Unit 2 - The population of the world
Unit 2 - The population of the worldUnit 2 - The population of the world
Unit 2 - The population of the world
 
Demography and the Market
Demography and the MarketDemography and the Market
Demography and the Market
 
Global inequalities
Global inequalitiesGlobal inequalities
Global inequalities
 
Falling fertility
Falling fertility Falling fertility
Falling fertility
 
Honors geo. ch 6 p.p.
Honors geo. ch 6 p.p.Honors geo. ch 6 p.p.
Honors geo. ch 6 p.p.
 
Population Structure
Population StructurePopulation Structure
Population Structure
 
Implications of population change
Implications of population changeImplications of population change
Implications of population change
 
Demography & global issues
Demography & global issuesDemography & global issues
Demography & global issues
 
analysis of population growth
analysis of population growthanalysis of population growth
analysis of population growth
 
Population 2020 - Demographics can be a potent driver of the pace and process...
Population 2020 - Demographics can be a potent driver of the pace and process...Population 2020 - Demographics can be a potent driver of the pace and process...
Population 2020 - Demographics can be a potent driver of the pace and process...
 

Similar to Demographic model

SQA higher geography population
SQA higher geography populationSQA higher geography population
SQA higher geography populationultraviola
 
Demographic Transitioning Modelling Gr 8
Demographic Transitioning Modelling Gr 8Demographic Transitioning Modelling Gr 8
Demographic Transitioning Modelling Gr 8Sherazashrafkhan1
 
My Own Demography 4 Demographic transition.pptx
My Own Demography 4 Demographic transition.pptxMy Own Demography 4 Demographic transition.pptx
My Own Demography 4 Demographic transition.pptxMUHAMMAD UMAIR
 
6194033.pptjjjjjjjjjjjjjjjjjjjjjjjjjjjjjjjjjjjjjjjj
6194033.pptjjjjjjjjjjjjjjjjjjjjjjjjjjjjjjjjjjjjjjjj6194033.pptjjjjjjjjjjjjjjjjjjjjjjjjjjjjjjjjjjjjjjjj
6194033.pptjjjjjjjjjjjjjjjjjjjjjjjjjjjjjjjjjjjjjjjjmhosn627
 
7571568.pptffffffffffffffffffffffffffffffffffffffffffff
7571568.pptffffffffffffffffffffffffffffffffffffffffffff7571568.pptffffffffffffffffffffffffffffffffffffffffffff
7571568.pptffffffffffffffffffffffffffffffffffffffffffffmhosn627
 
Pyramids and demographic transition
Pyramids and demographic transitionPyramids and demographic transition
Pyramids and demographic transitiongregorygolz
 
Com 201 - Intro to Demography and biostatistics
Com 201 - Intro to Demography and biostatisticsCom 201 - Intro to Demography and biostatistics
Com 201 - Intro to Demography and biostatisticspetshelter54
 
Population growth, demographic transition model and overpopulated places
Population growth, demographic transition model and overpopulated placesPopulation growth, demographic transition model and overpopulated places
Population growth, demographic transition model and overpopulated placesdavidgeo3eso
 
DEMOGRAPHY in community health nursing, study about the population
DEMOGRAPHY in community health nursing, study about the populationDEMOGRAPHY in community health nursing, study about the population
DEMOGRAPHY in community health nursing, study about the populationpurvipatel517209
 
Aqa population-revision
Aqa population-revisionAqa population-revision
Aqa population-revisioncpugh5345
 
Aqa population-revision
Aqa population-revisionAqa population-revision
Aqa population-revisioncpugh5345
 
Honors geo. ch 5 p.p.
Honors geo. ch 5 p.p.Honors geo. ch 5 p.p.
Honors geo. ch 5 p.p.tobin15
 
Population Pyramids
Population PyramidsPopulation Pyramids
Population PyramidsMooreGeo
 
Explaining variations in global demographic indicators
Explaining variations in global demographic indicatorsExplaining variations in global demographic indicators
Explaining variations in global demographic indicatorsjacksonthree
 

Similar to Demographic model (20)

SQA higher geography population
SQA higher geography populationSQA higher geography population
SQA higher geography population
 
Demographic Transitioning Modelling Gr 8
Demographic Transitioning Modelling Gr 8Demographic Transitioning Modelling Gr 8
Demographic Transitioning Modelling Gr 8
 
Dtm
DtmDtm
Dtm
 
DTM (1).pptx
DTM (1).pptxDTM (1).pptx
DTM (1).pptx
 
DTM.pptx
DTM.pptxDTM.pptx
DTM.pptx
 
My Own Demography 4 Demographic transition.pptx
My Own Demography 4 Demographic transition.pptxMy Own Demography 4 Demographic transition.pptx
My Own Demography 4 Demographic transition.pptx
 
Population Structure
Population StructurePopulation Structure
Population Structure
 
6194033.pptjjjjjjjjjjjjjjjjjjjjjjjjjjjjjjjjjjjjjjjj
6194033.pptjjjjjjjjjjjjjjjjjjjjjjjjjjjjjjjjjjjjjjjj6194033.pptjjjjjjjjjjjjjjjjjjjjjjjjjjjjjjjjjjjjjjjj
6194033.pptjjjjjjjjjjjjjjjjjjjjjjjjjjjjjjjjjjjjjjjj
 
7571568.pptffffffffffffffffffffffffffffffffffffffffffff
7571568.pptffffffffffffffffffffffffffffffffffffffffffff7571568.pptffffffffffffffffffffffffffffffffffffffffffff
7571568.pptffffffffffffffffffffffffffffffffffffffffffff
 
Pyramids and demographic transition
Pyramids and demographic transitionPyramids and demographic transition
Pyramids and demographic transition
 
Demography
DemographyDemography
Demography
 
Com 201 - Intro to Demography and biostatistics
Com 201 - Intro to Demography and biostatisticsCom 201 - Intro to Demography and biostatistics
Com 201 - Intro to Demography and biostatistics
 
Population growth, demographic transition model and overpopulated places
Population growth, demographic transition model and overpopulated placesPopulation growth, demographic transition model and overpopulated places
Population growth, demographic transition model and overpopulated places
 
DEMOGRAPHY in community health nursing, study about the population
DEMOGRAPHY in community health nursing, study about the populationDEMOGRAPHY in community health nursing, study about the population
DEMOGRAPHY in community health nursing, study about the population
 
Aqa population-revision
Aqa population-revisionAqa population-revision
Aqa population-revision
 
Aqa population-revision
Aqa population-revisionAqa population-revision
Aqa population-revision
 
Honors geo. ch 5 p.p.
Honors geo. ch 5 p.p.Honors geo. ch 5 p.p.
Honors geo. ch 5 p.p.
 
Population Pyramids
Population PyramidsPopulation Pyramids
Population Pyramids
 
Population Structures
Population StructuresPopulation Structures
Population Structures
 
Explaining variations in global demographic indicators
Explaining variations in global demographic indicatorsExplaining variations in global demographic indicators
Explaining variations in global demographic indicators
 

Recently uploaded

OSCamp Kubernetes 2024 | A Tester's Guide to CI_CD as an Automated Quality Co...
OSCamp Kubernetes 2024 | A Tester's Guide to CI_CD as an Automated Quality Co...OSCamp Kubernetes 2024 | A Tester's Guide to CI_CD as an Automated Quality Co...
OSCamp Kubernetes 2024 | A Tester's Guide to CI_CD as an Automated Quality Co...NETWAYS
 
call girls in delhi malviya nagar @9811711561@
call girls in delhi malviya nagar @9811711561@call girls in delhi malviya nagar @9811711561@
call girls in delhi malviya nagar @9811711561@vikas rana
 
Work Remotely with Confluence ACE 2.pptx
Work Remotely with Confluence ACE 2.pptxWork Remotely with Confluence ACE 2.pptx
Work Remotely with Confluence ACE 2.pptxmavinoikein
 
NATIONAL ANTHEMS OF AFRICA (National Anthems of Africa)
NATIONAL ANTHEMS OF AFRICA (National Anthems of Africa)NATIONAL ANTHEMS OF AFRICA (National Anthems of Africa)
NATIONAL ANTHEMS OF AFRICA (National Anthems of Africa)Basil Achie
 
Exploring protein-protein interactions by Weak Affinity Chromatography (WAC) ...
Exploring protein-protein interactions by Weak Affinity Chromatography (WAC) ...Exploring protein-protein interactions by Weak Affinity Chromatography (WAC) ...
Exploring protein-protein interactions by Weak Affinity Chromatography (WAC) ...Salam Al-Karadaghi
 
SBFT Tool Competition 2024 -- Python Test Case Generation Track
SBFT Tool Competition 2024 -- Python Test Case Generation TrackSBFT Tool Competition 2024 -- Python Test Case Generation Track
SBFT Tool Competition 2024 -- Python Test Case Generation TrackSebastiano Panichella
 
Mathan flower ppt.pptx slide orchids ✨🌸
Mathan flower ppt.pptx slide orchids ✨🌸Mathan flower ppt.pptx slide orchids ✨🌸
Mathan flower ppt.pptx slide orchids ✨🌸mathanramanathan2005
 
The 3rd Intl. Workshop on NL-based Software Engineering
The 3rd Intl. Workshop on NL-based Software EngineeringThe 3rd Intl. Workshop on NL-based Software Engineering
The 3rd Intl. Workshop on NL-based Software EngineeringSebastiano Panichella
 
Simulation-based Testing of Unmanned Aerial Vehicles with Aerialist
Simulation-based Testing of Unmanned Aerial Vehicles with AerialistSimulation-based Testing of Unmanned Aerial Vehicles with Aerialist
Simulation-based Testing of Unmanned Aerial Vehicles with AerialistSebastiano Panichella
 
Open Source Camp Kubernetes 2024 | Monitoring Kubernetes With Icinga by Eric ...
Open Source Camp Kubernetes 2024 | Monitoring Kubernetes With Icinga by Eric ...Open Source Camp Kubernetes 2024 | Monitoring Kubernetes With Icinga by Eric ...
Open Source Camp Kubernetes 2024 | Monitoring Kubernetes With Icinga by Eric ...NETWAYS
 
PHYSICS PROJECT BY MSC - NANOTECHNOLOGY
PHYSICS PROJECT BY MSC  - NANOTECHNOLOGYPHYSICS PROJECT BY MSC  - NANOTECHNOLOGY
PHYSICS PROJECT BY MSC - NANOTECHNOLOGYpruthirajnayak525
 
Call Girls in Rohini Delhi 💯Call Us 🔝8264348440🔝
Call Girls in Rohini Delhi 💯Call Us 🔝8264348440🔝Call Girls in Rohini Delhi 💯Call Us 🔝8264348440🔝
Call Girls in Rohini Delhi 💯Call Us 🔝8264348440🔝soniya singh
 
Genshin Impact PPT Template by EaTemp.pptx
Genshin Impact PPT Template by EaTemp.pptxGenshin Impact PPT Template by EaTemp.pptx
Genshin Impact PPT Template by EaTemp.pptxJohnree4
 
James Joyce, Dubliners and Ulysses.ppt !
James Joyce, Dubliners and Ulysses.ppt !James Joyce, Dubliners and Ulysses.ppt !
James Joyce, Dubliners and Ulysses.ppt !risocarla2016
 
The Ten Facts About People With Autism Presentation
The Ten Facts About People With Autism PresentationThe Ten Facts About People With Autism Presentation
The Ten Facts About People With Autism PresentationNathan Young
 
Philippine History cavite Mutiny Report.ppt
Philippine History cavite Mutiny Report.pptPhilippine History cavite Mutiny Report.ppt
Philippine History cavite Mutiny Report.pptssuser319dad
 
OSCamp Kubernetes 2024 | SRE Challenges in Monolith to Microservices Shift at...
OSCamp Kubernetes 2024 | SRE Challenges in Monolith to Microservices Shift at...OSCamp Kubernetes 2024 | SRE Challenges in Monolith to Microservices Shift at...
OSCamp Kubernetes 2024 | SRE Challenges in Monolith to Microservices Shift at...NETWAYS
 
Dutch Power - 26 maart 2024 - Henk Kras - Circular Plastics
Dutch Power - 26 maart 2024 - Henk Kras - Circular PlasticsDutch Power - 26 maart 2024 - Henk Kras - Circular Plastics
Dutch Power - 26 maart 2024 - Henk Kras - Circular PlasticsDutch Power
 
Presentation for the Strategic Dialogue on the Future of Agriculture, Brussel...
Presentation for the Strategic Dialogue on the Future of Agriculture, Brussel...Presentation for the Strategic Dialogue on the Future of Agriculture, Brussel...
Presentation for the Strategic Dialogue on the Future of Agriculture, Brussel...Krijn Poppe
 
Anne Frank A Beacon of Hope amidst darkness ppt.pptx
Anne Frank A Beacon of Hope amidst darkness ppt.pptxAnne Frank A Beacon of Hope amidst darkness ppt.pptx
Anne Frank A Beacon of Hope amidst darkness ppt.pptxnoorehahmad
 

Recently uploaded (20)

OSCamp Kubernetes 2024 | A Tester's Guide to CI_CD as an Automated Quality Co...
OSCamp Kubernetes 2024 | A Tester's Guide to CI_CD as an Automated Quality Co...OSCamp Kubernetes 2024 | A Tester's Guide to CI_CD as an Automated Quality Co...
OSCamp Kubernetes 2024 | A Tester's Guide to CI_CD as an Automated Quality Co...
 
call girls in delhi malviya nagar @9811711561@
call girls in delhi malviya nagar @9811711561@call girls in delhi malviya nagar @9811711561@
call girls in delhi malviya nagar @9811711561@
 
Work Remotely with Confluence ACE 2.pptx
Work Remotely with Confluence ACE 2.pptxWork Remotely with Confluence ACE 2.pptx
Work Remotely with Confluence ACE 2.pptx
 
NATIONAL ANTHEMS OF AFRICA (National Anthems of Africa)
NATIONAL ANTHEMS OF AFRICA (National Anthems of Africa)NATIONAL ANTHEMS OF AFRICA (National Anthems of Africa)
NATIONAL ANTHEMS OF AFRICA (National Anthems of Africa)
 
Exploring protein-protein interactions by Weak Affinity Chromatography (WAC) ...
Exploring protein-protein interactions by Weak Affinity Chromatography (WAC) ...Exploring protein-protein interactions by Weak Affinity Chromatography (WAC) ...
Exploring protein-protein interactions by Weak Affinity Chromatography (WAC) ...
 
SBFT Tool Competition 2024 -- Python Test Case Generation Track
SBFT Tool Competition 2024 -- Python Test Case Generation TrackSBFT Tool Competition 2024 -- Python Test Case Generation Track
SBFT Tool Competition 2024 -- Python Test Case Generation Track
 
Mathan flower ppt.pptx slide orchids ✨🌸
Mathan flower ppt.pptx slide orchids ✨🌸Mathan flower ppt.pptx slide orchids ✨🌸
Mathan flower ppt.pptx slide orchids ✨🌸
 
The 3rd Intl. Workshop on NL-based Software Engineering
The 3rd Intl. Workshop on NL-based Software EngineeringThe 3rd Intl. Workshop on NL-based Software Engineering
The 3rd Intl. Workshop on NL-based Software Engineering
 
Simulation-based Testing of Unmanned Aerial Vehicles with Aerialist
Simulation-based Testing of Unmanned Aerial Vehicles with AerialistSimulation-based Testing of Unmanned Aerial Vehicles with Aerialist
Simulation-based Testing of Unmanned Aerial Vehicles with Aerialist
 
Open Source Camp Kubernetes 2024 | Monitoring Kubernetes With Icinga by Eric ...
Open Source Camp Kubernetes 2024 | Monitoring Kubernetes With Icinga by Eric ...Open Source Camp Kubernetes 2024 | Monitoring Kubernetes With Icinga by Eric ...
Open Source Camp Kubernetes 2024 | Monitoring Kubernetes With Icinga by Eric ...
 
PHYSICS PROJECT BY MSC - NANOTECHNOLOGY
PHYSICS PROJECT BY MSC  - NANOTECHNOLOGYPHYSICS PROJECT BY MSC  - NANOTECHNOLOGY
PHYSICS PROJECT BY MSC - NANOTECHNOLOGY
 
Call Girls in Rohini Delhi 💯Call Us 🔝8264348440🔝
Call Girls in Rohini Delhi 💯Call Us 🔝8264348440🔝Call Girls in Rohini Delhi 💯Call Us 🔝8264348440🔝
Call Girls in Rohini Delhi 💯Call Us 🔝8264348440🔝
 
Genshin Impact PPT Template by EaTemp.pptx
Genshin Impact PPT Template by EaTemp.pptxGenshin Impact PPT Template by EaTemp.pptx
Genshin Impact PPT Template by EaTemp.pptx
 
James Joyce, Dubliners and Ulysses.ppt !
James Joyce, Dubliners and Ulysses.ppt !James Joyce, Dubliners and Ulysses.ppt !
James Joyce, Dubliners and Ulysses.ppt !
 
The Ten Facts About People With Autism Presentation
The Ten Facts About People With Autism PresentationThe Ten Facts About People With Autism Presentation
The Ten Facts About People With Autism Presentation
 
Philippine History cavite Mutiny Report.ppt
Philippine History cavite Mutiny Report.pptPhilippine History cavite Mutiny Report.ppt
Philippine History cavite Mutiny Report.ppt
 
OSCamp Kubernetes 2024 | SRE Challenges in Monolith to Microservices Shift at...
OSCamp Kubernetes 2024 | SRE Challenges in Monolith to Microservices Shift at...OSCamp Kubernetes 2024 | SRE Challenges in Monolith to Microservices Shift at...
OSCamp Kubernetes 2024 | SRE Challenges in Monolith to Microservices Shift at...
 
Dutch Power - 26 maart 2024 - Henk Kras - Circular Plastics
Dutch Power - 26 maart 2024 - Henk Kras - Circular PlasticsDutch Power - 26 maart 2024 - Henk Kras - Circular Plastics
Dutch Power - 26 maart 2024 - Henk Kras - Circular Plastics
 
Presentation for the Strategic Dialogue on the Future of Agriculture, Brussel...
Presentation for the Strategic Dialogue on the Future of Agriculture, Brussel...Presentation for the Strategic Dialogue on the Future of Agriculture, Brussel...
Presentation for the Strategic Dialogue on the Future of Agriculture, Brussel...
 
Anne Frank A Beacon of Hope amidst darkness ppt.pptx
Anne Frank A Beacon of Hope amidst darkness ppt.pptxAnne Frank A Beacon of Hope amidst darkness ppt.pptx
Anne Frank A Beacon of Hope amidst darkness ppt.pptx
 

Demographic model

  • 1. AP Human Geography Key Issue 2-3 Why Is Population Increasing at Different Rates in Different Countries?
  • 2. Variations in Population Growth • The Demographic Transition – 1. Low growth – 3. Moderate growth – 2. High growth – 4. Low growth • Population pyramids – Age distribution – Sex ratio • Countries in different stages of demographic transition • Demographic transition and world population growth
  • 3. What is the Demographic Transition? • The shift from highhigh to low mortality and fertility through four distinct stages. • Based on the experience of Western Europe’s Industrial Age. • Began by Warren Thompson in 1929. • Further developed in 1945 by Frank Notestein • A sign of socio-economic progress?
  • 5. In Depth New Model
  • 6. Stage 1 - High Fluctuating  Birth Rate and Death rate are both high. Population growth is slow and fluctuating.  Reasons  Birth Rate is high as a result of:  Lack of family planning  High Infant Mortality Rate: putting babies in the 'bank'  Need for workers in agriculture  Religious beliefs  Children as economic assets  Death Rate is high because of:  High levels of disease  Famine  Lack of clean water and sanitation  Lack of health care  War  Competition for food from predators such as rats  Lack of education  Typical of Britain in the 18th century and the Least Economically Developed Countries (LEDC's) today.
  • 7. In Depth New Model
  • 8. Stage 2 - Early Expanding Birth Rate remains high. Death Rate is falling. Population begins to rise steadily. Reasons  Death Rate is falling as a result of:  Improved health care (e.g. Smallpox Vaccine)  Improved Hygiene (Water for drinking boiled)  Improved sanitation  Improved food production and storage  Improved transport for food  Decreased Infant Mortality Rates Typical of Britain in 19th century; Bangladesh; Nigeria
  • 9. In Depth New Model
  • 10. Stage 3 - Late Expanding Birth Rate starts to fall. Death Rate continues to fall. Population rising. Reasons:  Family planning available  Lower Infant Mortality Rate  Increased mechanization reduces need for workers  Increased standard of living  Changing status of women  Typical of Britain in late 19th and early 20th century; China; Brazil.
  • 11. In Depth New Model
  • 12. Stage 4 - Low Fluctuating • Birth Rate and Death Rate both low. Population steady. – Economy is settled – Fully developed Middle Class – Political stability • Typical of USA; Sweden; Japan; Britain
  • 13. In Depth New Model
  • 14. Stage 5? – Declining Population • Theoretical • Death Rate exceeds Birth Rate. • Negative NIR • Mostly Eastern European Countries – Russia – Belarus – Germany – Italy – Japan • Many developed countries are predicted to experience population decline. – Factor of more elderly than young population in these countries – Fewer young women who will be entering their childbearing years – Elderly Support Ratio - The number of working-age people (ages 15–64) divided by the number of persons 65 or older
  • 15. © 2013 Pearson Education, Inc. ELDERLY SUPPORT RATIO
  • 16.
  • 17.
  • 18. Is the Demographic Transition Model Still Useful? • How well does the classic model work? • Is it a useful framework for developing countries? • Do developing countries need to share the experiences of Europe and the United States? • Is the socioeconomic change experienced by industrialized countries a prerequisite or a consequence of demographic transition?
  • 19. Is the model universally applicable? • Like all models, the demographic transition model has its limitations. It failed to consider, or to predict, several factors and events: – 1 Birth rates in several MDCs have fallen below death rates (Germany, Sweden). This has caused, for the first time, a population decline which suggests that perhaps the model should have a fifth stage added to it. – 2 The model assumes that in time all countries pass through the same four stages. It now seems unlikely, however, that many LDCs, especially in Africa, will ever become industrialized.
  • 20. – 3 The model assumes that the fall in the death rate in Stage 2 was the consequence of industrialization. In many countries, the fall in the birth rate in Stage 3 has been less rapid than the model suggests due to religious and/or political opposition to birth control (Brazil), whereas the fall was much more rapid, and came earlier, in China following the government-introduced ‘one child’ policy. The timescale of the model, especially in several South-east Asian countries such as Hong Kong and Malaysia, is being squashed as they develop at a much faster rate than did the early industrialized countries. – 4 Countries that grew as a consequence of emigration from Europe (USA, Canada, Australia) did not pass through the early stages of the model.
  • 22. Population Pyramids = graphic device that represents a population’s age and sex composition. Pyramid describes diagram’s shape for many countries in 1800’s when was created.
  • 23. • The most important demographic characteristic of a population is its age-sex structure. Age-sex pyramids (also known as population pyramids) graphically display this information to improve understanding and ease comparison. • Age-sex pyramids display the percentage or actual amount of a population broken down by gender and age. The five-year age increments on the y-axis allow the pyramid to vividly reflect long term trends in the birth and death rates but also reflect shorter term baby-booms, wars, and epidemics. Population Pyramid Overview
  • 24. Population Pyramids • The shape of a pyramid is primarily determined by the crude death rate in the community. • Dependency ratio-the number of people who are too young or too old to work, compared to the number of people in their productive years. • People who are 0-14 and 65-plus normally are classified as dependents. • The “graying” of a population refers to the aging of a community. • Population pyramids also foretell future problems from present population policies or practices. Ex. China’s population policies skewed in favor of males.
  • 25. • Number of people who are too young or too old to work, compared to the number of people in their productive years • Indicates financial burden on a society’s productive population • Dependency Ratio = measure of # of dependents – old and young that each 100 people in productive years (15 – 64) © 2013 Pearson Education, Inc. Dependency ratio
  • 26. Sex Ratio • The number of males per hundred females in the population is the sex ratio. In Europe and North America the ratio of men to women is about 95:100 • In poorer countries the high mortality rate during childbirth partly explains the lower percentage of women.
  • 27. There are three key types of population pyramids: Rapid Growth: This pyramid of the Philippines shows a triangle- shaped pyramid and reflects a high growth rate of about 2.1 percent annually.
  • 28. There are three key types of population pyramids: Slow Growth: In the United States, the population is growing at a rate of about 1.7 percent annually. This growth rate is reflected in the more square-like structure of the pyramid. Note the lump in the pyramid between the ages of about 35 to 50.
  • 29. In wealthy countries with very slow rate of population growth – population is nearly equally divided - so pyramids have • Almost vertical sides. • War can be reflected by showing depleted age cohorts and male – female disparities. • The % of a country’s population in each age group strongly influences demand for goods and services within that national economy. • Country with high % of young has high demand for educational facilities and health delivery services.
  • 30. There are three key types of population pyramids: Negative Growth: Germany is experiencing a period of negative growth (- 0.1%). As negative growth in a country continues, the population is reduced. A population can shrink due to a low birth rate and a stable death rate. Increased emigration may also be a contributor to a declining population.
  • 31. Population Pyramids in U.S. cities
  • 32. Countries In Different Stages of Demographic Transition
  • 33. Rapid Growth in Cape Verde Fig. 2-17: Cape Verde, which entered stage 2 of the demographic transition in about 1950, is experiencing rapid population growth. Its population history reflects the impacts of famines and out-migration.
  • 34. Moderate Growth in Chile Fig. 2-18: Chile entered stage 2 of the demographic transition in the 1930s, and it entered stage 3 in the 1960s.
  • 35. Low Growth in Denmark Fig. 2-19: Denmark has been in stage 4 of the demographic transition since the 1970s, with little population growth since then. Its population pyramid shows increasing numbers of elderly and few children.
  • 36. 2.5 The Demographic Transition © 2013 Pearson Education, Inc. POPULATION PYRAMID AND DEMOGRAPHIC TRANSITION FOR CAPE VERDE (LEFT), CHILE (CENTER), DENMARK (RIGHT)
  • 38. Demographic Transition and World Population Growth • How many countries are in each of the following stages of the demographic transition? – Stage 1- None – Stage 2 and 3- majority of countries (i.e. Egypt, Kenya, India) – Stage 4- USA, Japan, France, UK – Stage 5 – Germany?
  • 39. Two “big breaks” & their causes • The first break-the sudden drop in the death rate that comes from technological innovation • The second break-sudden drop in the birth rate that comes from changing social customs

Editor's Notes

  1. The shift from high mortality and fertility to low mortality and fertility is known as the “demographic transition.” It is based on the experience of Western Europe, in particular England and Wales. This model was first described by the American demographer Warren Thompson in 1929. In 1945, Frank W. Notestein further developed this theory and suggested that there was a relationship between population change and industrialization. A debate continues questioning if population growth must decline for economic development or if economic progress (or industrialization) leads to slower population growth. In light of this debate, the completion of the demographic transition has come to be associated with socioeconomic progress. [FYI – The factors that drive childbearing trends—such as the economy, education, gender relations, and access to family planning—are numerous and complex. These same factors are signs of socioeconomic development.]
  2. Chapter 2, Figure 2.7.3
  3. Chapter 2, Figure 2.7.4
  4. [To prepare for this discussion, read pages 3-11 in the Population Reference Bureau’s Population Bulletin on “Transitions in World Population.” March 2004] How well does the classic model work? Is the Demographic Transition Model useful as a framework for evaluating demographic change in regions outside Europe and the U.S.? [A: There are significant and sometimes complex variances to the model, whether due to economic chaos (e.g. Russia), disease (South Africa), or continued population growth (Congo), yet the model is still useful as a guide and as a standard of comparison.] Is it necessary that all countries share the experiences of Europe and the United States in order to pass through a demographic transition? [A: Participants may raise questions related to women’s rights or cultural values (religion) as other important factors. All countries must not necessarily share the same experiences of Europe and the USA, but in some way economic opportunities must be available to all (men and women, as well as all, if not most ethnic/racial groups) for a country to complete the Demographic Transition.] Is the socioeconomic change experienced by industrialized countries a prerequisite or a consequence of demographic transition? Are there multiple ways to achieve a similar end? This is a question of ongoing debate.
  5. : Population pyramids can vary greatly with different fertility rates (Laredo vs. Honolulu), or among military bases (Unalaska), college towns (Lawrence), Fig. 2-16and retirement communities (Nples).