Downloaded 798 times
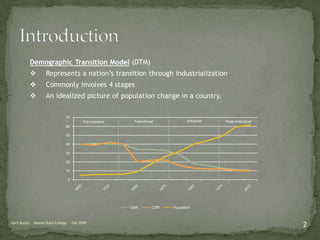
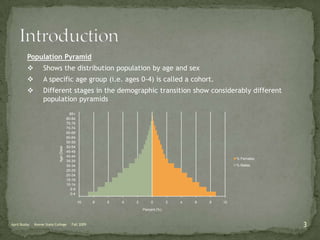
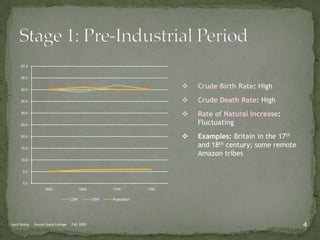
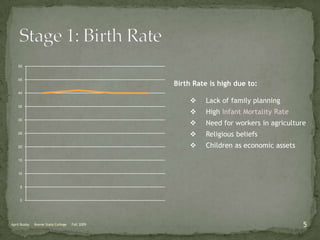
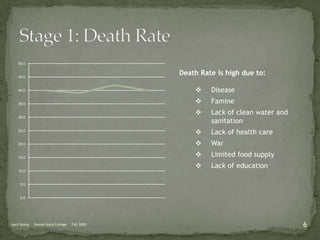
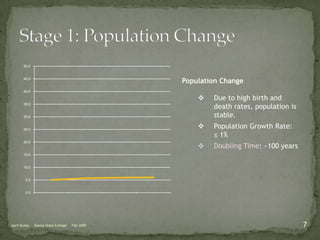
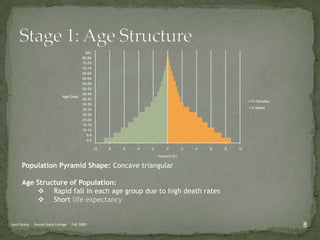
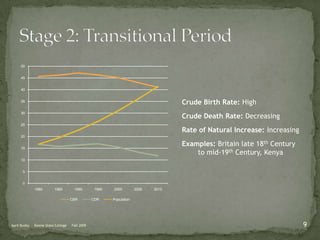
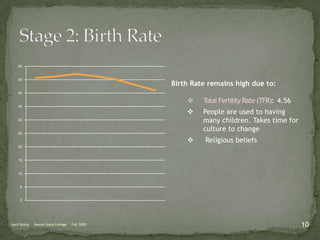
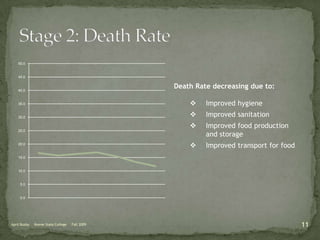
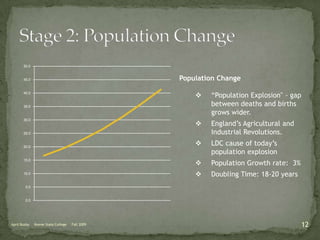
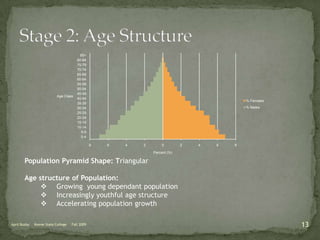
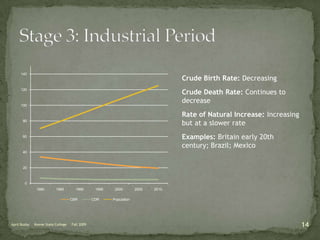
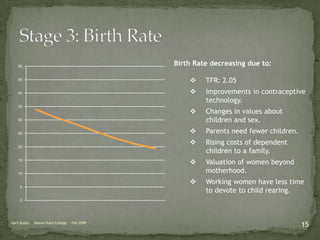
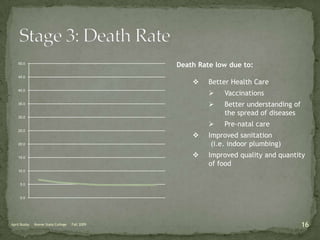
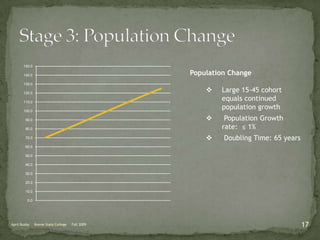
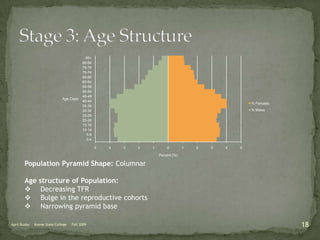
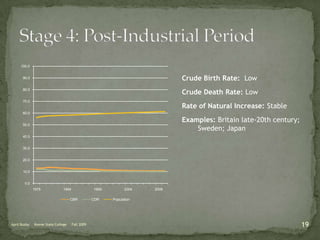
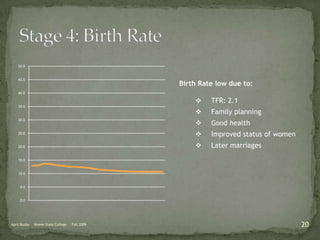
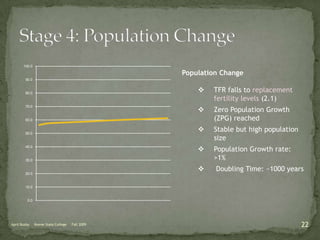
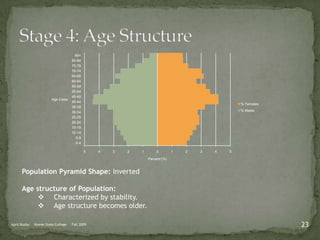
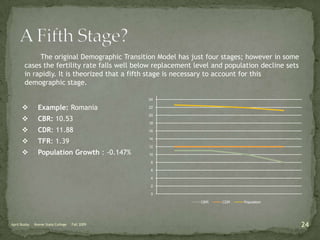
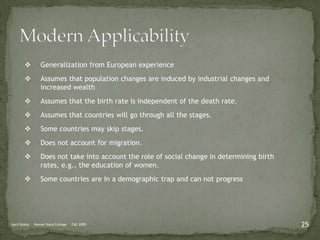
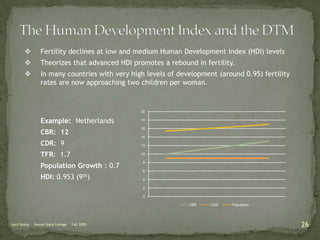
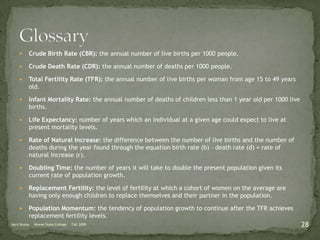

The document discusses the Demographic Transition Model (DTM), outlining its four stages of population change through industrialization: pre-industrial, transitional, industrial, and post-industrial periods. Each stage is characterized by distinct birth and death rates, population growth rates, and age structure, illustrated through population pyramids. Additionally, it suggests the potential for a fifth stage and highlights the impact of factors like human development index on fertility rates.


