Downloaded 295 times


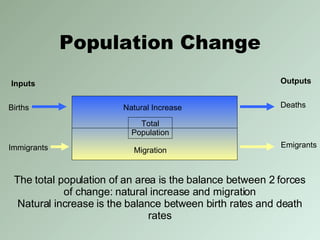
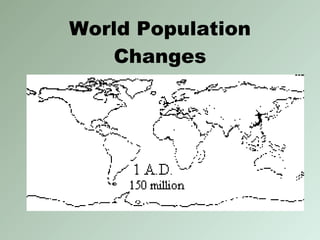
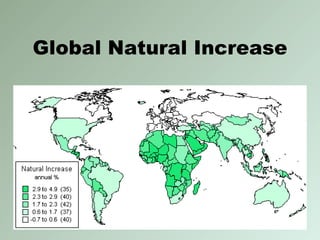
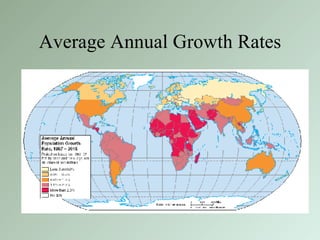
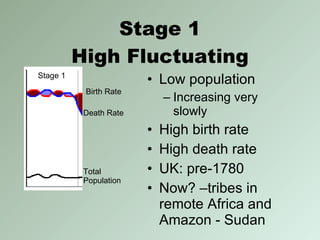
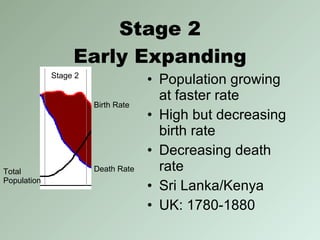
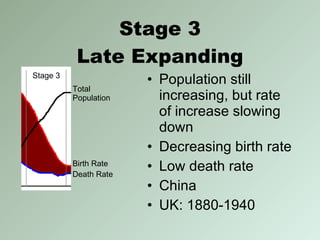
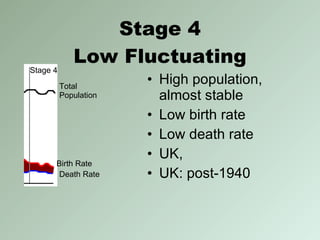
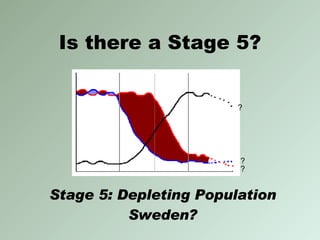
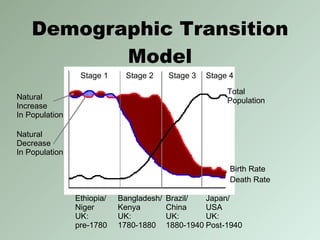
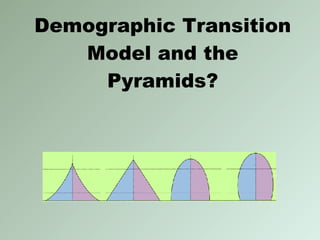

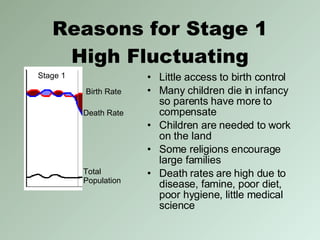
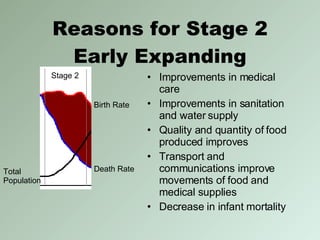
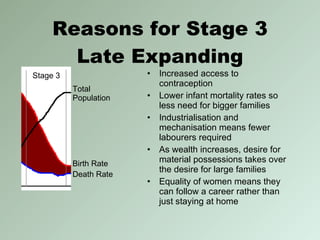
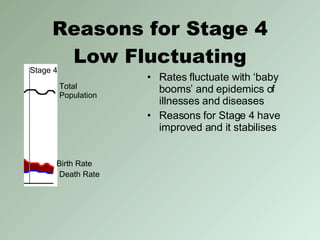
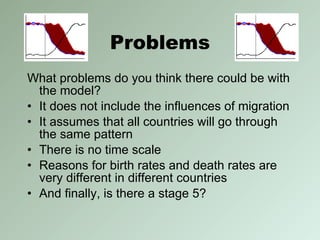


The document discusses population change over time using the Demographic Transition Model. The model outlines 4 stages of population growth: 1) High birth/death rates and slow population increase 2) Decreasing death rates lead to faster population growth 3) Declining birth rates despite low death rates lead to slower growth 4) Low, stable birth and death rates and population levels off The document analyzes factors like improved sanitation, medicine, and food production that contribute to lower death rates in stages 2-3. It also notes criticisms of the model, like its failure to account for migration or population decline in some countries.


