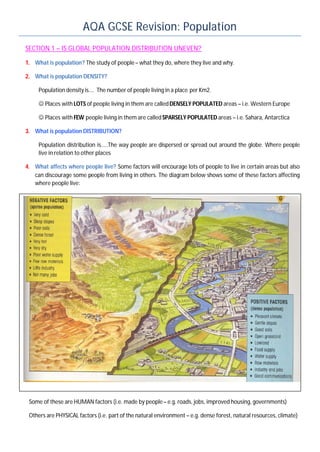
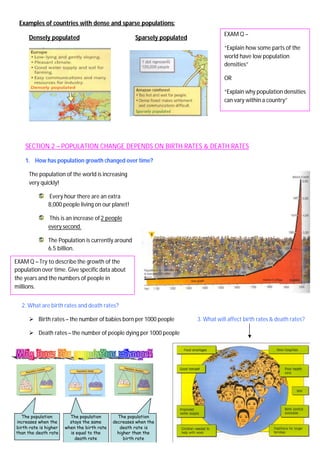
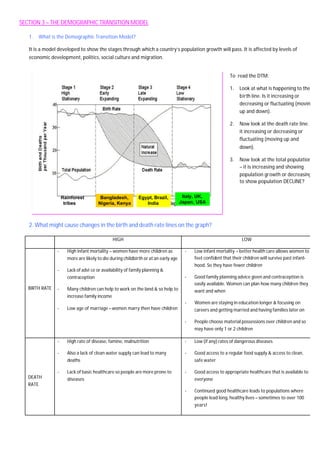
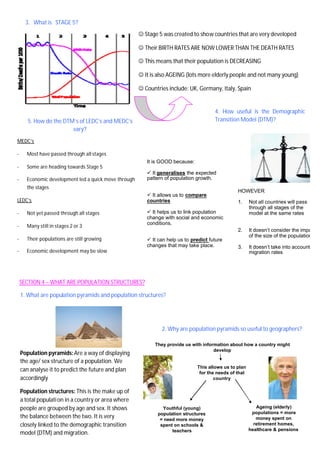
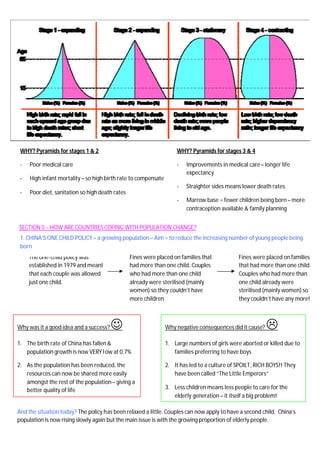
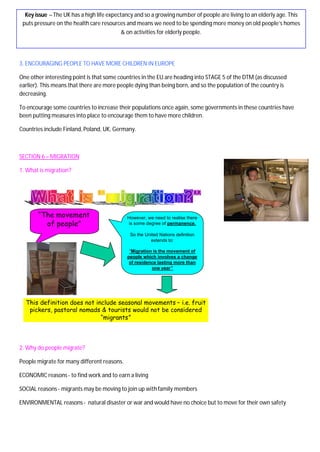
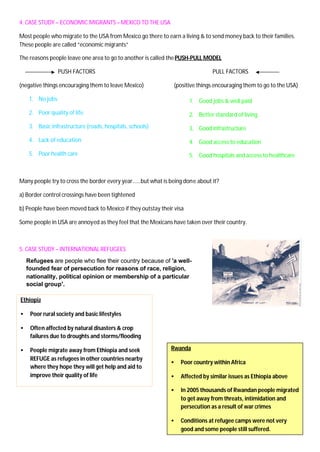
This document provides an overview of population topics including distribution, density, growth, and structures. It discusses factors that influence where people live and how population changes over time depending on birth and death rates. The demographic transition model is introduced to show the stages of population growth. Different population pyramids are described for more and less economically developed countries. Ways that countries address population issues like China's one-child policy and policies to increase birth rates in aging European nations are summarized. The different types and impacts of migration are also outlined.
Demographic transition in India and its effectsSarinkumar P S
Population expansion around the world has shown a pattern of rapid increase, again stabilization and very small increase or decline after that. This trend is conceptualized as demographic transition. In the following presentation we will look at:
1. PopulationDynamics
2. Demographictransitiontheory
3. PatternofDemographictransitionacrosstheworld
4. DemographictransitioninIndia
5. EffectsofdemographictransitioninIndia
GROWTH RATE & ESTIMATED POPULATION INDUSTRIALIZATION/URBANIZTIONKanav Bhanot
A BRIEF PRESENTATION ON GROWTH RATE & ESTIMATED POPULATION INDUSTRIALIZATION/URBANIZTION
NOTE- FONTS MAY APPEAR WEIRD BCOZ THE FONTS I USED DO NOT APPEAR IN THIS PPT.
Shraddha Acharya_Demographic transition theory n NDHSMMC, IOM, Nepal
here are some slides on Demographic Transition Theory and the Nepal Demographic and Health Survey's major indicators!!!...hope it comes out as an informative presentation!!!
Study of various population factor and its effect.AJAY CHETRI
Demographic Transition,World Population Demographics,Economic Growth Facts Concerned,Reflexion,World’s Population growth Hierachy,Glimpses of Population Growth in relation to Socio economic developments,Agricultural Revolution,Social Equity View,Both hunger and high fertility occur when:,Women’s Education,Family Planning,Challenge: Burden of Diseasein the new millenium,Birth Control Methods in China,A change an Initiative,The challenge of caring for a billion,Economic development, Education and Health,Air pollution is changing Earth’s biosphere. ,Water pollution affects ecosystems.
O INÍCIO DA CARREIRA DOCENTE NA EDUCAÇÃO FÍSICA: UM OLHAR A PARTIR DOS DIÁRIO...ProfessorPrincipiante
Para Ferreira e Reali (2009), iniciar a carreira de professor implica uma série de
experiências que podem conduzir a construções positivas acerca da profissão ou não.
Trata-se do primeiro contato concreto com a prática pedagógica assumido agora sob o
papel de professor e, portanto, demarca um momento ímpar na trajetória profissional e
também de grande influência na constituição dos referenciais de ação, crença, intuição e
conhecimentos do docente
El siguiente trabajo muestra el informe de una página web desarrollada utilizando la herramienta Wordpress, la cual trata de una plataforma digital del tema de electrónica, donde se pretende mostrar por medio de este medio informático diferentes temas acerca de esta materia, es decir elementos básicos creaciones de circuitos, libros.
Aquí se muestran algunos de los comandos que utilizaba MS-DOS, y que actualmente pueden ser utilizados desde la línea de comandos en sistemas operativos Windows. Para acceder a la ayuda de estas
GEOGRAPHY IGCSE: POPULATION DYNAMICS. It contains: increase in the world's population, over and under population, anti and pro-natalist policies, China's one child policy, France population strategies, Bristol case study.
The world’s population is more than three times larger than it was in the mid-twentieth century. The global human population reached 8.0 billion in mid-November 2022 from an estimated 2.5 billion people in 1950, adding 1 billion people since 2010 and 2 billion since 1998. The world’s population is expected to increase by nearly 2 billion persons in the next 30 years, from the current 8 billion to 9.7 billion in 2050 and could peak at nearly 10.4 billion in the mid-2080s.
1) To know how countries pass through different stages of population growth as shown in the five stages of the Demographic Transition Model (birth rate, death rate and natural population changes) and how it changes population structure
2) To understand the impact of increasing urbanisation, agricultural change, education and the emancipation of women on the rate of population growth
3. To know how to construct a population pyramid
4. To understand how to interpret population characteristics from a pyramid and how to predict likely future changes in a population.
In this unit we will find about about we study population (indicators), the evolution of the world population, the population ageing, the pyramid population, and the migration.
How british society changed 1890 1918 revcpugh5345
A revision guide to how British society changed 1890-1918. This has been made by myself - a year 11 gcse student (A* in History) - therefore i know what i`m talking about.
1. AQA GCSE Revision: Population
SECTION 1 – IS GLOBAL POPULATION DISTRIBUTION UNEVEN?
1. What is population? The study of people– what they do, where they live and why.
2. What is population DENSITY?
Population density is…. The number of people living in a place per Km2.
J Places with LOTS of people living in them are calledDENSELY POPULATED areas – i.e. Western Europe
J Places with FEW people living in them are calledSPARSELY POPULATED areas – i.e. Sahara, Antarctica
3. What is population DISTRIBUTION?
Population distribution is…..The way people are dispersed or spread out around the globe. Where people
live in relation to other places
4. What affects where people live? Some factors will encourage lots of people to live in certain areas but also
can discourage some people from living in others. The diagram below shows some of these factors affecting
where people live:
Some of these are HUMAN factors (i.e. made by people– e.g. roads, jobs, improved housing, governments)
Others are PHYSICAL factors (i.e. part of the natural environment – e.g. dense forest, natural resources, climate)
2. Examples of countries with dense and sparse populations:
Densely populated Sparsely populated
SECTION 2 – POPULATION CHANGE DEPENDS ON BIRTH RATES & DEATH RATES
1. How has population growth changed over time?
2. What are birth rates and death rates?
Ø Birth rates – the number of babies born per 1000 people
Ø Death rates – the number of people dying per 1000 people
The population of the world is increasing
very quickly!
Every hour there are an extra
8,000 people living on our planet!
This is an increase of2 people
every second.
The Population is currently around
6.5 billion.
EXAM Q – Try to describe the growth of the
population over time. Give specific data about
the years and the numbers of people in
millions.
3. What will affect birth rates & death rates?
The population
increases when the
birth rate is higher
than the death rate
The population
stays the same
when the birth rate
is equal to the
death rate
The population
decreases when the
death rate is
higher than the
birth rate
EXAM Q –
“Explain how some parts of the
world have low population
densities”
OR
“Explain why population densities
can vary within a country”
3. SECTION 3 – THE DEMOGRAPHIC TRANSITION MODEL
1. What is the Demographic Transition Model?
It is a model developed to show the stages through which a country’s population growth will pass. It is affected by levels of
economic development, politics, social culture and migration.
2. What might cause changes in the birth and death rate lines on the graph?
HIGH LOW
BIRTH RATE
- High infant mortality – women have more children as
more are likely to die during childbirth or at an early age
- Lack of advi ce or availability of family planning &
contraception
- Many children can help to work on the land & so help to
increase family income
- Low age of marriage – women marry then have children
- Low infant mortality – better health care allows women to
feel confident that their children will survive past infant-
hood. So they have fewer children
- Good family planning advice given and contraception is
easily available. Women can plan how many children they
want and when
- Women are staying in education longer & focusing on
careers and getting married and having families later on
- People choose material possessions over children and so
may have only 1 or 2 children
DEATH
RATE
- High rate of disease, famine, malnutrition
- Also a lack of clean water supply can lead to many
deaths
- Lack of basic healthcare so people are more prone to
diseases
- Low (if any) rates of dangerous diseases
- Good access to a regular food supply & access to clean,
safe water
- Good access to appropriate healthcare that is available to
everyone
- Continued good healthcare leads to populations where
people lead long, healthy lives – sometimes to over 100
years!
Rainforest
tribes
Bangladesh,
Nigeria, Kenya
Egypt, Brazil,
India
Italy, UK,
Japan, USA
To read the DTM:
1. Look at what is happening to the
birth line. Is it increasing or
decreasing or fluctuating (moving
up and down).
2. Now look at the death rate line. Is
it increasing or decreasing or
fluctuating (moving up and
down).
3. Now look at the total population
– it is increasing and showing
population growth or decreasing
to show population DECLINE?
4. 3. What is STAGE 5?
SECTION 4 – WHAT ARE POPULATION STRUCTURES?
3. What do population pyramids for MEDC’s and LEDC’s look like– AND WHY is this?
J Stage 5 was created to show countries that are very developed
J Their BIRTH RATES ARE NOW LOWER THAN THE DEATH RATES
J This means that their population is DECREASING
J It is also AGEING (lots more elderly people and not many young)
J Countries include: UK, Germany, Italy, Spain
4. How useful is the Demographic
Transition Model (DTM)?
It is GOOD because:
ü It generalises the expected
pattern of population growth.
ü It allows us to compare
countries
ü It helps us to link population
change with social and economic
conditions.
ü It can help us to predict future
changes that may take place.
HOWEVER
1. Not all countries will pass
through all stages of the
model at the same rates
2. It doesn’t consider the impact
of the size of the population
3. It doesn’t take into account
migration rates
5. How do the DTM’s of LEDC’s and MEDC’s
vary?
MEDC’s
- Most have passed through all stages
- Some are heading towards Stage 5
- Economic development led a quick move through
the stages
LEDC’s
- Not yet passed through all stages
- Many still in stages 2 or 3
- Their populations are still growing
- Economic development may be slow
1. What are population pyramids and population structures?
Population pyramids:Are a way of displaying
the age/ sex structure of a population. We
can analyse it to predict the future and plan
accordingly
Population structures: This is the make up of
a total population in a country or area where
people are grouped by age and sex. It shows
the balance between the two. It is very
closely linked to the demographic transition
model (DTM) and migration.
They provide us with information about how a country might
develop
This allows us to plan
for the needs of that
country
Youthful (young)
population structures
= need more money
spent on schools &
teachers
Ageing (elderly)
populations = more
money spent on
retirement homes,
healthcare & pensions
2. Why are population pyramids so useful to geographers?
5. SECTION 5 – HOW ARE COUNTRIES COPING WITH POPULATION CHANGE?
2. The UNITED KINGDOM – an ageing population – Aim = to manage the growing number of elderly people in the UK
WHY? Pyramids for stages 1 & 2
- Poor medical care
- High infant mortality – so high birth rate to compensate
- Poor diet, sanitation so high death rates
WHY? Pyramids for stages 3 & 4
- Improvements in medical care– longer life
expectancy
- Straighter sides means lower death rates
- Marrow base = fewer children being born– more
contraception available & family planning
The one-child policy was
established in 1979 and meant
that each couple was allowed
just one child.
1. CHINA’S ONE CHILD POLICY – a growing population – Aim = to reduce the increasing number of young people being
born
Fines were placed on families that
had more than one child. Couples
who had more than one child
already were sterilised (mainly
women) so they couldn’t have
more children
Fines were placed onfamilies
that had more than one child.
Couples who had more than
one child already were
sterilised (mainly women) so
they couldn’t have any more!
Why was it a good idea and a success?J
1. The birth rate of China has fallen&
population growth is now VERY low at 0.7%
2. As the population has been reduced, the
resources can now be shared more easily
amongst the rest of the population– giving a
better quality of life
Why negative consequences did it cause? L
1. Large numbers of girls were aborted or killed due to
families preferring to have boys
2. It has led to a culture of SPOILT, RICH BOYS!! They
have been called “The Little Emperors”
3. Less children means less people to care for the
elderly generation – it itself a big problem!
And the situation today? The policy has been relaxed a little. Couples can now apply to have a second child. China’s
population is now rising slowly again but the main issue is with the growing proportion of elderly people.
6. 3. ENCOURAGING PEOPLE TO HAVE MORE CHILDREN IN EUROPE
One other interesting point is that some countries in the EU are heading into STAGE 5 of the DTM (as discussed
earlier). This means that there are more people dying than being born, and so the population of the country is
decreasing.
To encourage some countries to increase their populations once again, some governments in these countries have
been putting measures into place to encourage them to have more children.
Countries include Finland, Poland, UK, Germany.
SECTION 6 – MIGRATION
1. What is migration?
2. Why do people migrate?
People migrate for many different reasons.
ECONOMIC reasons- to find work and to earn a living
SOCIAL reasons - migrants may be moving to join up withfamily members
ENVIRONMENTAL reasons - natural disaster or war and would have no choice but to move for their own safety
Key issue – The UK has a high life expectancy and so a growing number of people are living to an elderly age. This
puts pressure on the health care resources and means we need to be spending more money on old people’s homes
& on activities for elderly people.
“The movement
of people”
However, we need to realise there
is some degree of permanence.
So the United Nations definition
extends to:
“Migration is the movement of
people which involves a change
of residence lasting more than
one year”
This definition does not include seasonal movements – i.e. fruit
pickers, pastoral nomads & tourists would not be considered
“migrants”
7. Migration:- Push & Pull factors
Push Barriers Pull
Reasons for Obstacles that make Attractiveness
wanting to leave moving difficult of distant region
Inaccessibility Attractive scenery
Unemployment Employment
Lack of food Danger of moving Food supply
War Costs Safety
Persecution Distance Cheaper housing
Leaving family Nice environment
Expensive housing/living costs Transport
3. What are the different types of migration
CAUSE DISTANCE TYPE OF AREA
FORCED VOLUNTARY INTERNAL INTERNATIONAL POOR TO RICH RICH TO POOR
These are things
that would
encourage people
to leave an area.
They are usually
negative things.
These are things
that would
encourage
people to go to
another area.
They are usually
positive things.
8. 4. CASE STUDY – ECONOMIC MIGRANTS – MEXICO TO THE USA
Most people who migrate to the USA from Mexico go there to earn a living & to send money back to their families.
These people are called “economic migrants”
The reasons people leave one area to go to another is called thePUSH-PULL MODEL
PUSH FACTORS PULL FACTORS
(negative things encouraging them to leave Mexico) (positive things encouraging them to go to the USA)
1. No jobs
2. Poor quality of life
3. Basic infrastructure (roads, hospitals, schools)
4. Lack of education
5. Poor health care
Many people try to cross the border every year……but what is being done about it?
a) Border control crossings have been tightened
b) People have been moved back to Mexico if they outstay their visa
Some people in USA are annoyed as they feel that the Mexicans have taken over their country.
5. CASE STUDY – INTERNATIONAL REFUGEES
1. Good jobs & well paid
2. Better standard of living
3. Good infrastructure
4. Good access to education
5. Good hospitals and access to healthcare
Ethiopia
• Poor rural society and basic lifestyles
• Often affected by natural disasters & crop
failures due to droughts and storms/flooding
• People migrate away from Ethiopia and seek
REFUGE as refugees in other countries nearby
where they hope they will get help and aid to
improve their quality of life
Refugees are people who flee their country because of 'a well-
founded fear of persecution for reasons of race, religion,
nationality, political opinion or membership of a particular
social group'.
Rwanda
• Poor country within Africa
• Affected by similar issues as Ethiopia above
• In 2005 thousands of Rwandan people migrated
to get away from threats, intimidation and
persecution as a result of war crimes
• Conditions at refugee camps were not very
good and some people still suffered.
9. 6. What are the advantages and disadvantages of migration?
Impact Place they are leaving from
(ORIGIN COUNTRY)
Place they are going to
(DESTINATION COUNTRY)
Social (to do with
people)
- As younger people migrate, it leaves an
elderly population behind
- As a result, death rates might rise (due to
more old people) and birth rate may fall
(due to fewer young people there to have
children)
- As young move in, the younger age
groups increase in numbers
- Birth rate might rise (due to more
younger people having children) and
death rates falling (due to fewer
elderly people)
Economic (to do with
money)
- Those with skills and education leave
causinglabour shortages
- Those with skills & education arrive– this
may put pressure on the jobs available and
some locals may not get jobs as they are
given to migrant workers who will work
longer and for less pay
Environmental - Decline in farming land– more land
abandoned
- pressure on resources as more people
move in – pollution possibly & more
shanty towns to accommodate people
You could always visit-
http://www.geographyalltheway.com/ib_geography/ib_population/ib_popn_movement_consequences.html and watch
the BBC News movies about the different impacts of migration around the worldJ