Downloaded 519 times

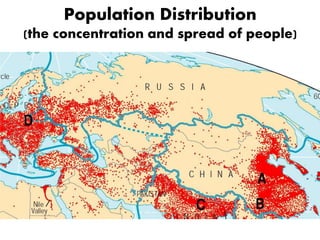
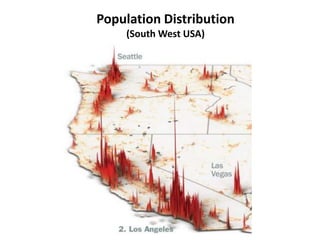
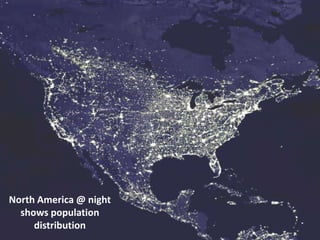
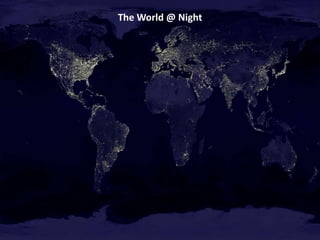
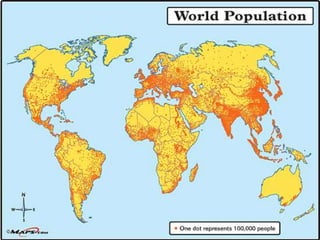
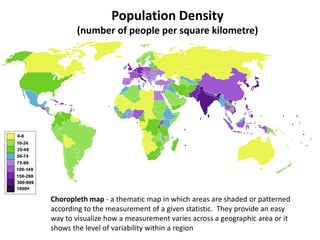
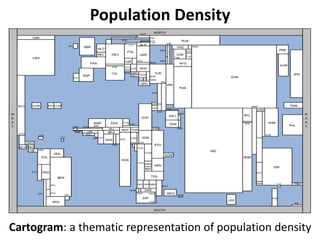
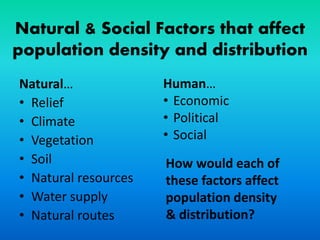
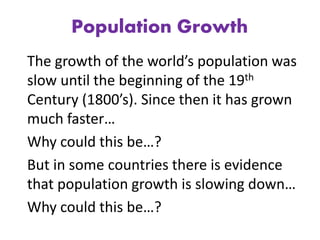
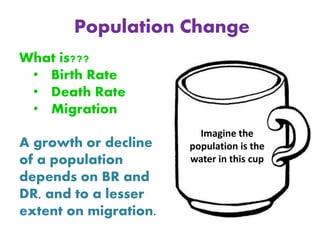
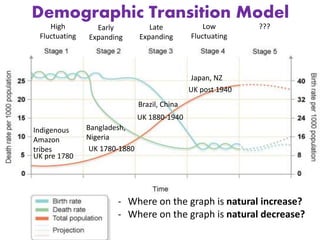
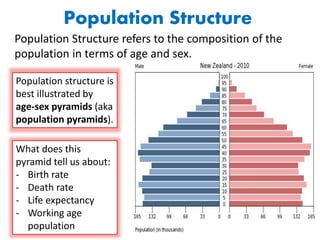
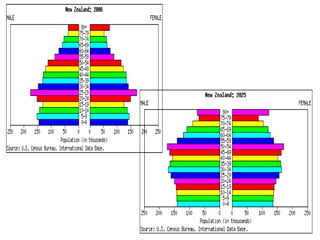
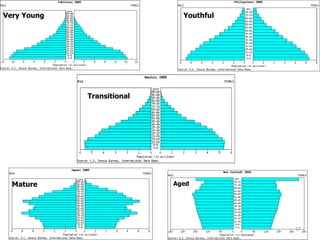
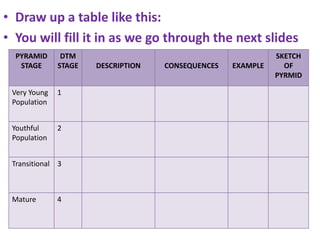
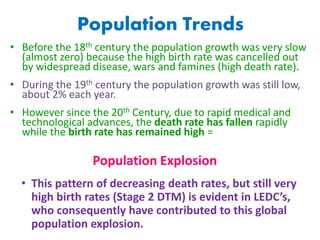
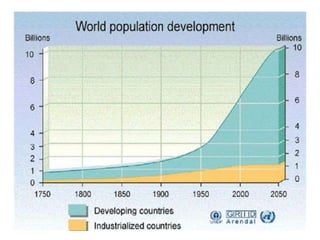
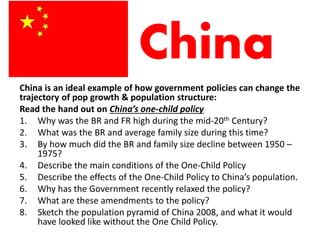
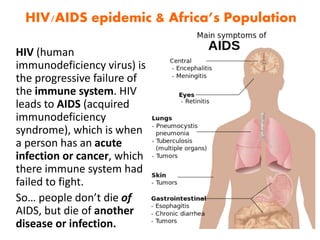
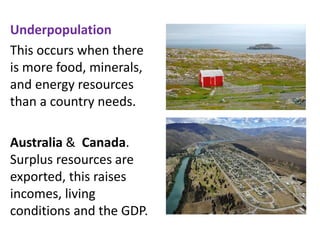
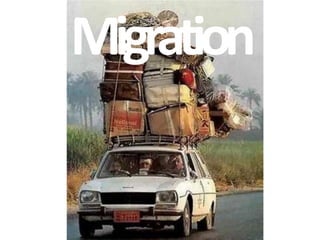
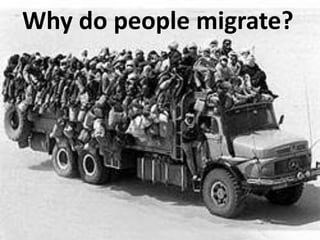

The document discusses population distribution, density, and growth, analyzing various factors affecting demographics such as natural resources and social conditions. It explores concepts including the demographic transition model, population structures, and the distinctions between different types of populations, including young, youthful, transitional, and mature populations. Additionally, it addresses migration motivations and demographics, emphasizing the impact of policies such as China's one-child policy and the challenges faced by populations in less economically developed countries.


