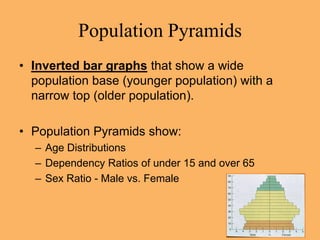
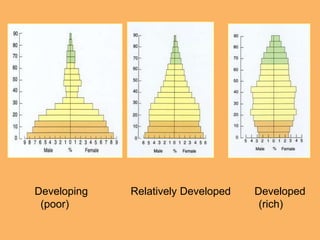
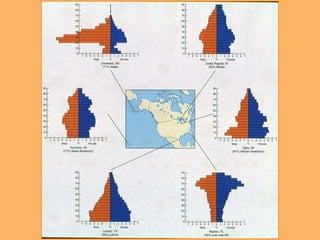
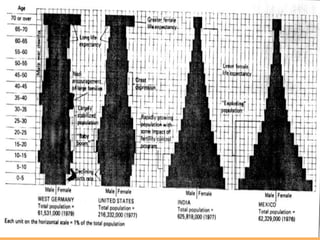
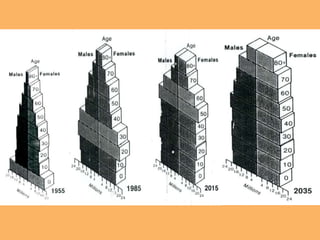
Demographic Transition
And Population Patterns
I Demographic Transition
Model
A. Tool designed to show how population
growth is related to economic growth.
B. Traces the changing level of population
growth associated with industrialization
and urbanization
C. Demographic Transition model has 4
stages
STAGE 1
A. High birth and high death rates create slow
population growth.
B. Around 8,000 BC the Agricultural Revolution
took place and humans began planting crops, so
population started to grow slowly
C. This was the case for all humans until about
1750
D. All countries have moved passed stage 1, with
African countries the last to move into stage 2
Stage 2
A. Death rates drop due to Industrial Revolution
that in part brought new medical and sanitary
practices that created a healthier population.
B. Birth rates remain high resulting in rapid
population growth.
C. USA and Europe moved into stage 2 in the
1800s
D. Africa, Asia and Latin America didn’t enter stage
2 until the 1950s and was caused by the Medical
Revolution. A time when Medical technology
diffused to these areas.
STAGE 3
A. Birth rates begin to drop due to family planning,
education, and the increase of economic
demands, so birth rates come closer to death
rates.
B. Population growth slows, yet is still growing.
C. North America and Europe entered into stage 3
in the early 1900s
D. Most Latin American countries like Brazil,
Argentina, Mexico, and Asian countries like
Vietnam, Thailand, and Philippines fit into this
category.
E. A majority of African countries remain in Stage 2
STAGE 4
1. Birth and death rates are equally low so
population growth is very limited.
2. Countries often reach a point of ZPG, or Zero
Population Growth, where there is no natural
increase. ZPG is reached when TFR falls below
2.1 replacement levels.
3. Many Western European countries entered into
stage 4 in the 1990s and USA entered around
2000.
5 NEW STAGE. This was added to show that
some countries have birth rates falling well
below death rates and their population is
shrinking.
II Western Experience
A. The Demographic Transition model was
developed to show how Western Europe
transitioned from an agricultural economy
to an industrial one.
B. The transition also mirrors what is called
the EPIDEMIOLOGIC transition in which
diseases became less fatal, and people
lived longer, along with a lower infant
mortality rates.
C. The birth rates changed in western
societies because the value of large
families changed. Having kids in an
urban industrial economy is considered a
financial burden rather than an asset.
III A Divided World converging
A. Demographic transition does not look the
same everywhere
B. Some Developing countries in recent
history experience lower death rates
because of modern medicine, but do not
achieve economic levels that usually bring
lower birth rates.
C. Sri Lanka. Sprayed DDT to combat
malaria in 1946 and 8 years later life
expectancy jumped from 44 to 60
Demographic Equation
I Demographic Equation
A. The population structure is determined in
part by the demographic equation which is
the combination of natural change and
change through net migration (immigrants
– emigrants)
B There are several ways immigration has
an impact
1. Large migrations can completely change
a population structure
2. Migrations create unbalanced
populations. Most migrants are single
young males
3. Both source and destination of migrants
can have changes in population
structure.
III Population Pyramids
A. Population Pyramids are graphic devices that
represent a populations age and sex
B. Pop. Pyramids come in all shapes and sizes and are
often called profiles.
C. They show the impacts of human events such as
disease, war, population controls, and migrations.
D. Different shapes show different population
characteristics and can clearly show
dependency ratios, and future population problems
with the numbers from today.
E. Dependency Ratio is the ratio of people under 15
and over 65 that every 100 people in between those
years support.
Population Pyramids
• Inverted bar graphs that show a wide
population base (younger population) with a
narrow top (older population).
• Population Pyramids show:
– Age Distributions
– Dependency Ratios of under 15 and over 65
– Sex Ratio - Male vs. Female
Developing Relatively Developed Developed
(poor) (rich)
Demographic Transition

Demographic Transition

  • 1.
  • 2.
    I Demographic Transition Model A.Tool designed to show how population growth is related to economic growth. B. Traces the changing level of population growth associated with industrialization and urbanization C. Demographic Transition model has 4 stages
  • 3.
    STAGE 1 A. Highbirth and high death rates create slow population growth. B. Around 8,000 BC the Agricultural Revolution took place and humans began planting crops, so population started to grow slowly C. This was the case for all humans until about 1750 D. All countries have moved passed stage 1, with African countries the last to move into stage 2
  • 4.
    Stage 2 A. Deathrates drop due to Industrial Revolution that in part brought new medical and sanitary practices that created a healthier population. B. Birth rates remain high resulting in rapid population growth. C. USA and Europe moved into stage 2 in the 1800s D. Africa, Asia and Latin America didn’t enter stage 2 until the 1950s and was caused by the Medical Revolution. A time when Medical technology diffused to these areas.
  • 5.
    STAGE 3 A. Birthrates begin to drop due to family planning, education, and the increase of economic demands, so birth rates come closer to death rates. B. Population growth slows, yet is still growing. C. North America and Europe entered into stage 3 in the early 1900s D. Most Latin American countries like Brazil, Argentina, Mexico, and Asian countries like Vietnam, Thailand, and Philippines fit into this category. E. A majority of African countries remain in Stage 2
  • 6.
    STAGE 4 1. Birthand death rates are equally low so population growth is very limited. 2. Countries often reach a point of ZPG, or Zero Population Growth, where there is no natural increase. ZPG is reached when TFR falls below 2.1 replacement levels. 3. Many Western European countries entered into stage 4 in the 1990s and USA entered around 2000. 5 NEW STAGE. This was added to show that some countries have birth rates falling well below death rates and their population is shrinking.
  • 7.
    II Western Experience A.The Demographic Transition model was developed to show how Western Europe transitioned from an agricultural economy to an industrial one. B. The transition also mirrors what is called the EPIDEMIOLOGIC transition in which diseases became less fatal, and people lived longer, along with a lower infant mortality rates. C. The birth rates changed in western societies because the value of large families changed. Having kids in an urban industrial economy is considered a financial burden rather than an asset.
  • 8.
    III A DividedWorld converging A. Demographic transition does not look the same everywhere B. Some Developing countries in recent history experience lower death rates because of modern medicine, but do not achieve economic levels that usually bring lower birth rates. C. Sri Lanka. Sprayed DDT to combat malaria in 1946 and 8 years later life expectancy jumped from 44 to 60
  • 10.
  • 12.
    I Demographic Equation A.The population structure is determined in part by the demographic equation which is the combination of natural change and change through net migration (immigrants – emigrants) B There are several ways immigration has an impact 1. Large migrations can completely change a population structure 2. Migrations create unbalanced populations. Most migrants are single young males 3. Both source and destination of migrants can have changes in population structure.
  • 13.
    III Population Pyramids A.Population Pyramids are graphic devices that represent a populations age and sex B. Pop. Pyramids come in all shapes and sizes and are often called profiles. C. They show the impacts of human events such as disease, war, population controls, and migrations. D. Different shapes show different population characteristics and can clearly show dependency ratios, and future population problems with the numbers from today. E. Dependency Ratio is the ratio of people under 15 and over 65 that every 100 people in between those years support.
  • 15.
    Population Pyramids • Invertedbar graphs that show a wide population base (younger population) with a narrow top (older population). • Population Pyramids show: – Age Distributions – Dependency Ratios of under 15 and over 65 – Sex Ratio - Male vs. Female
  • 17.
    Developing Relatively DevelopedDeveloped (poor) (rich)