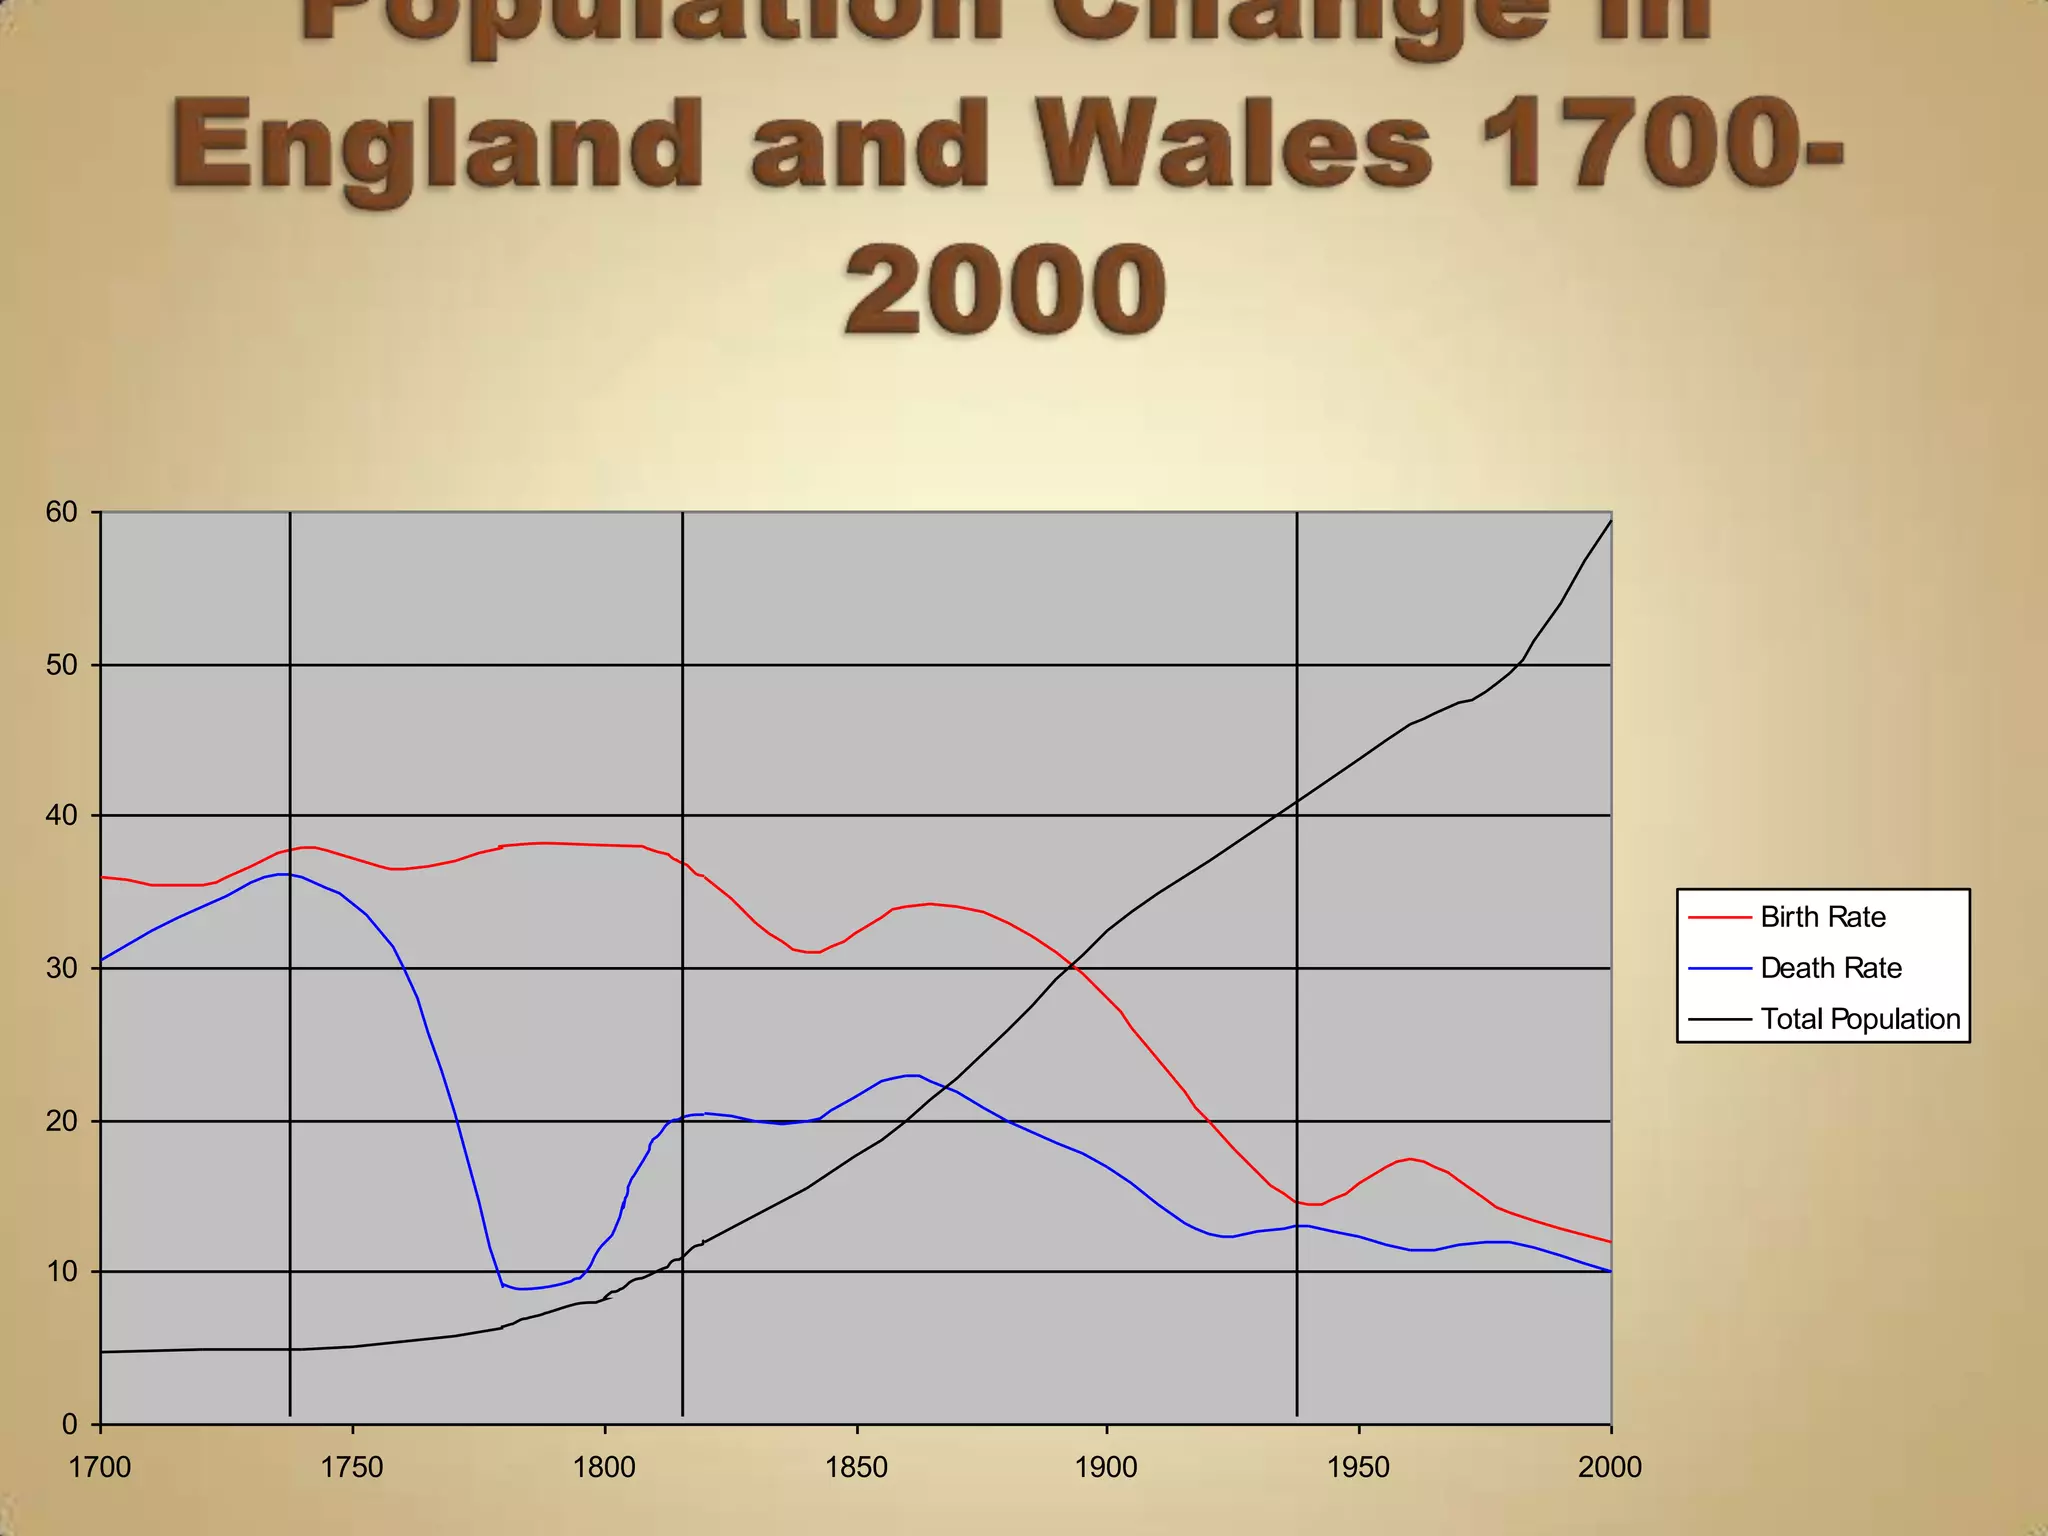
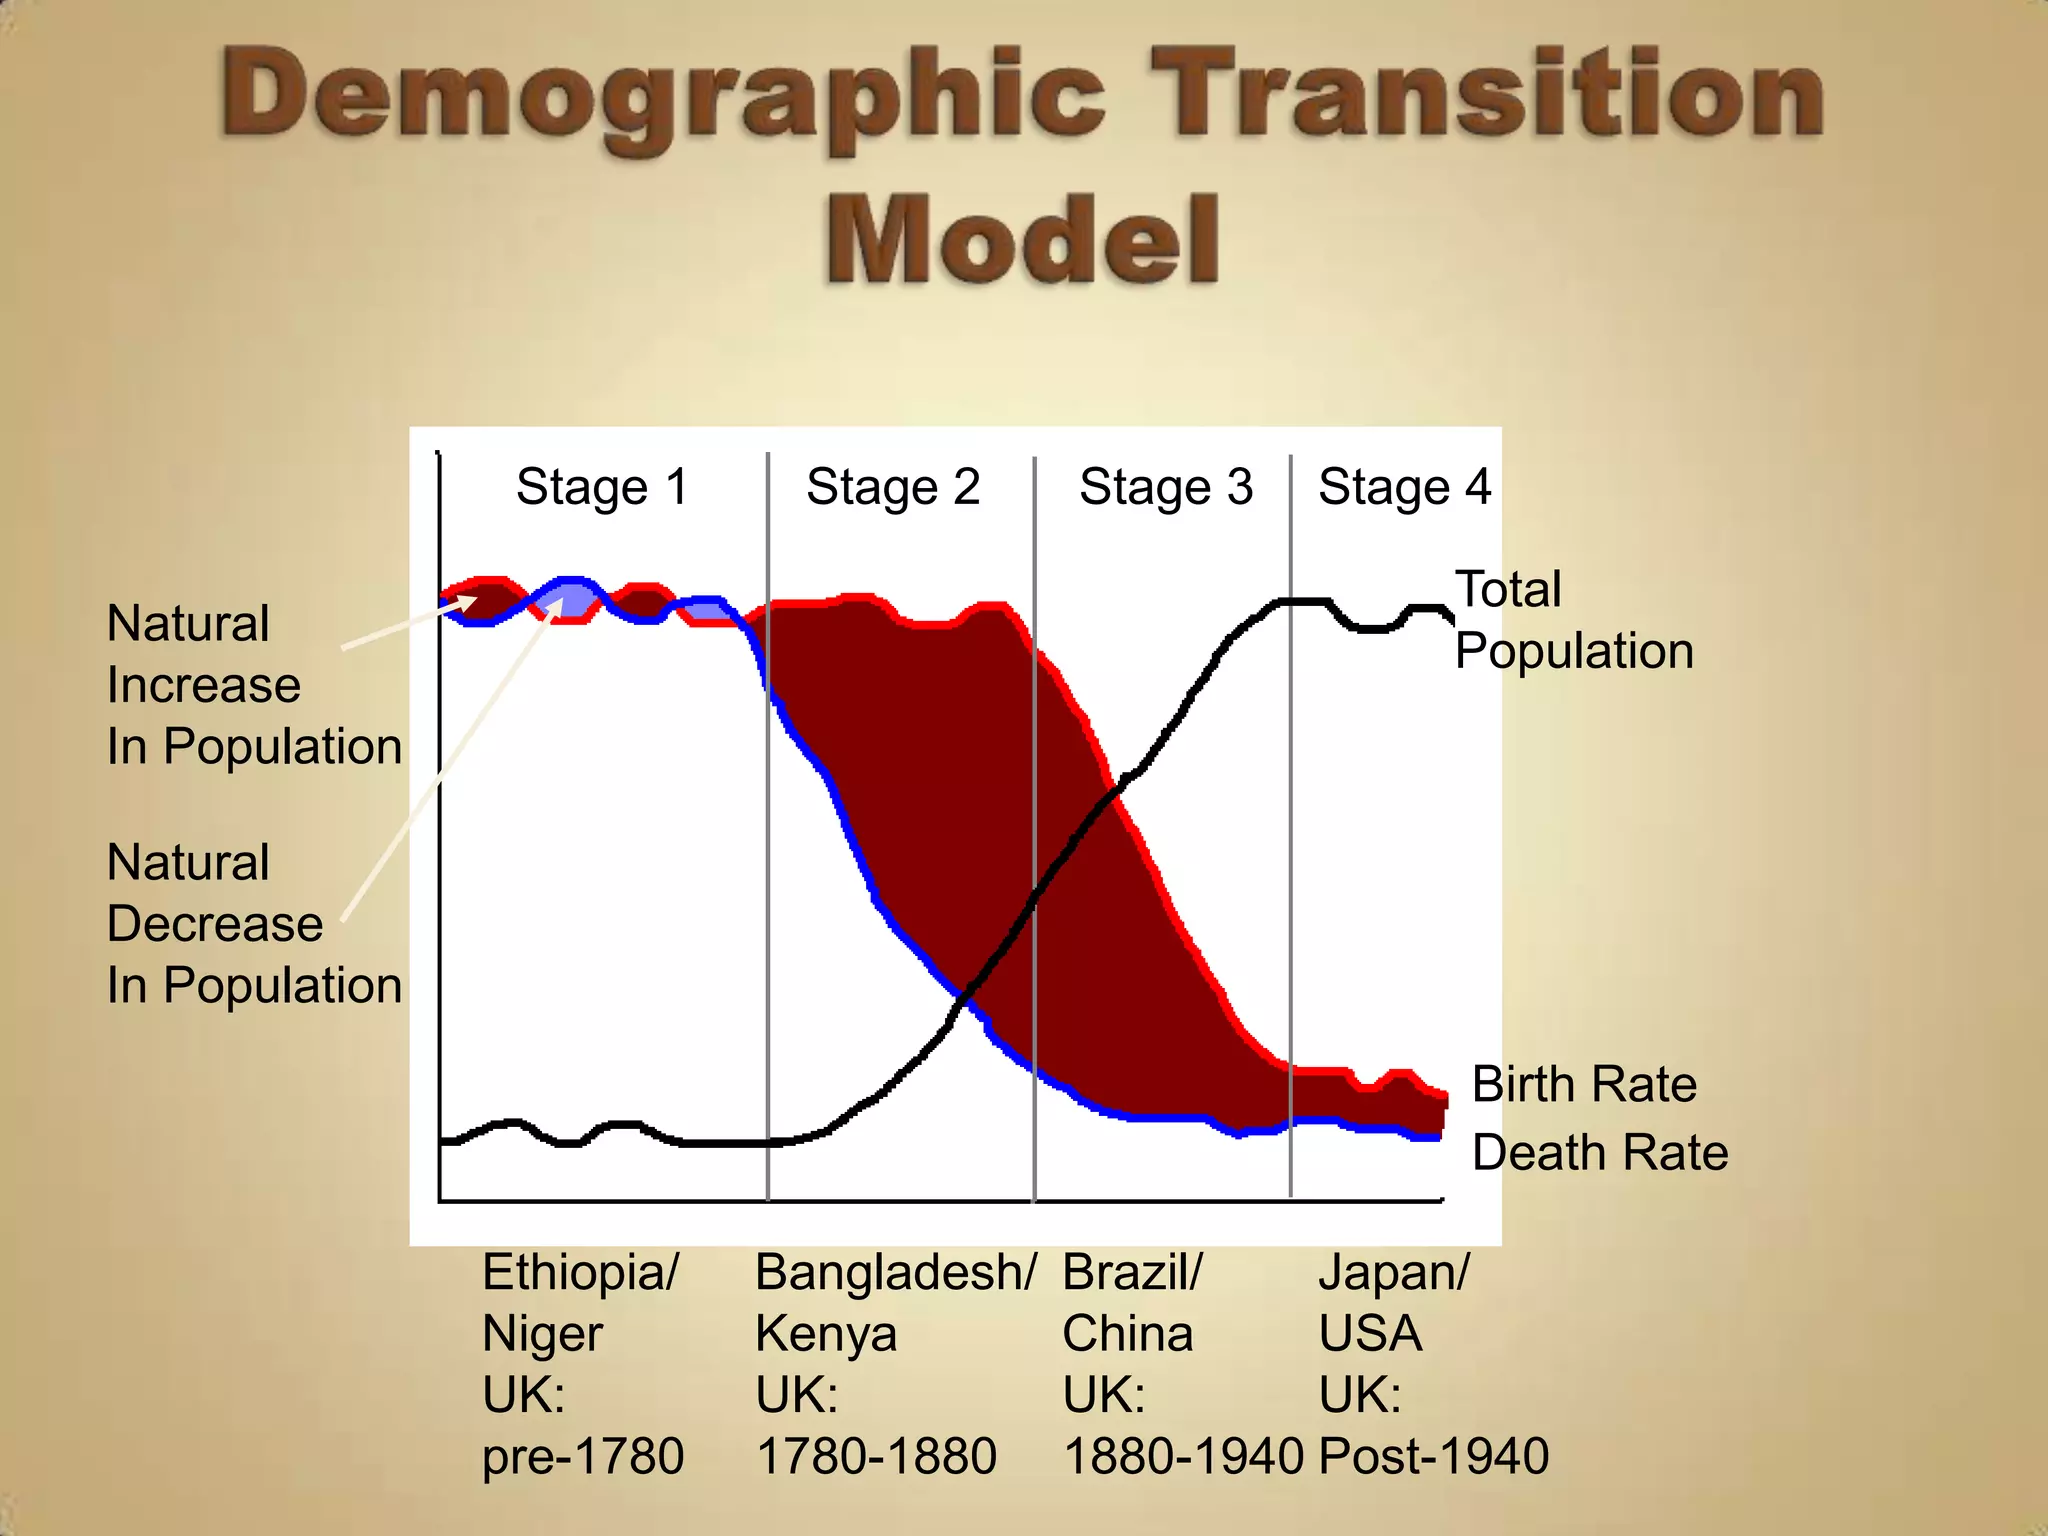
The demographic transition model describes population changes in countries as they develop economically and socially. It outlines five stages:
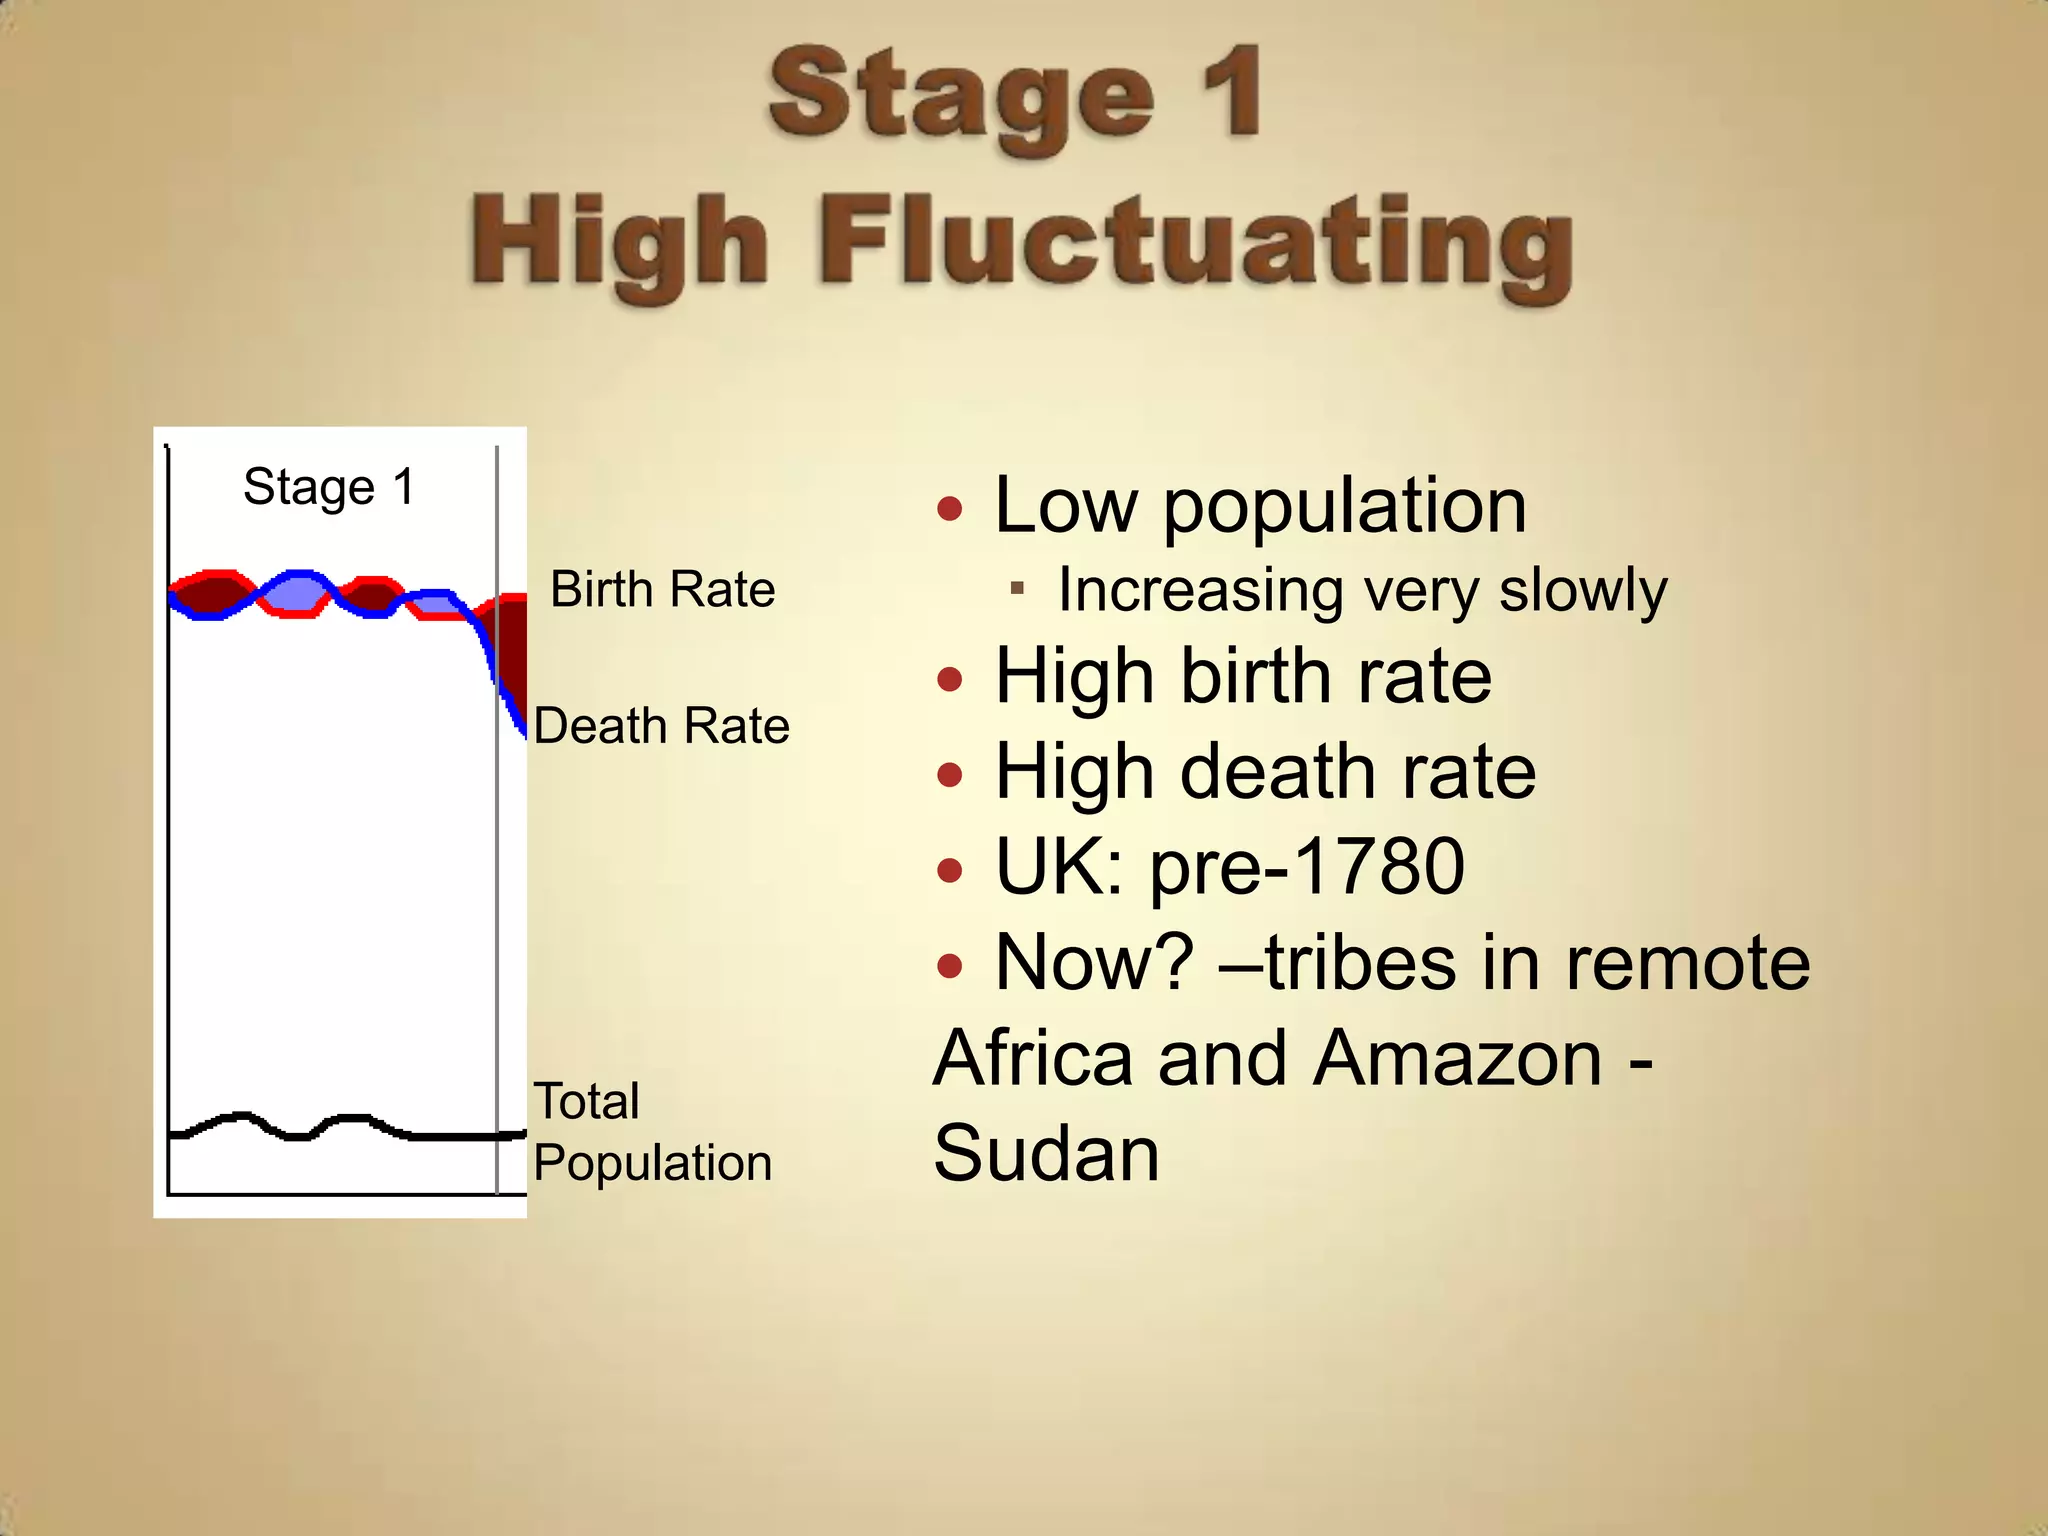
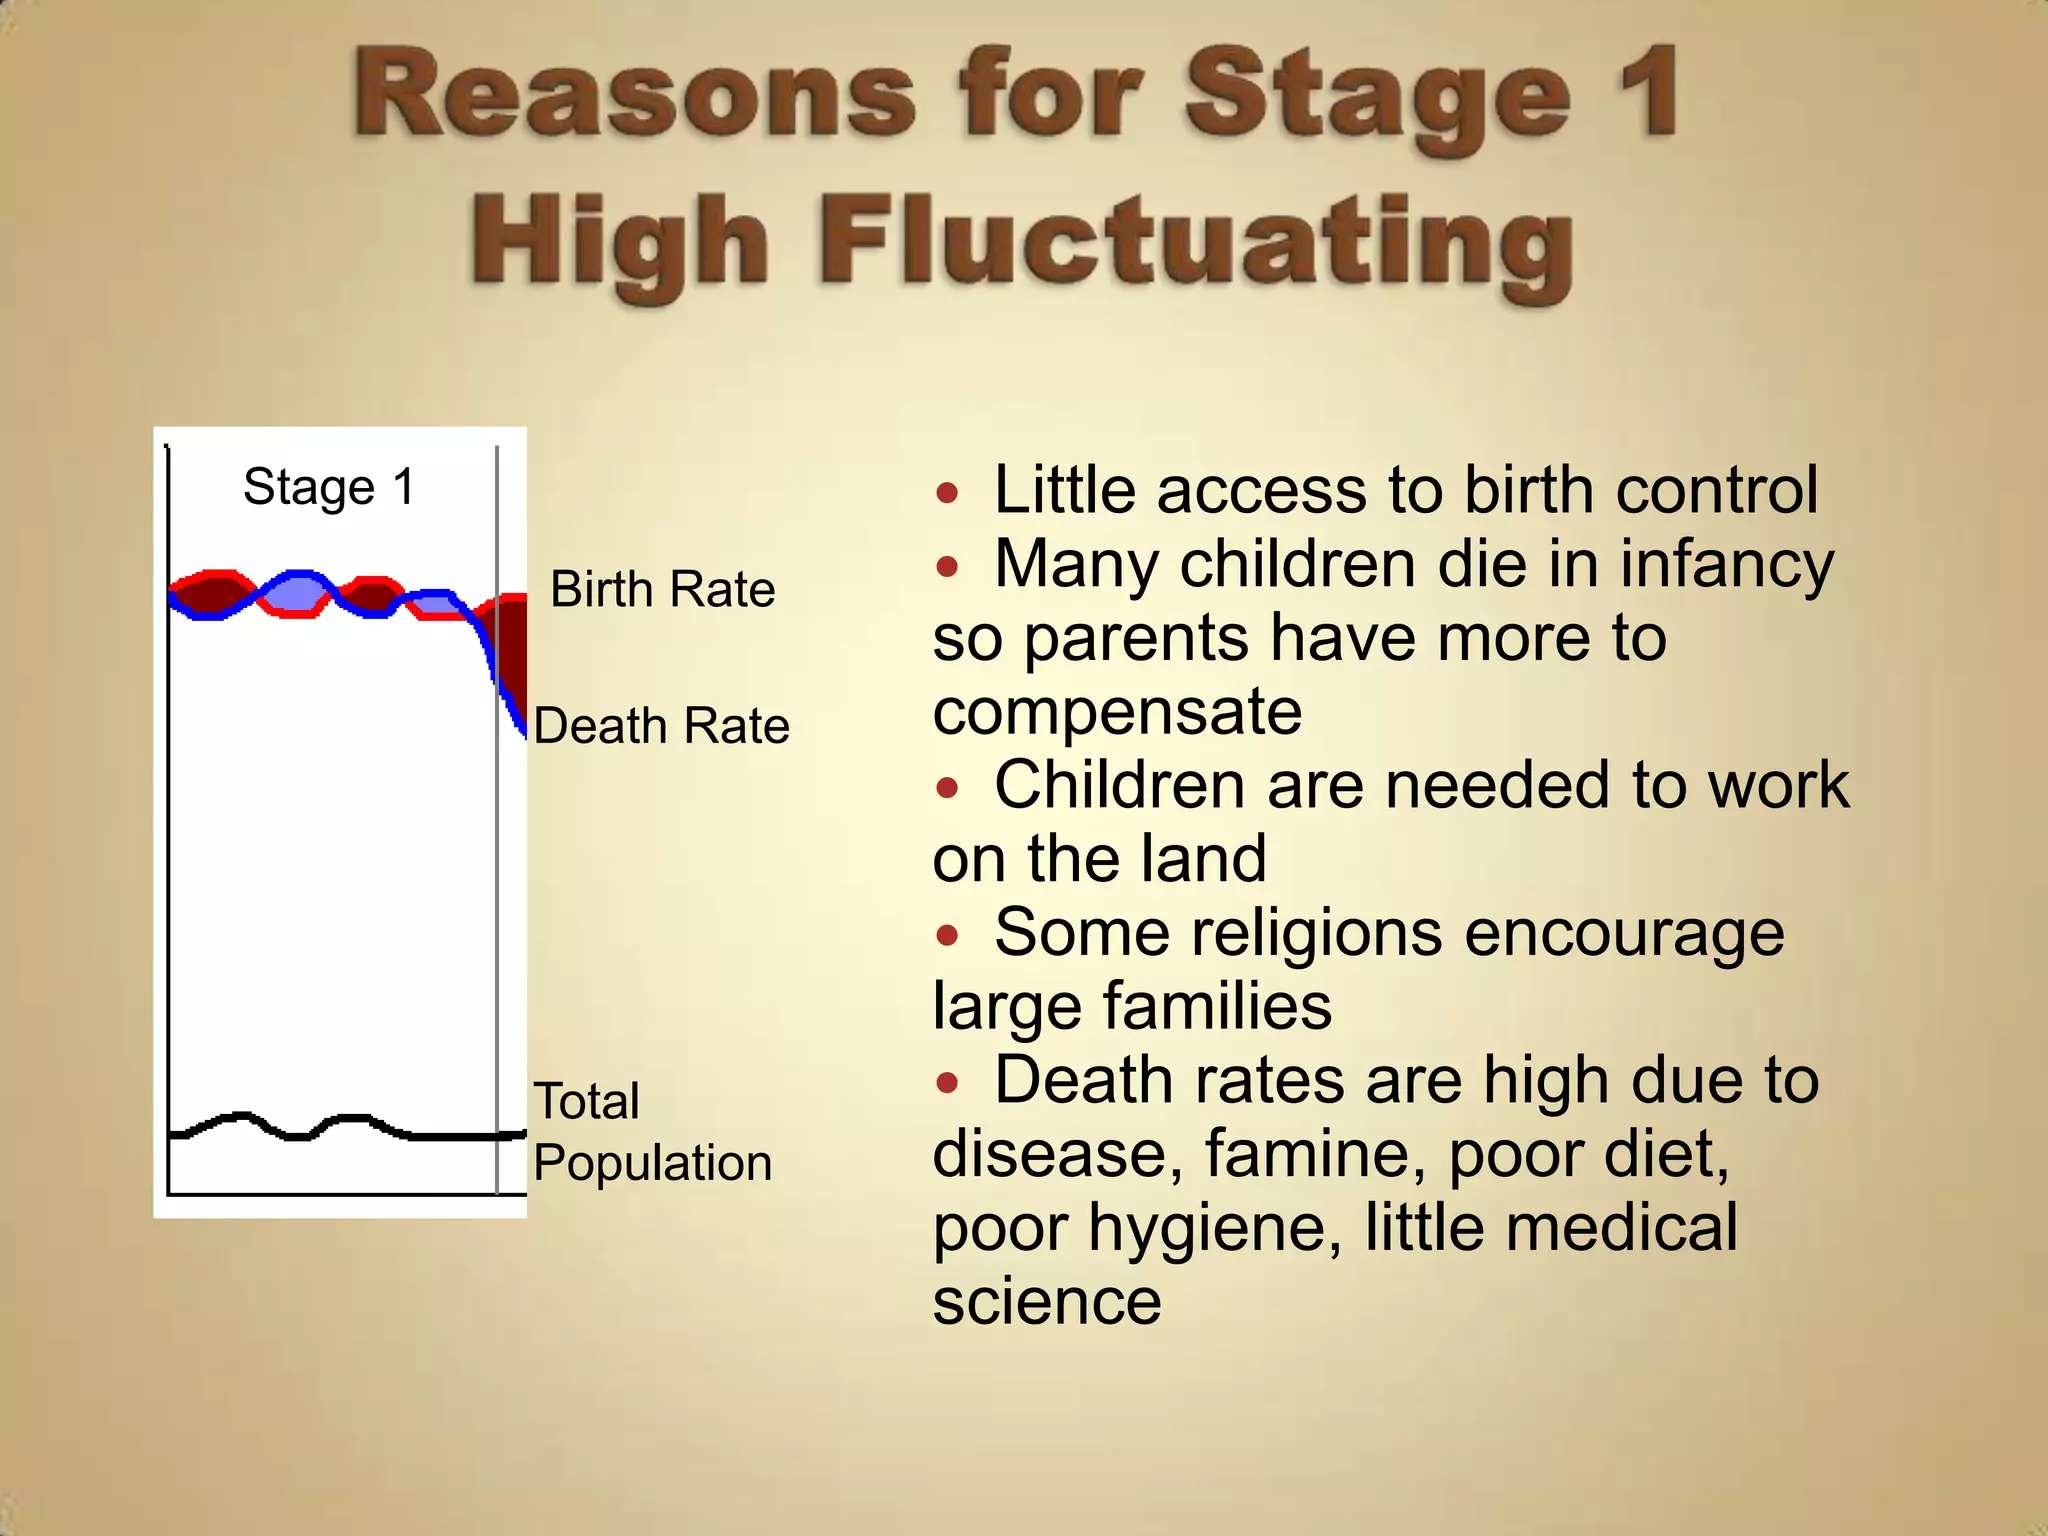
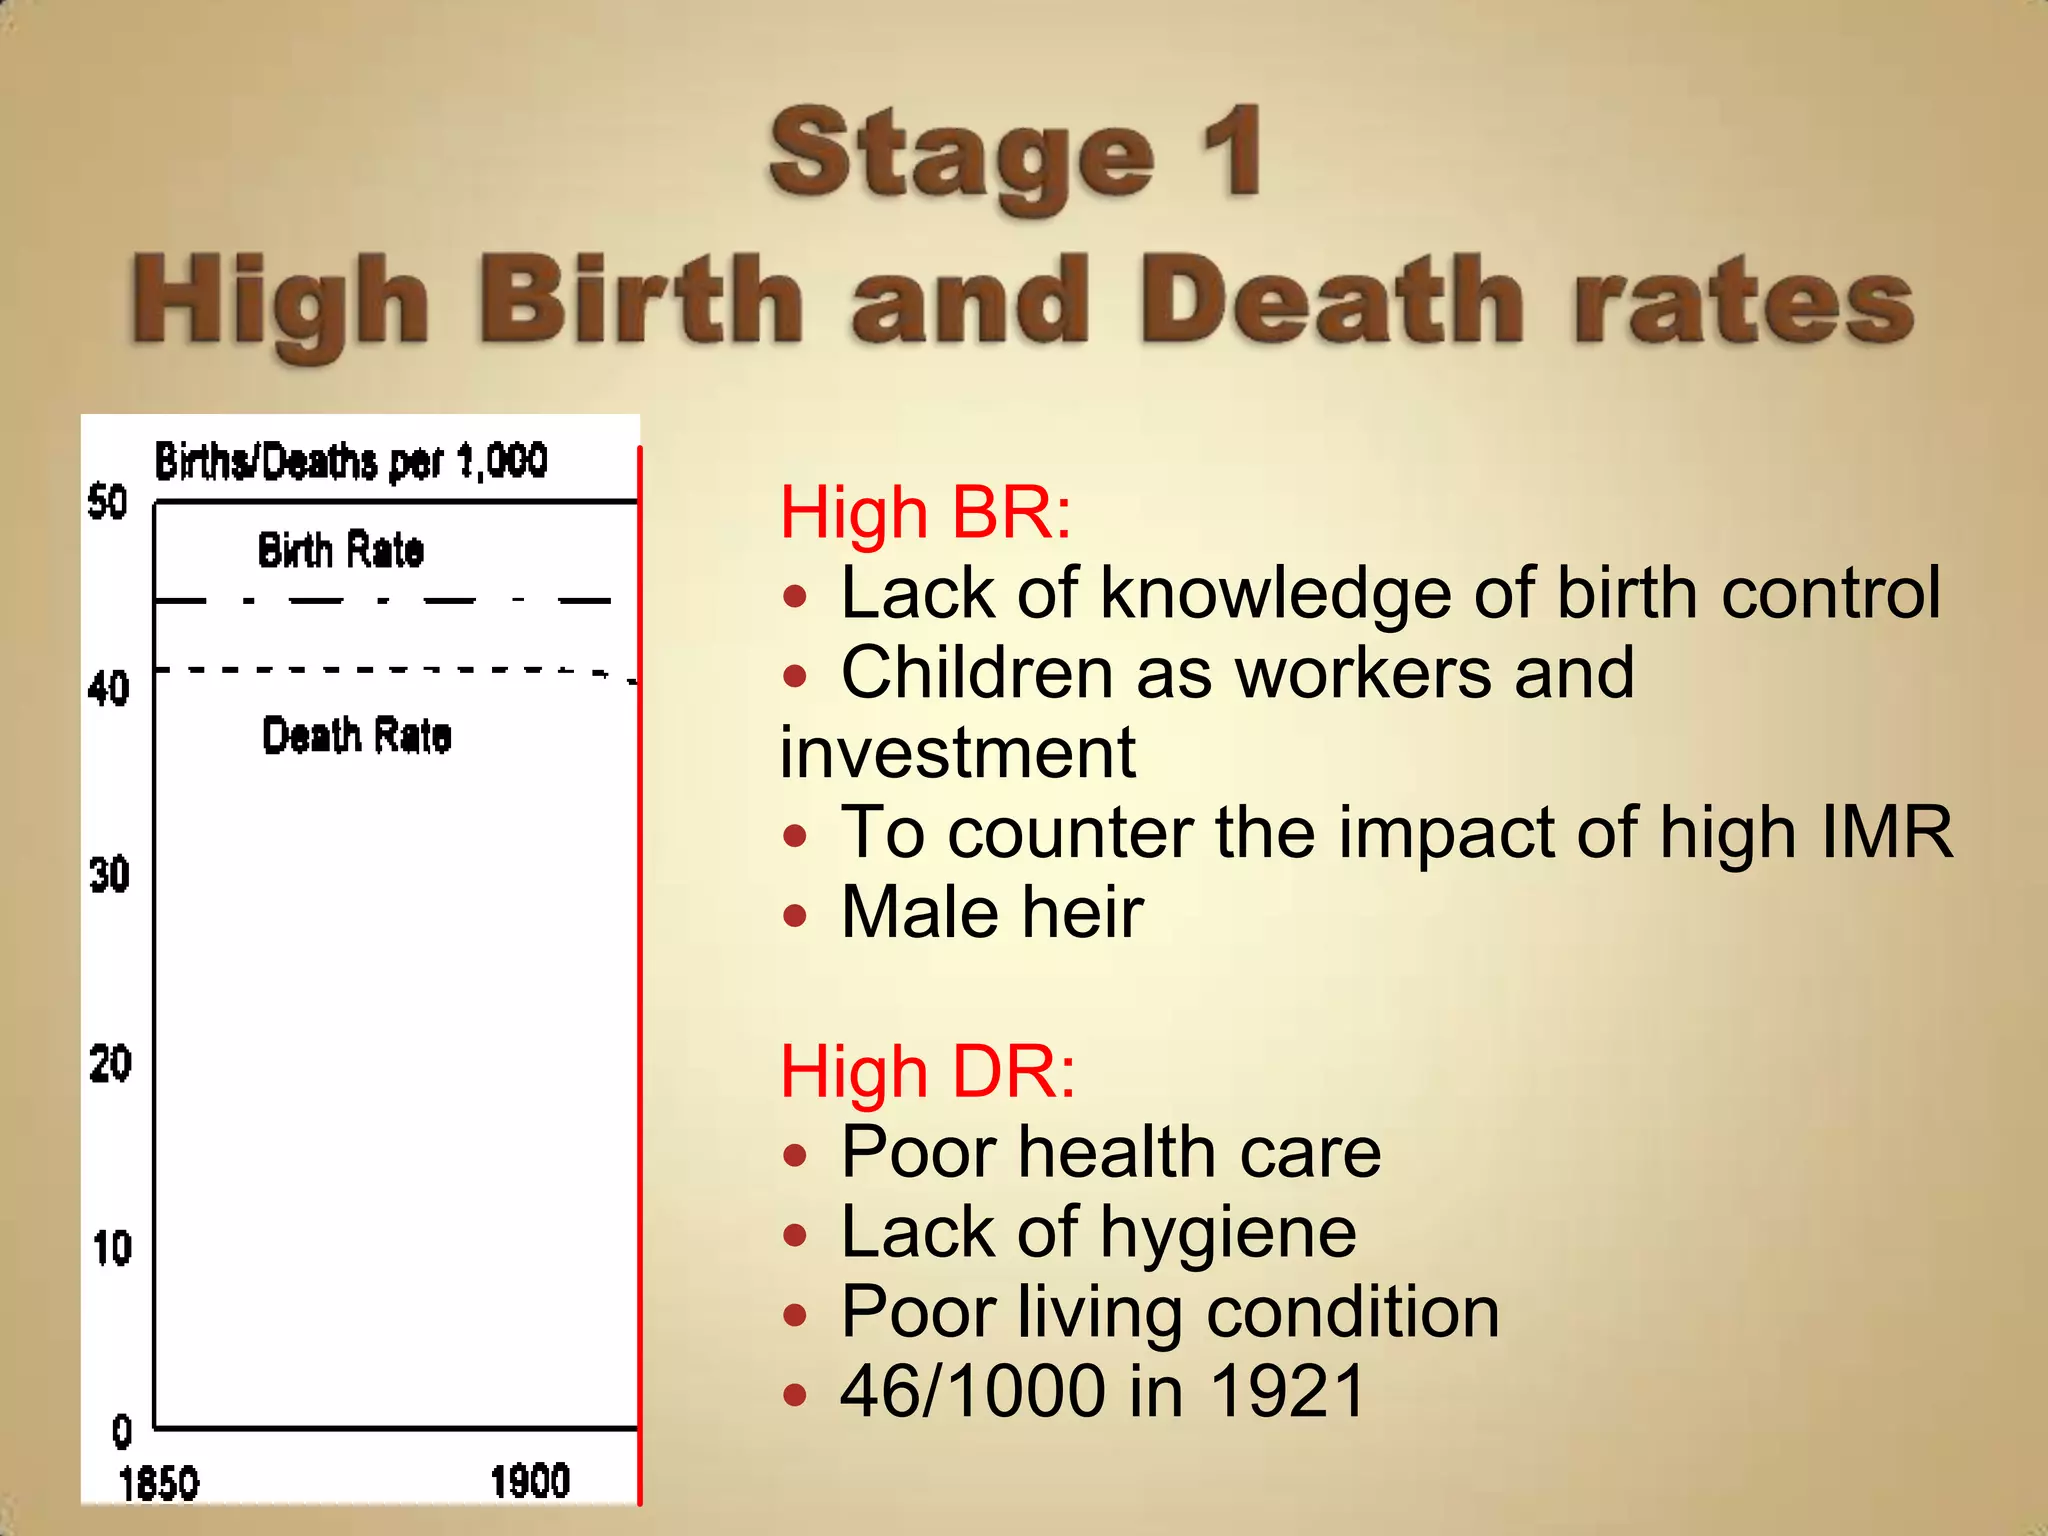
1) High birth and death rates due to lack of healthcare and sanitation.
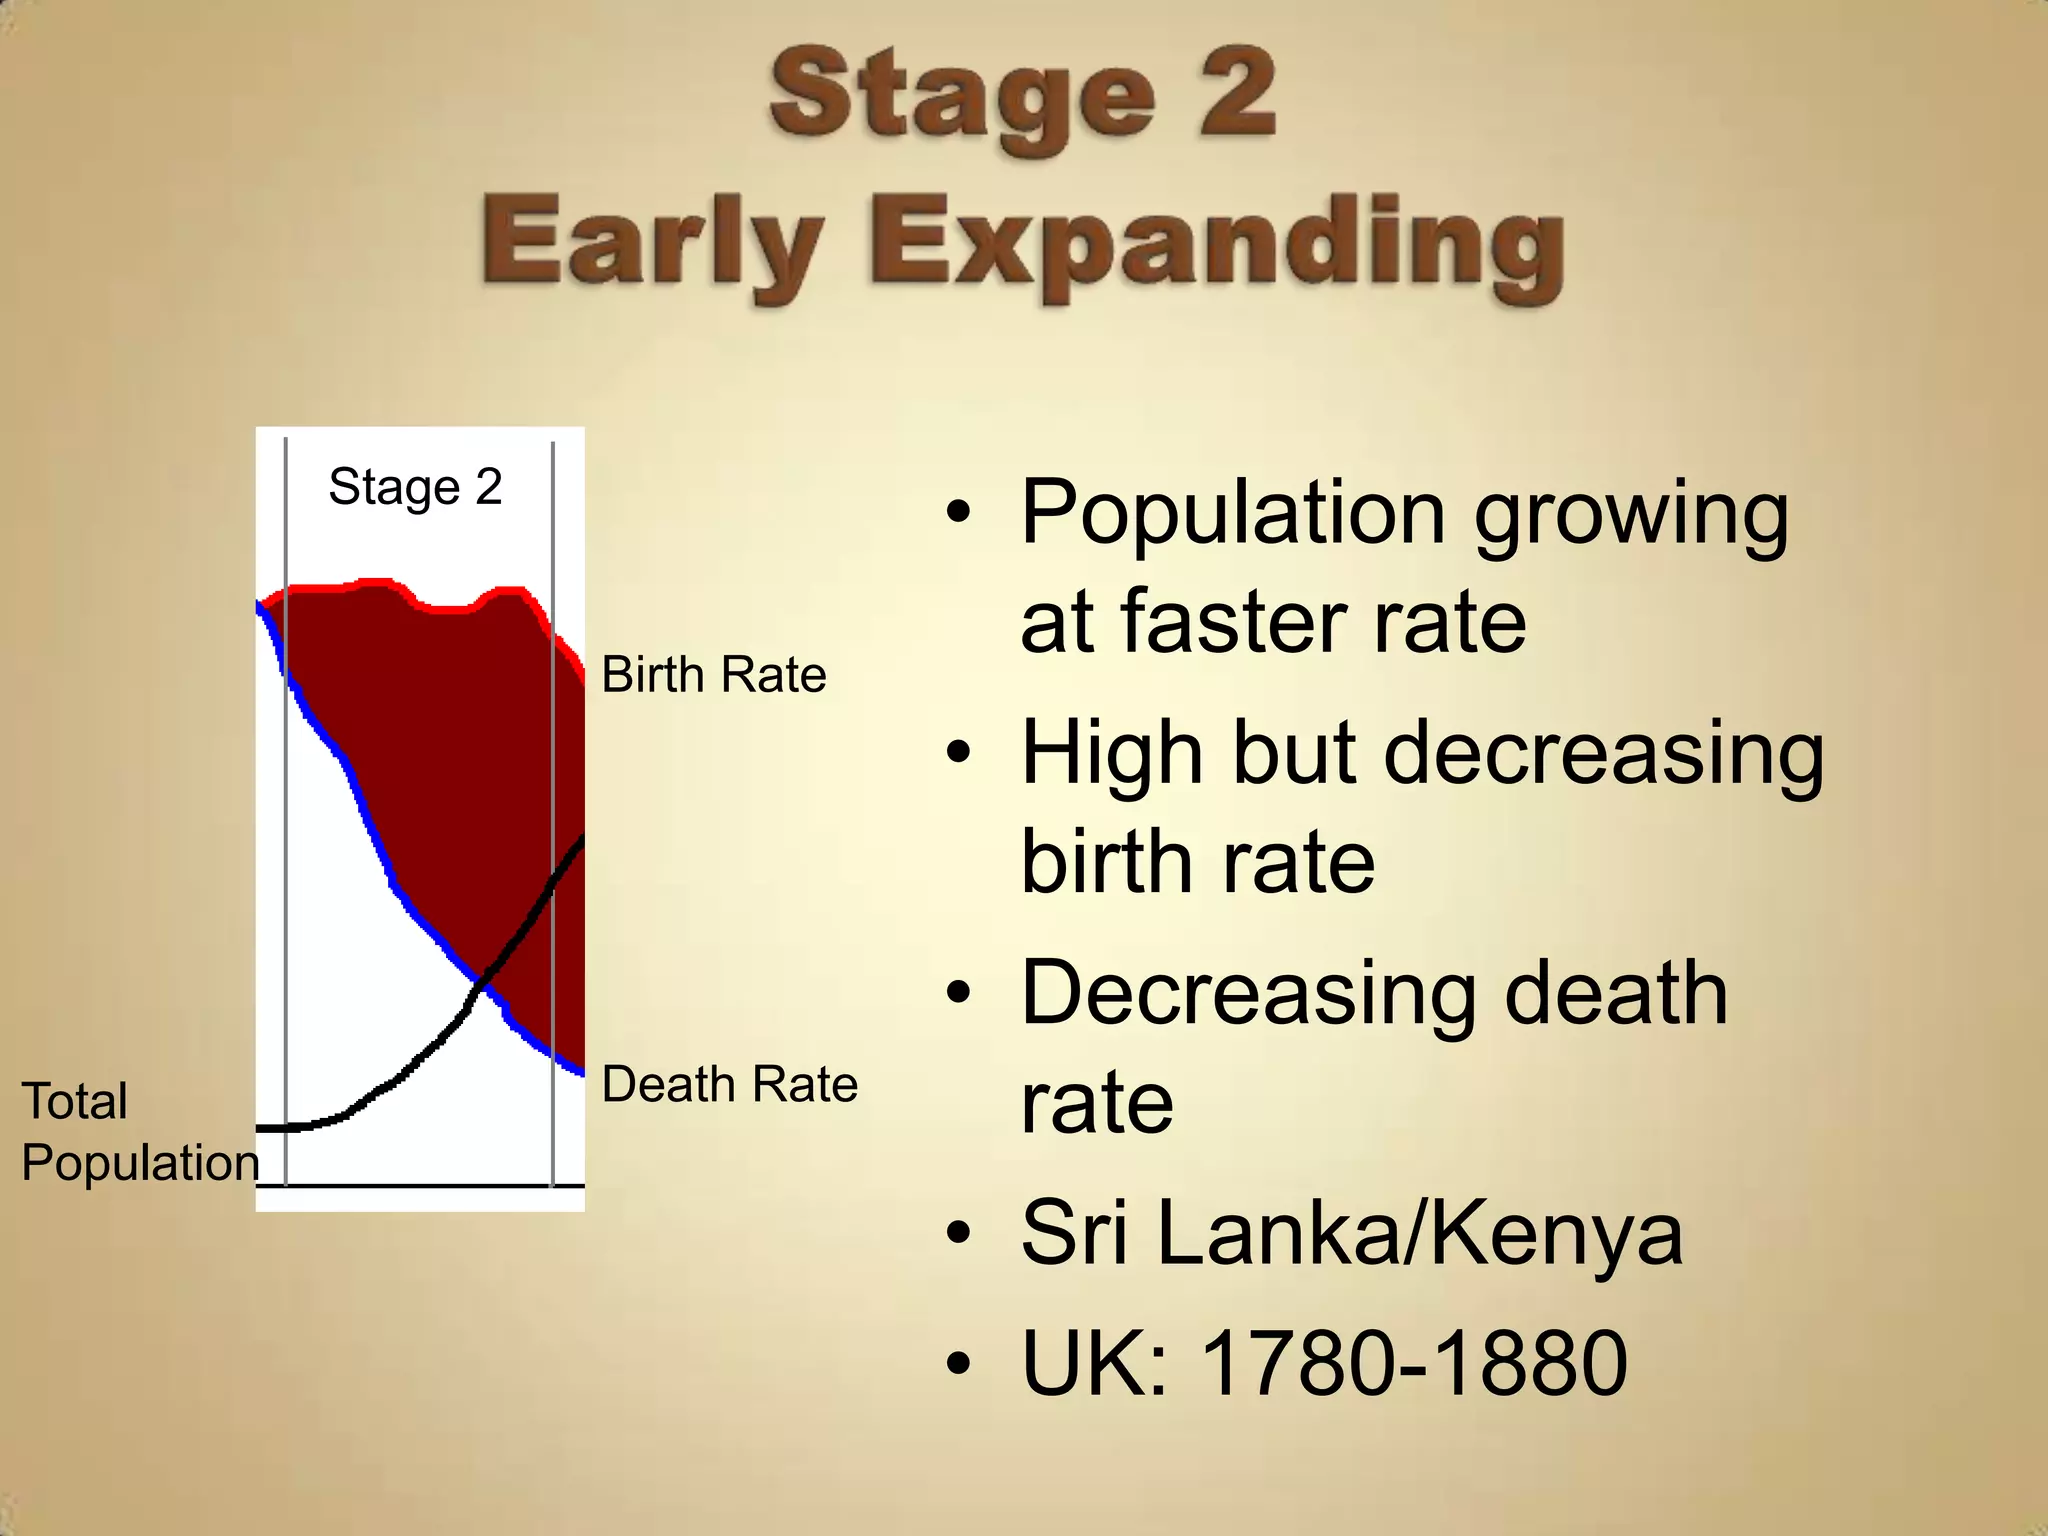
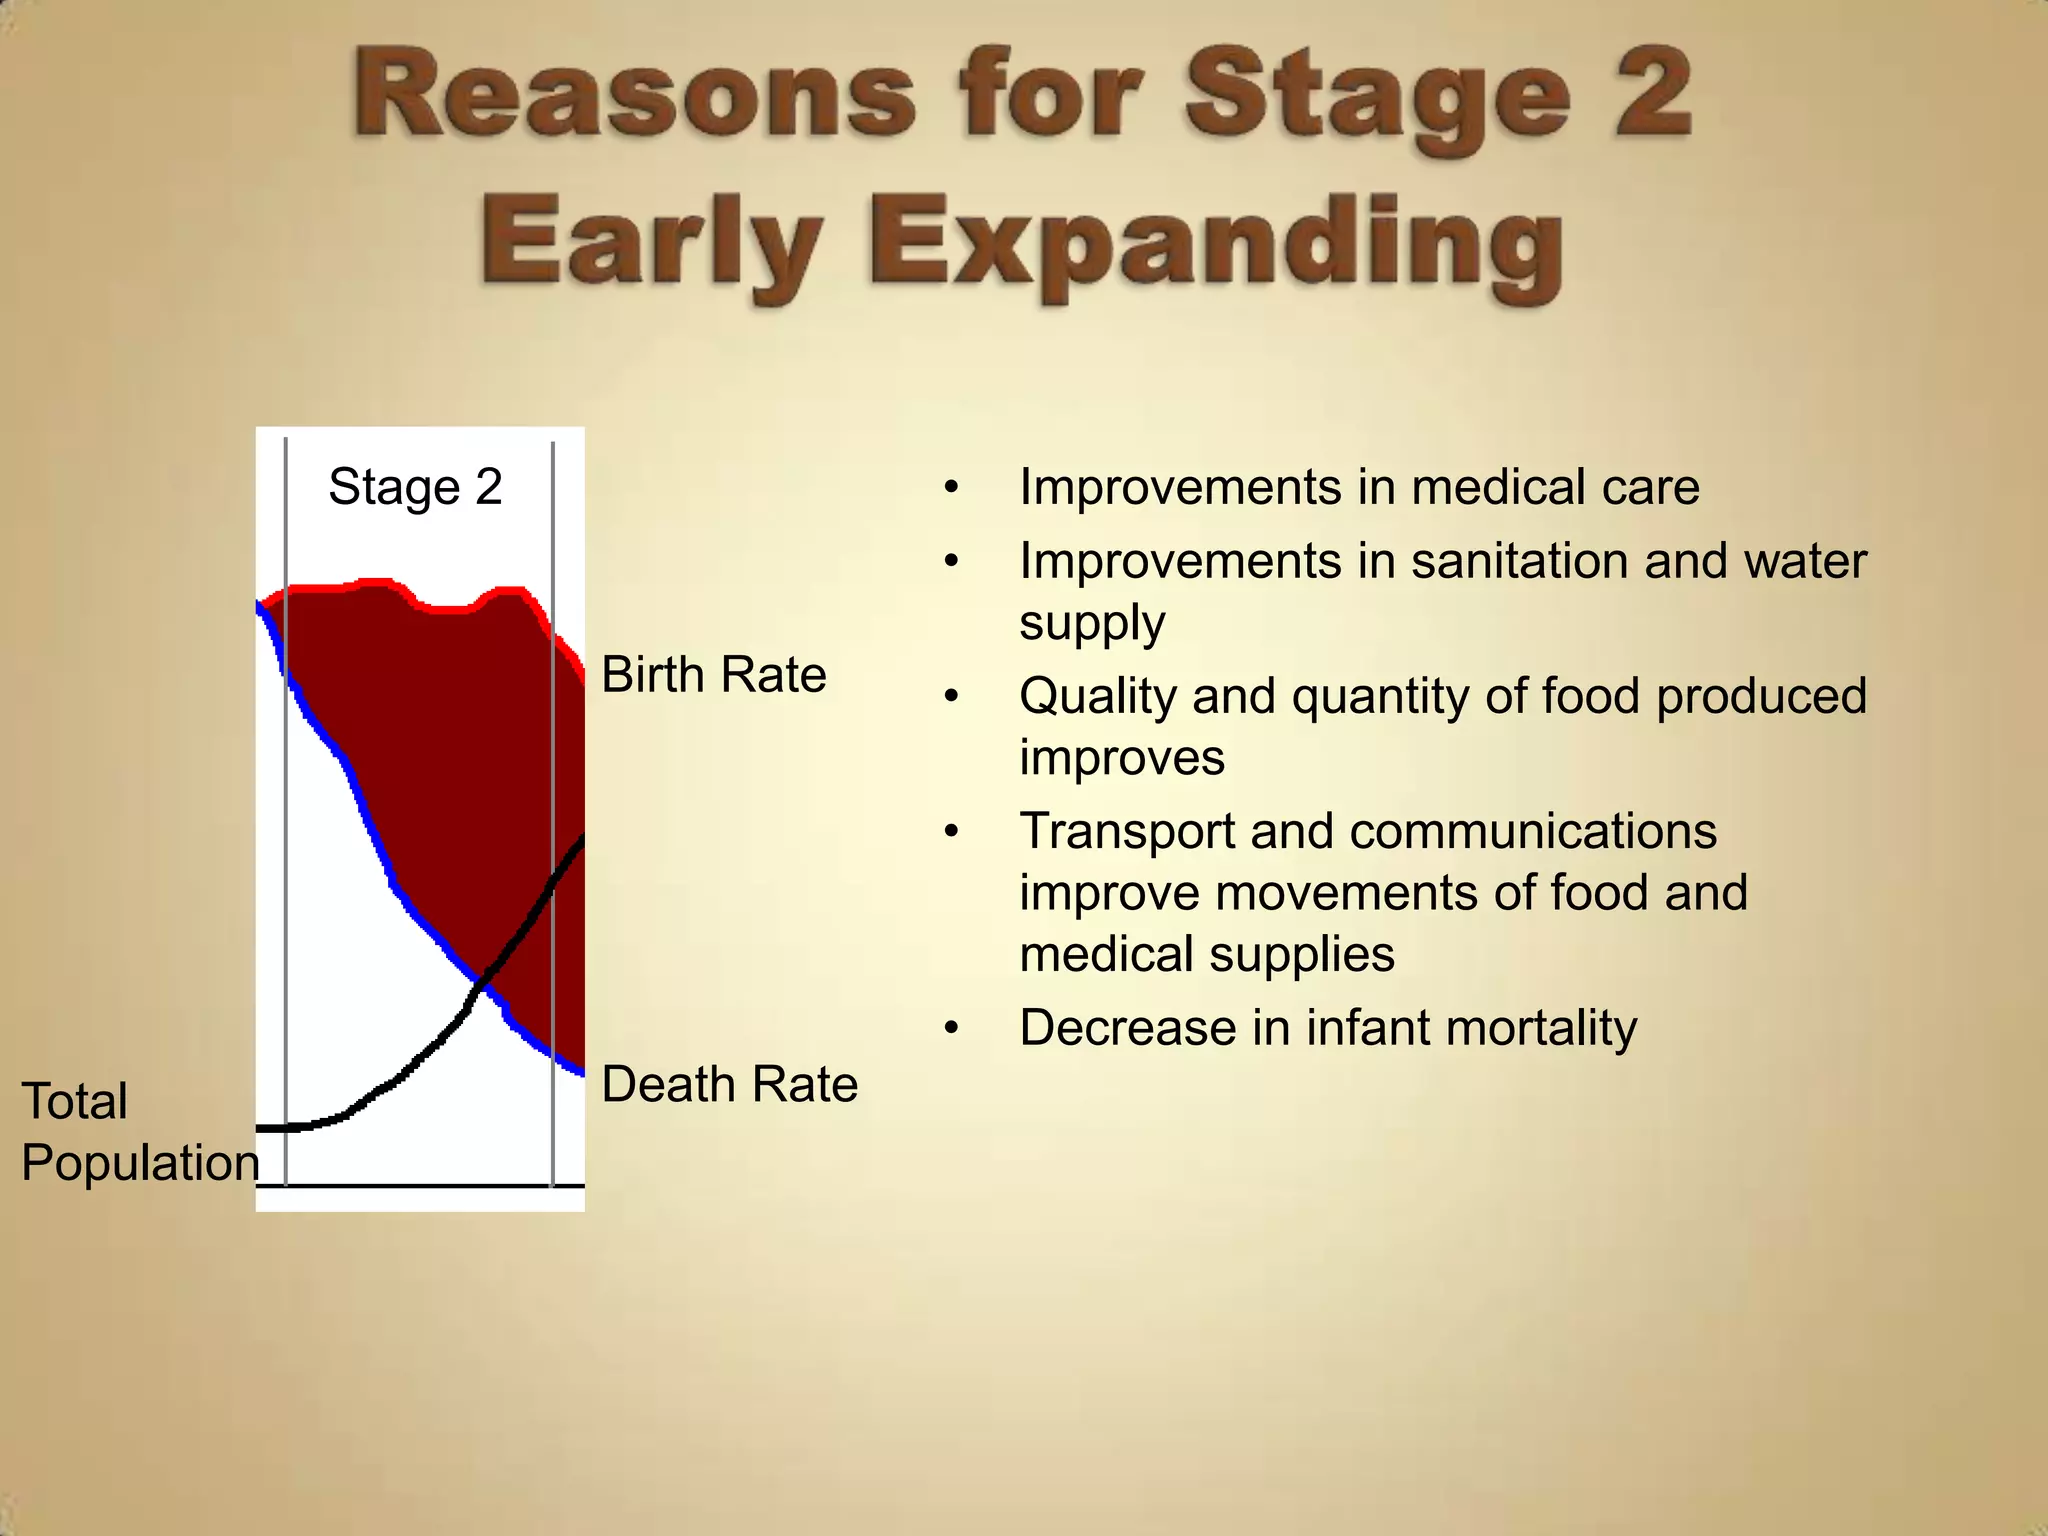
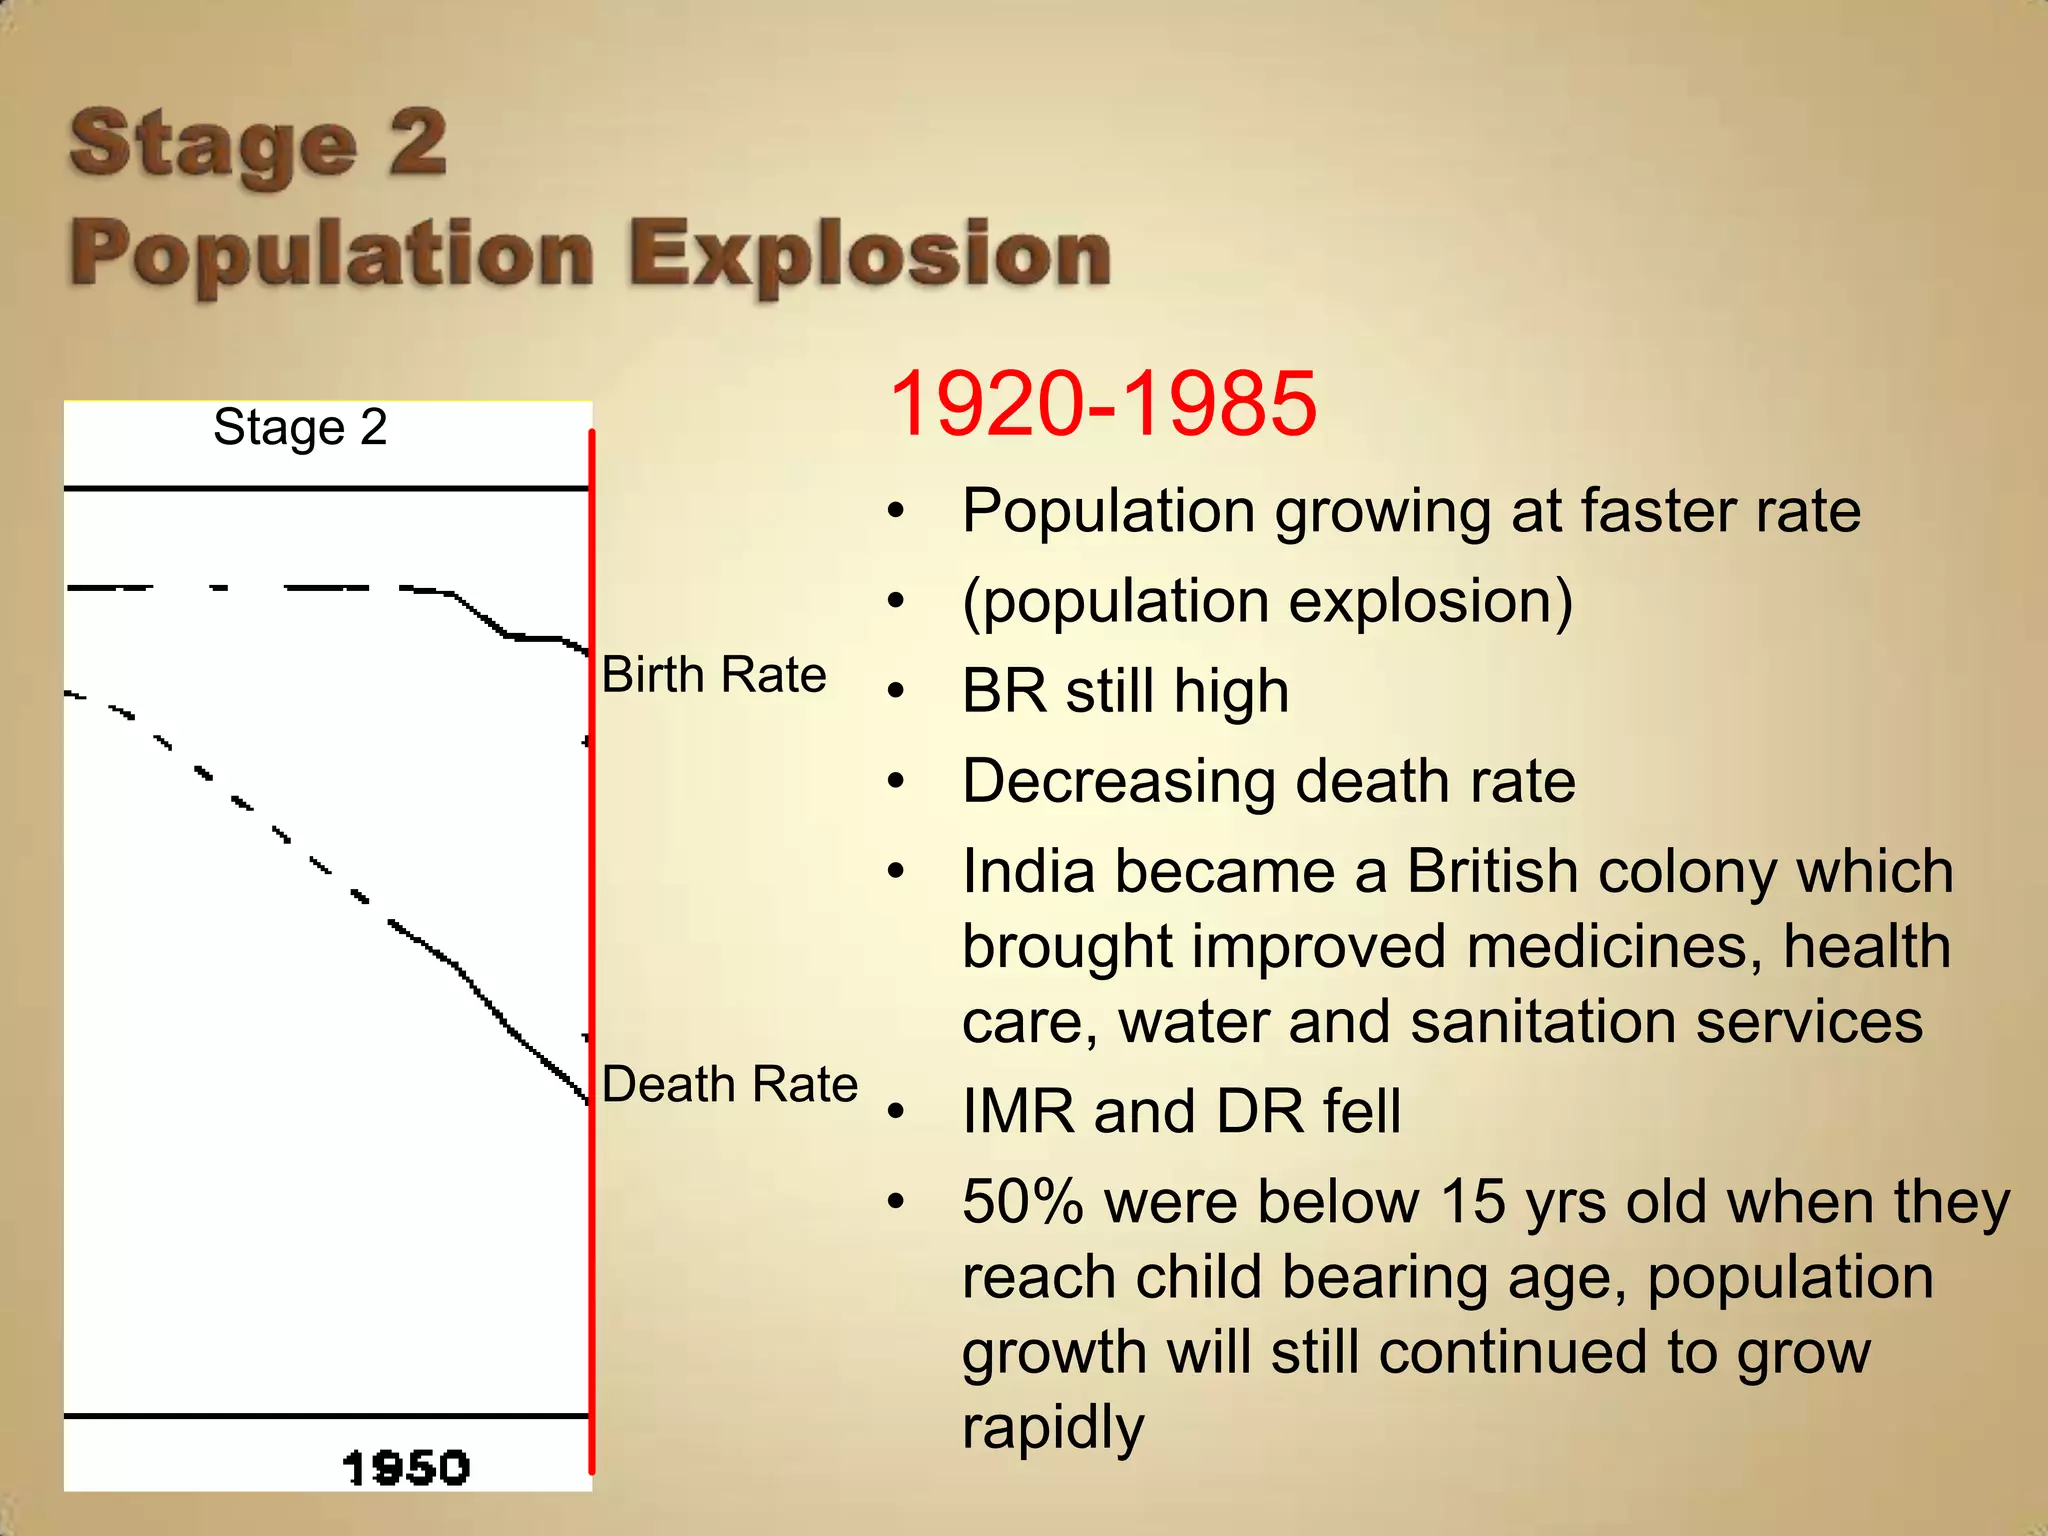
2) Declining death rates due to improved healthcare and standards of living lead to population growth.
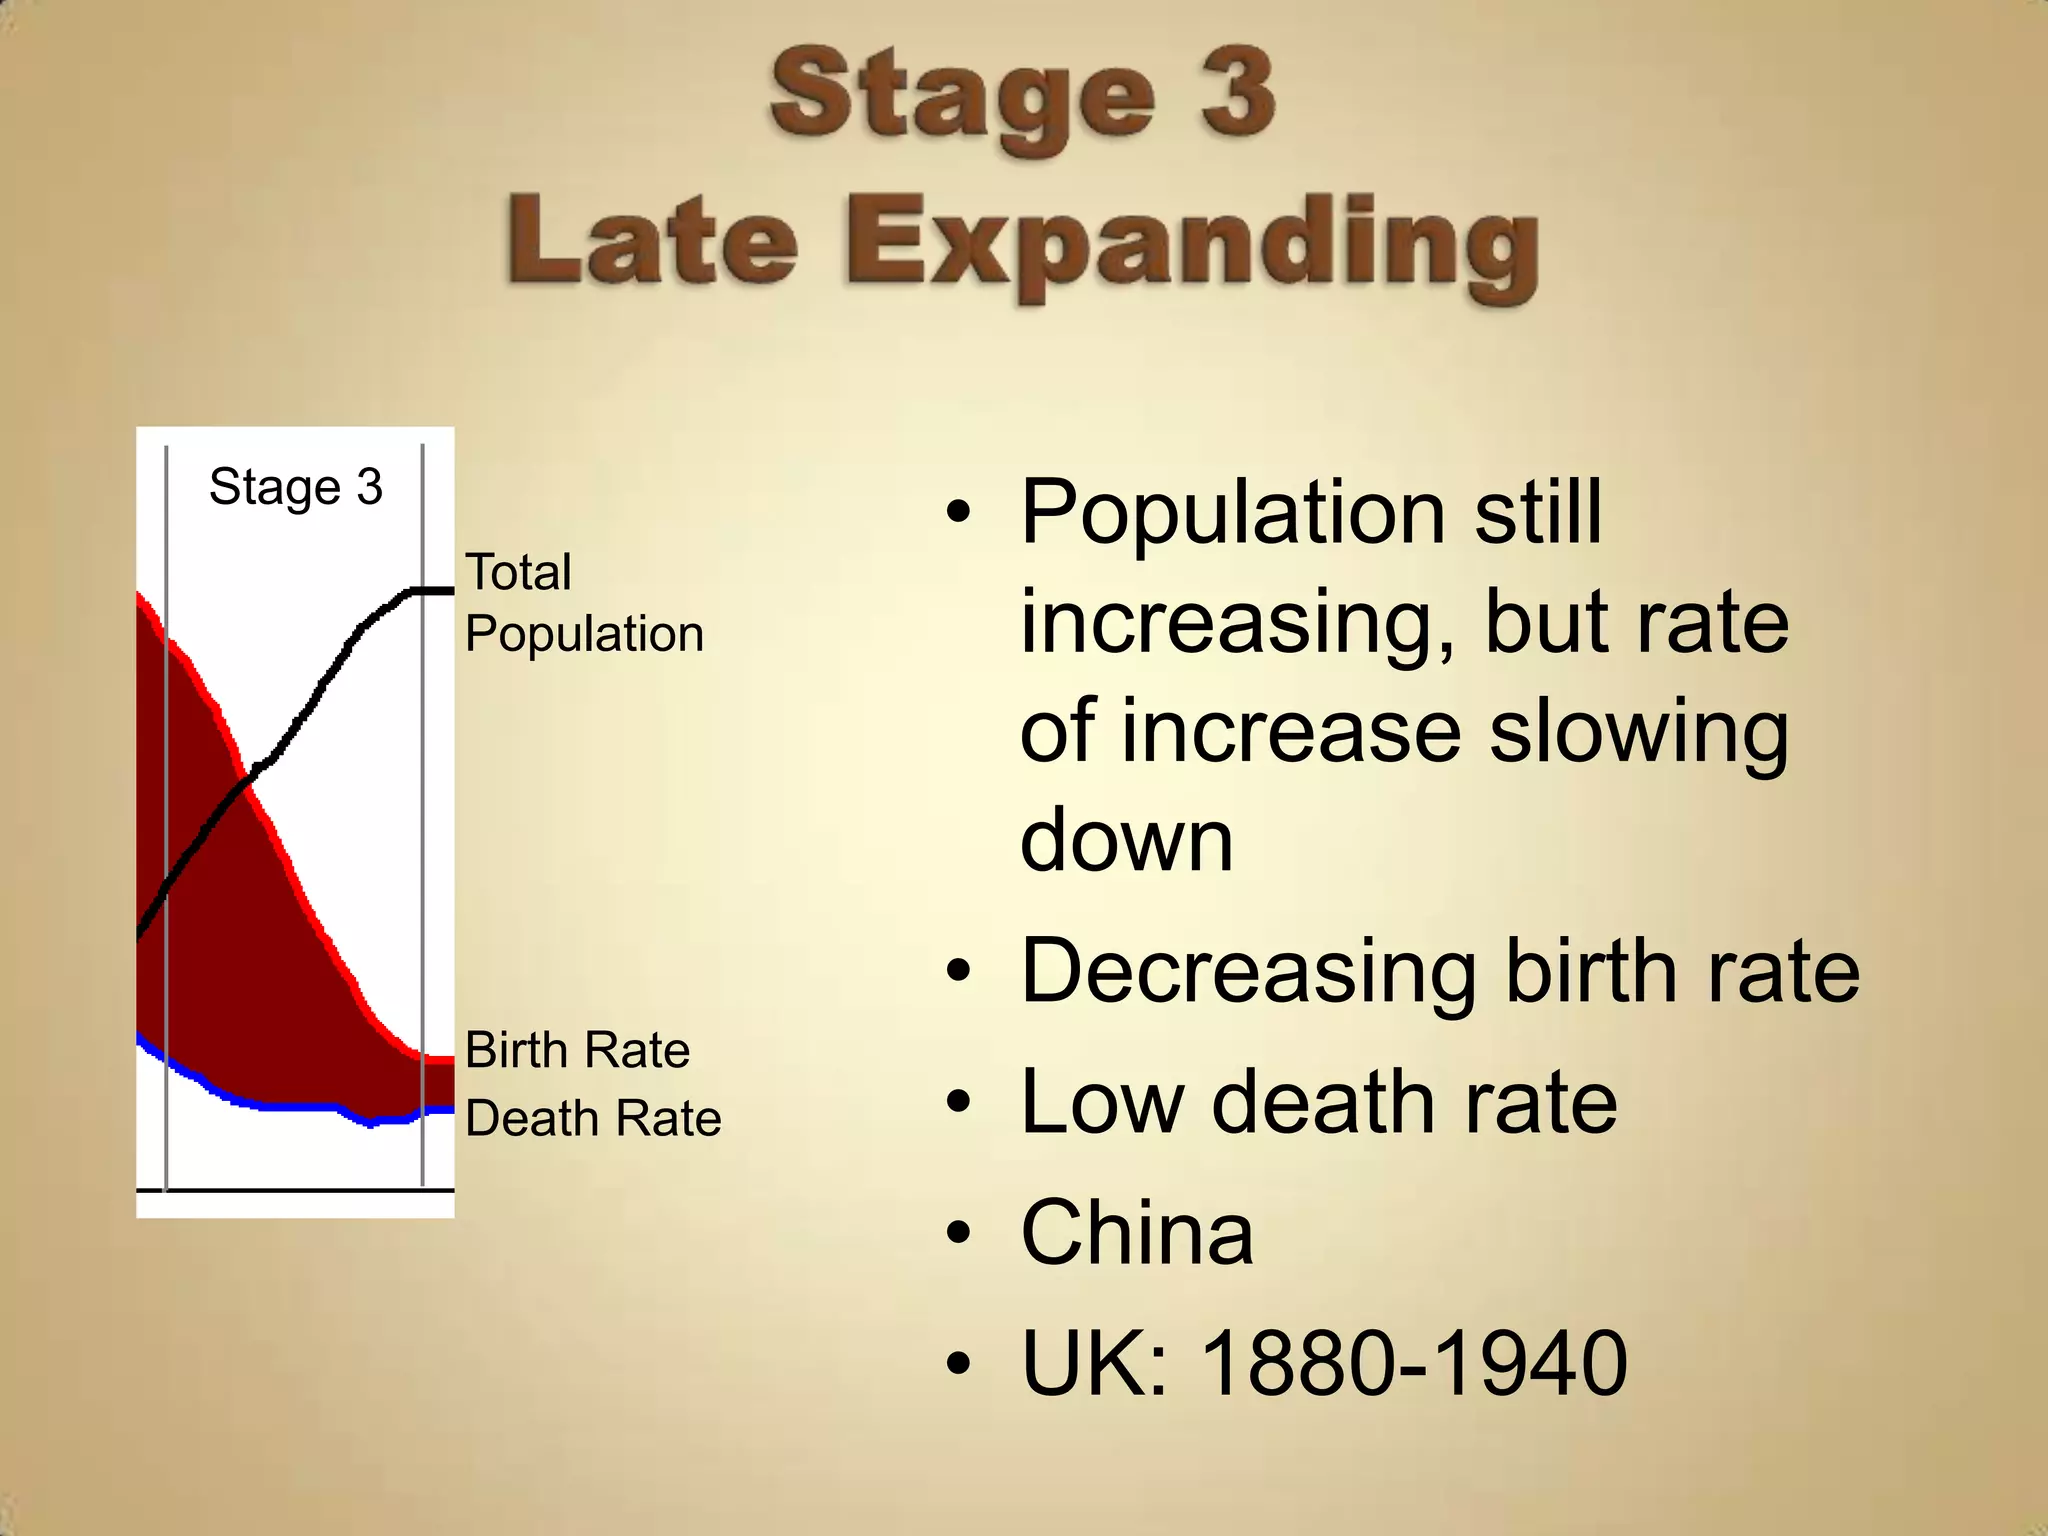
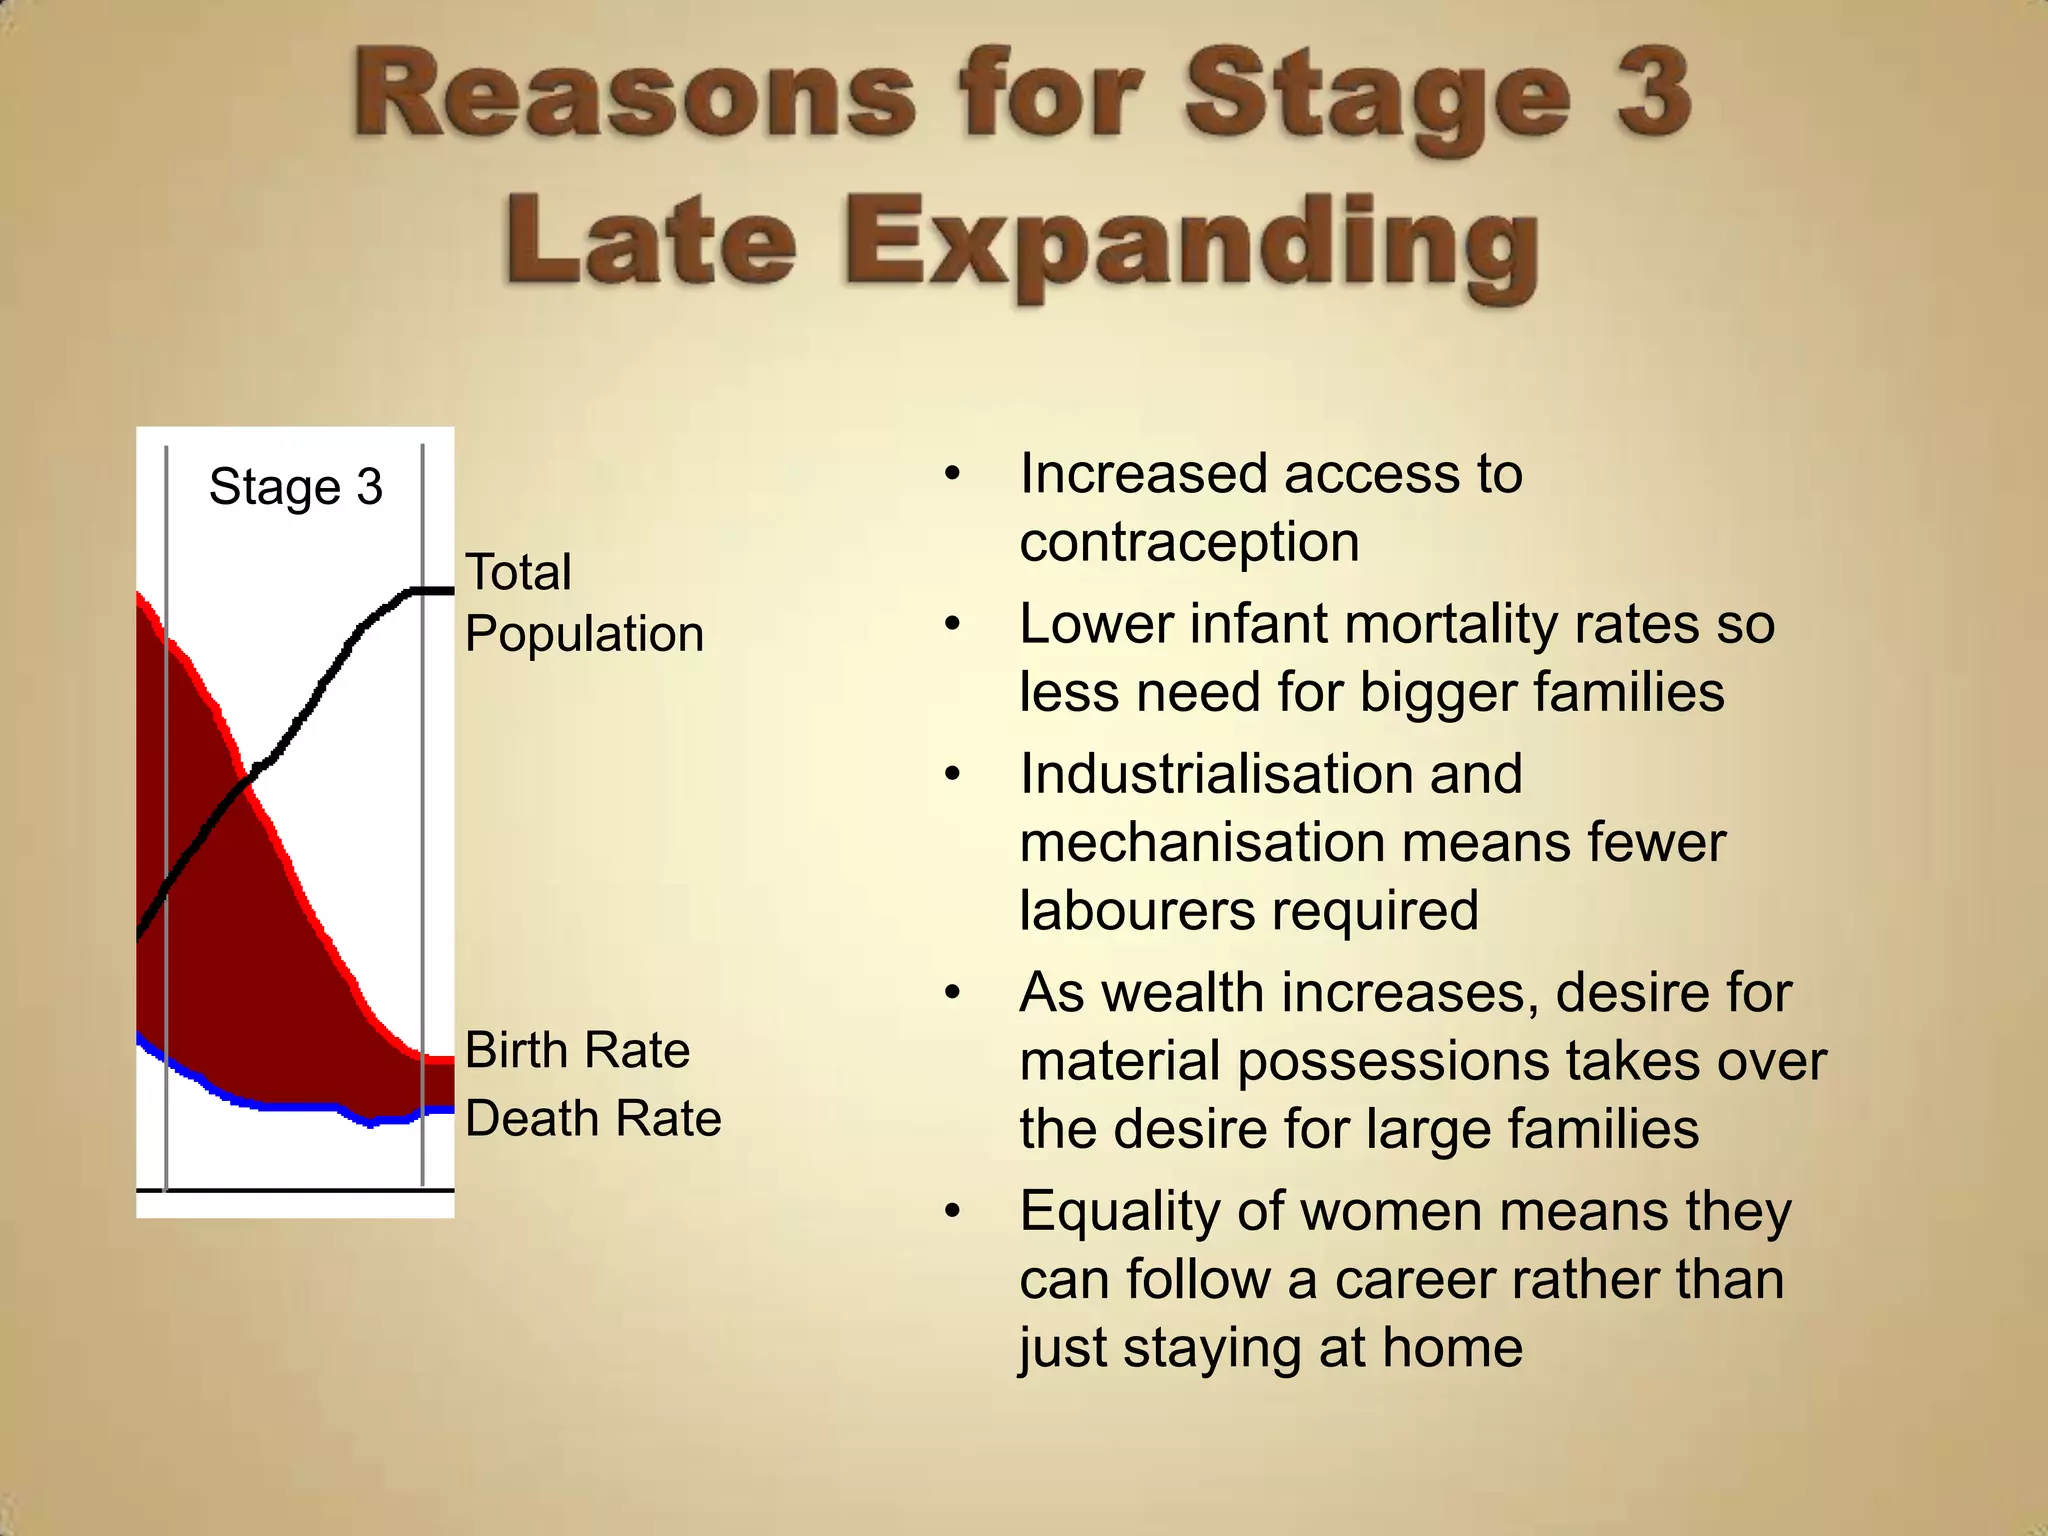
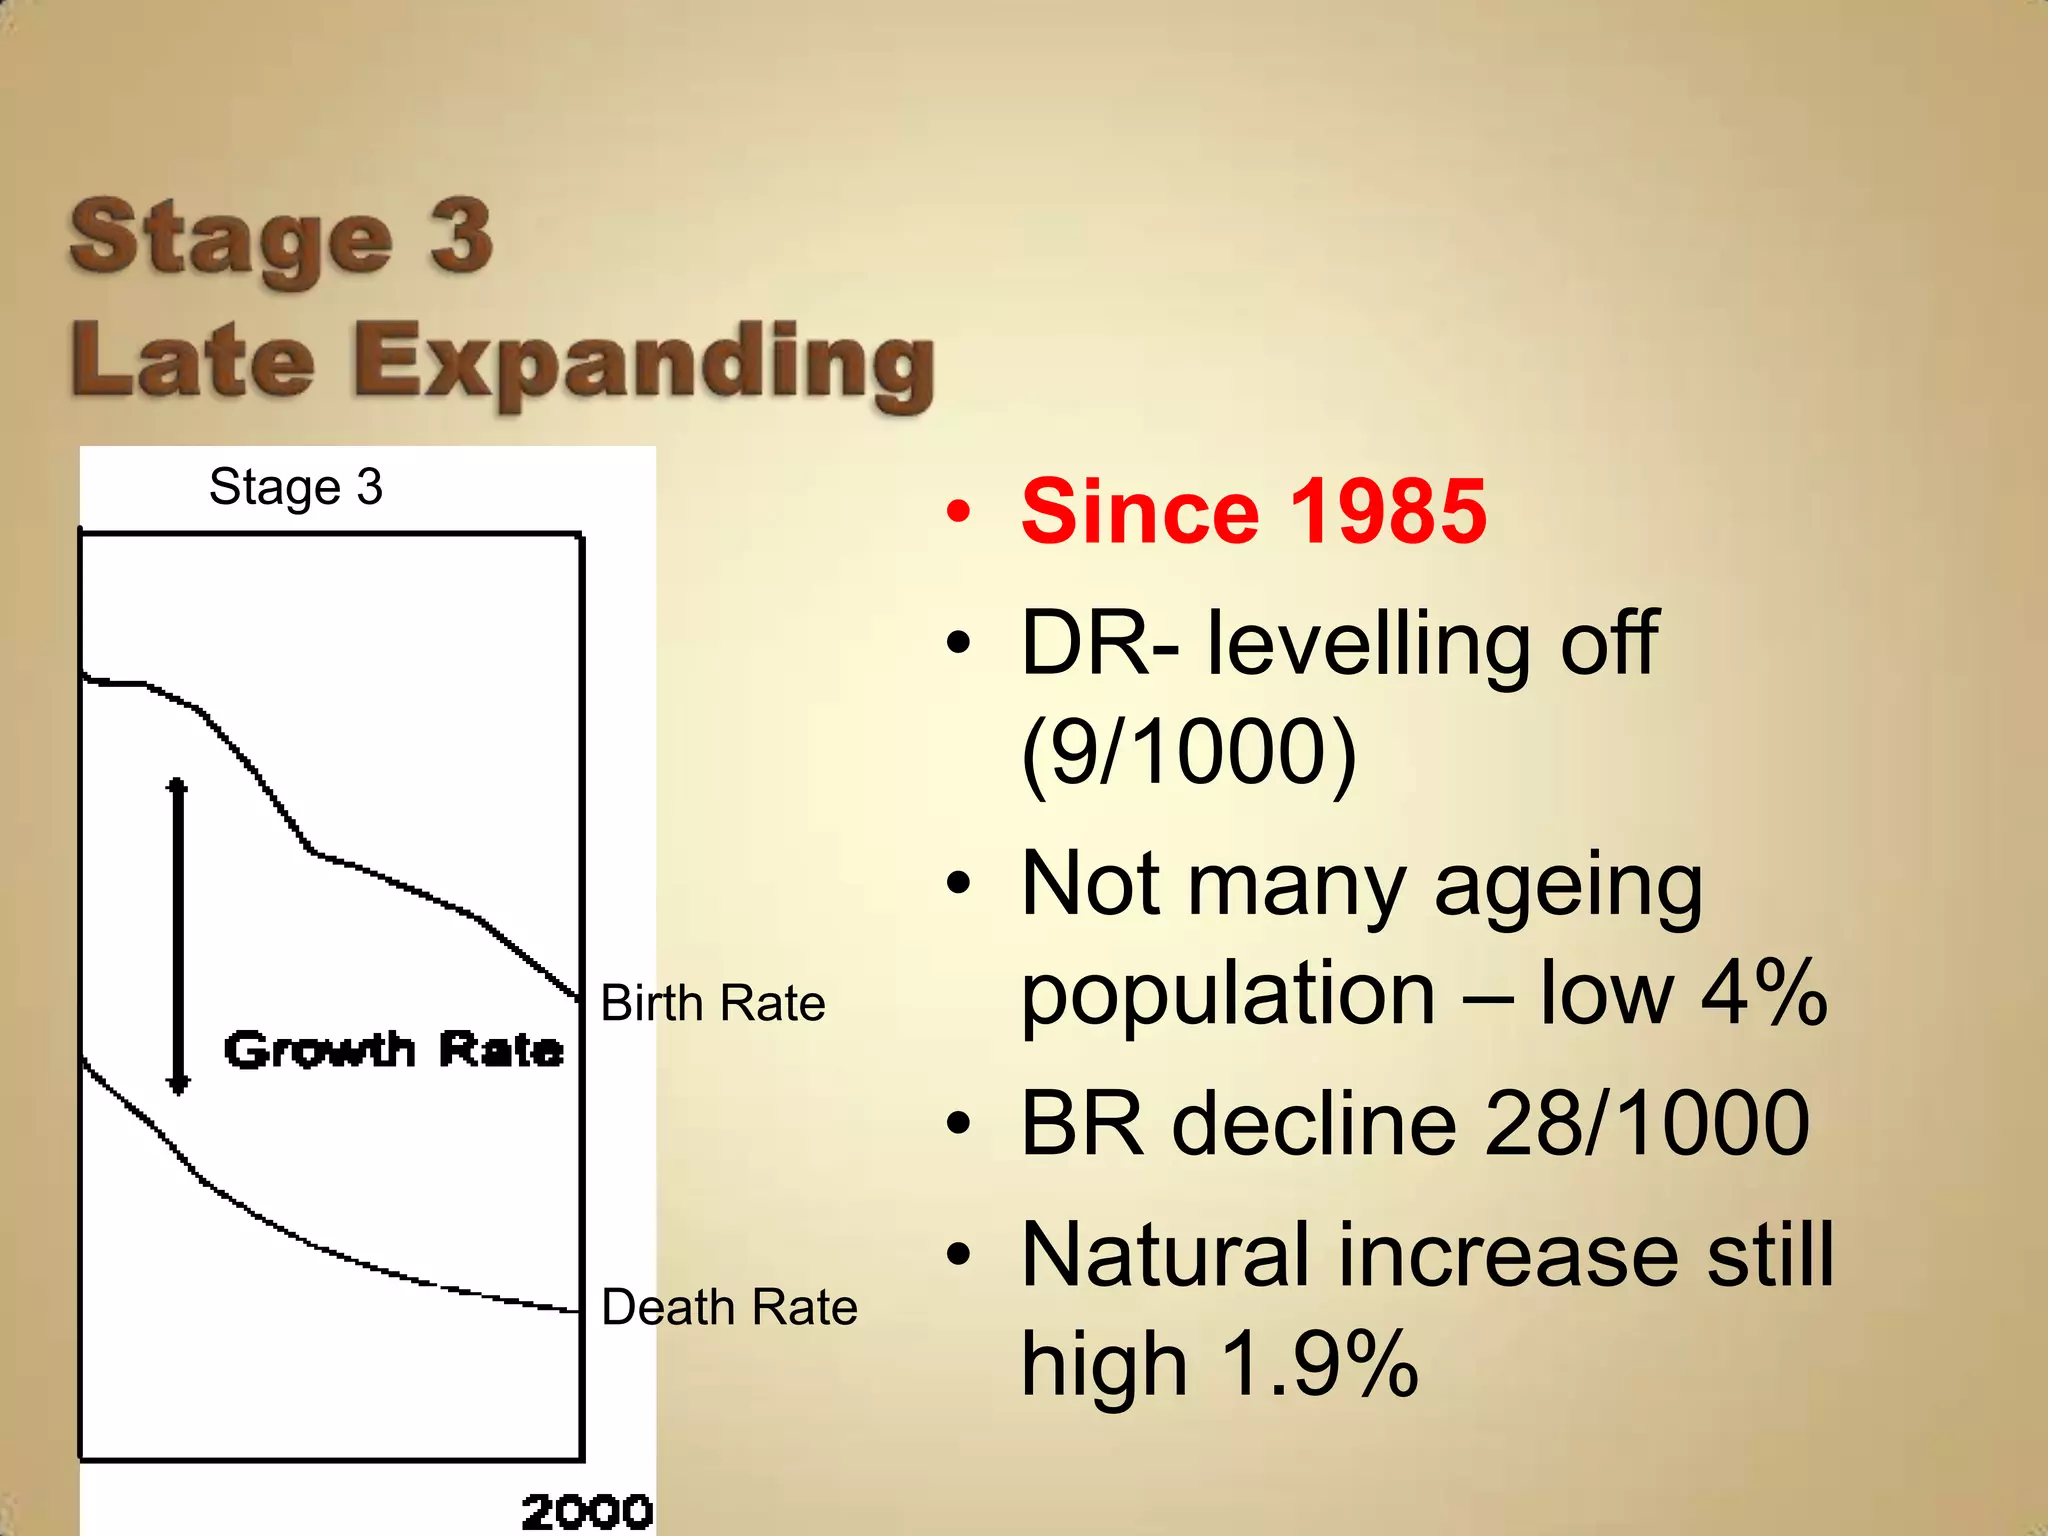
3) Falling birth rates as women's roles change and families desire fewer children.
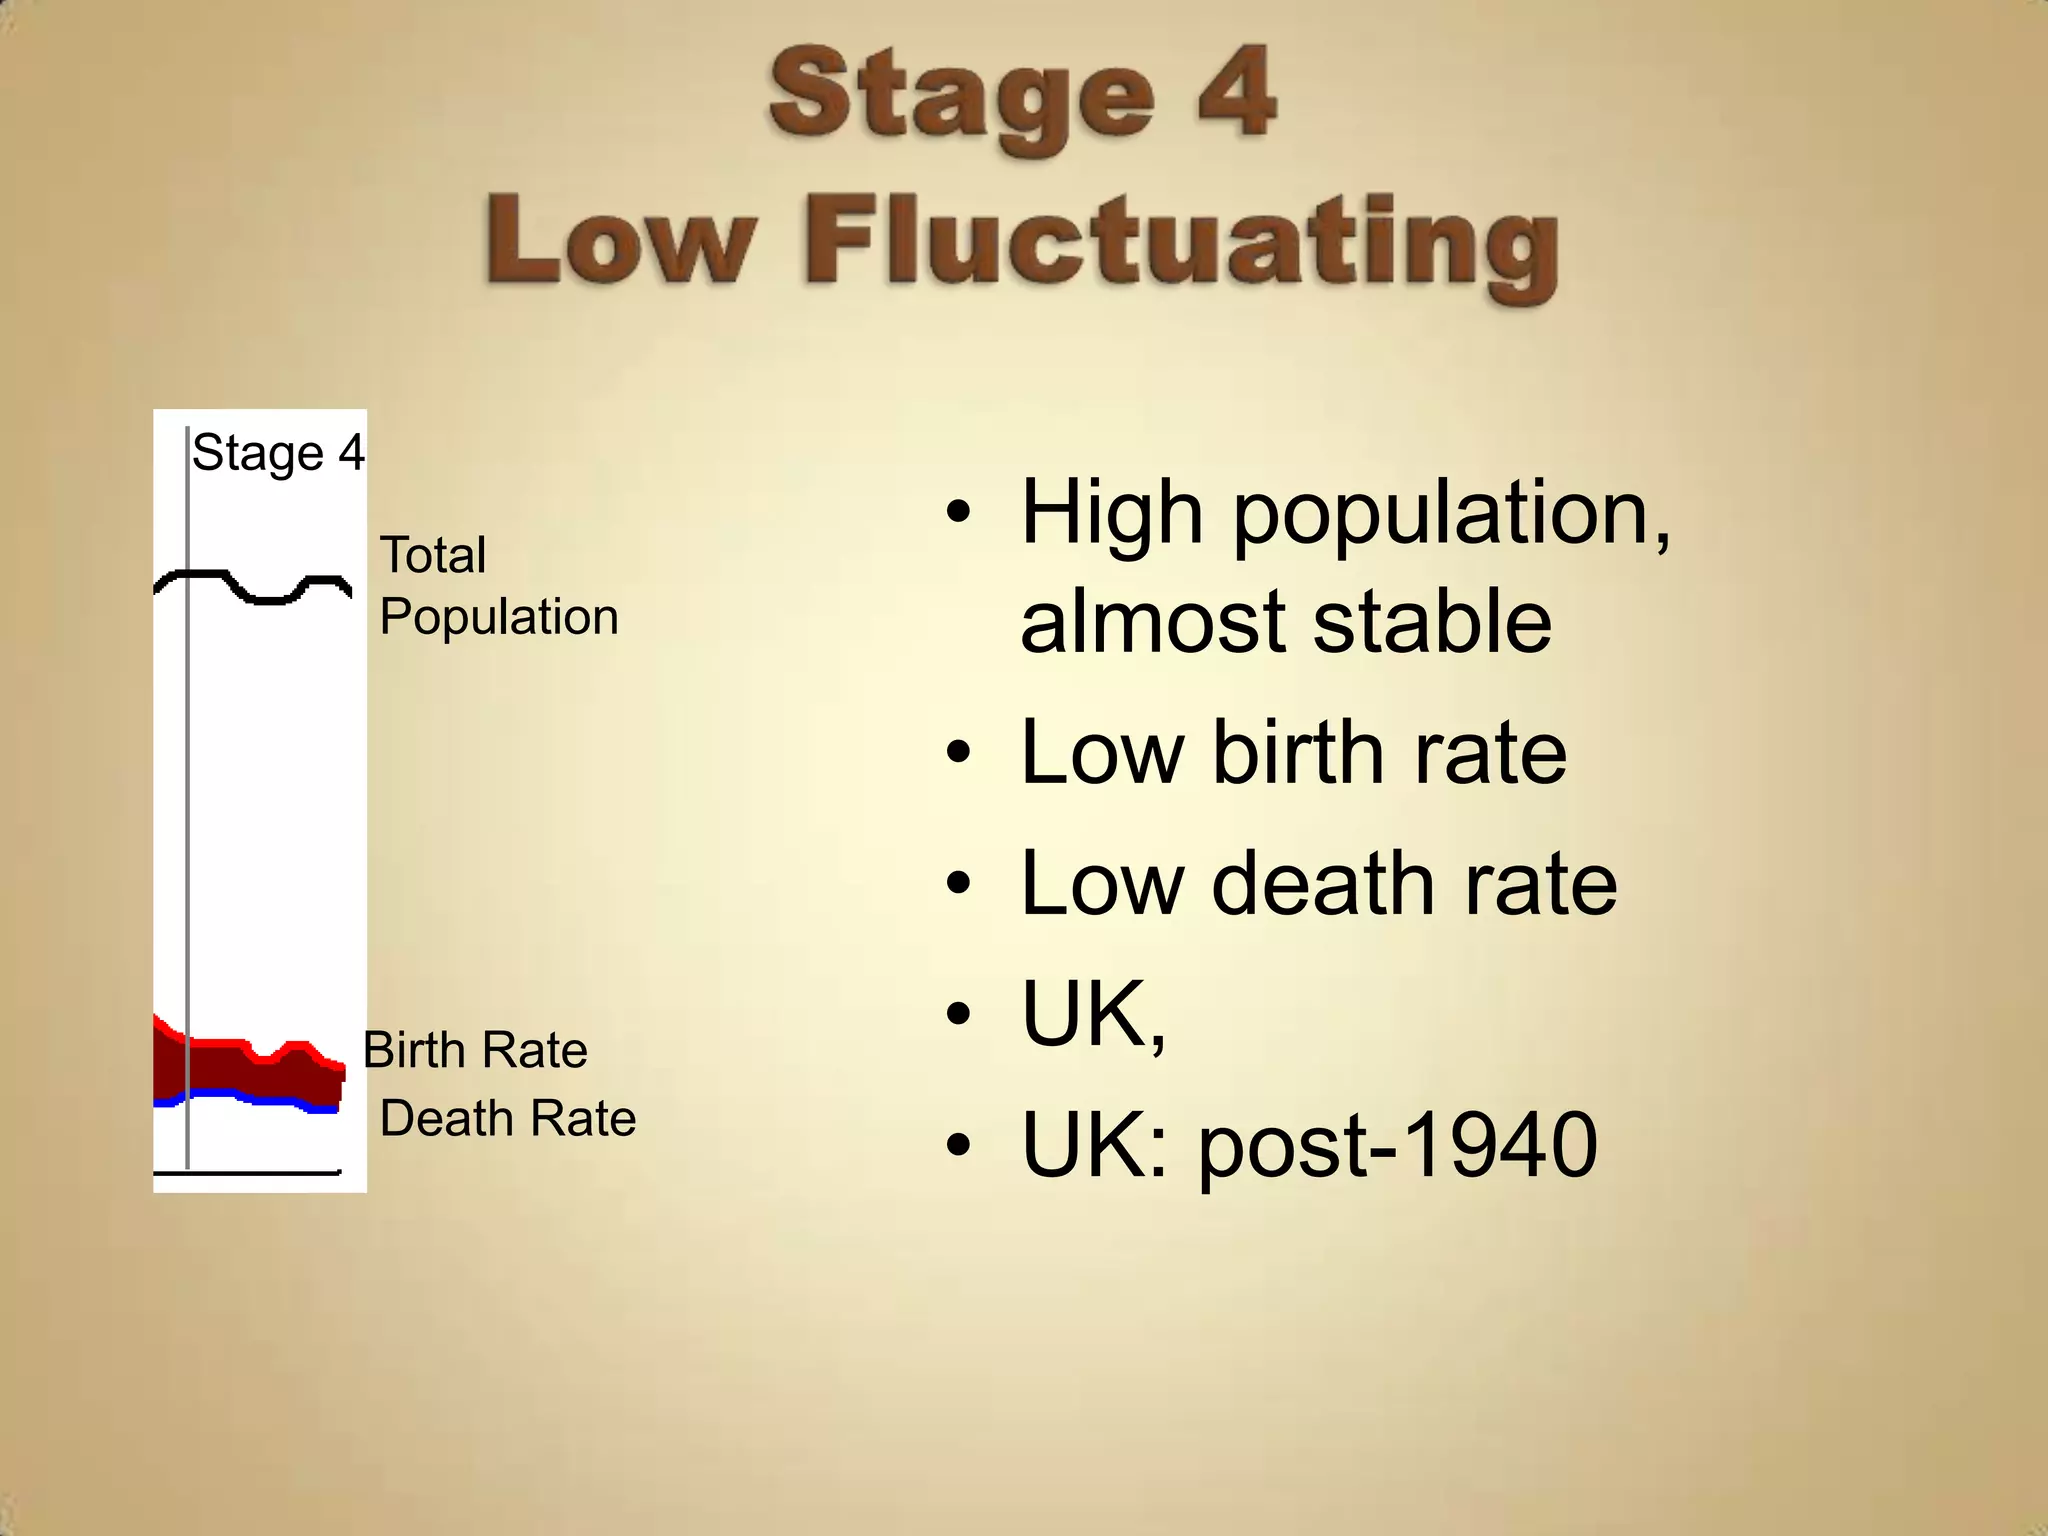
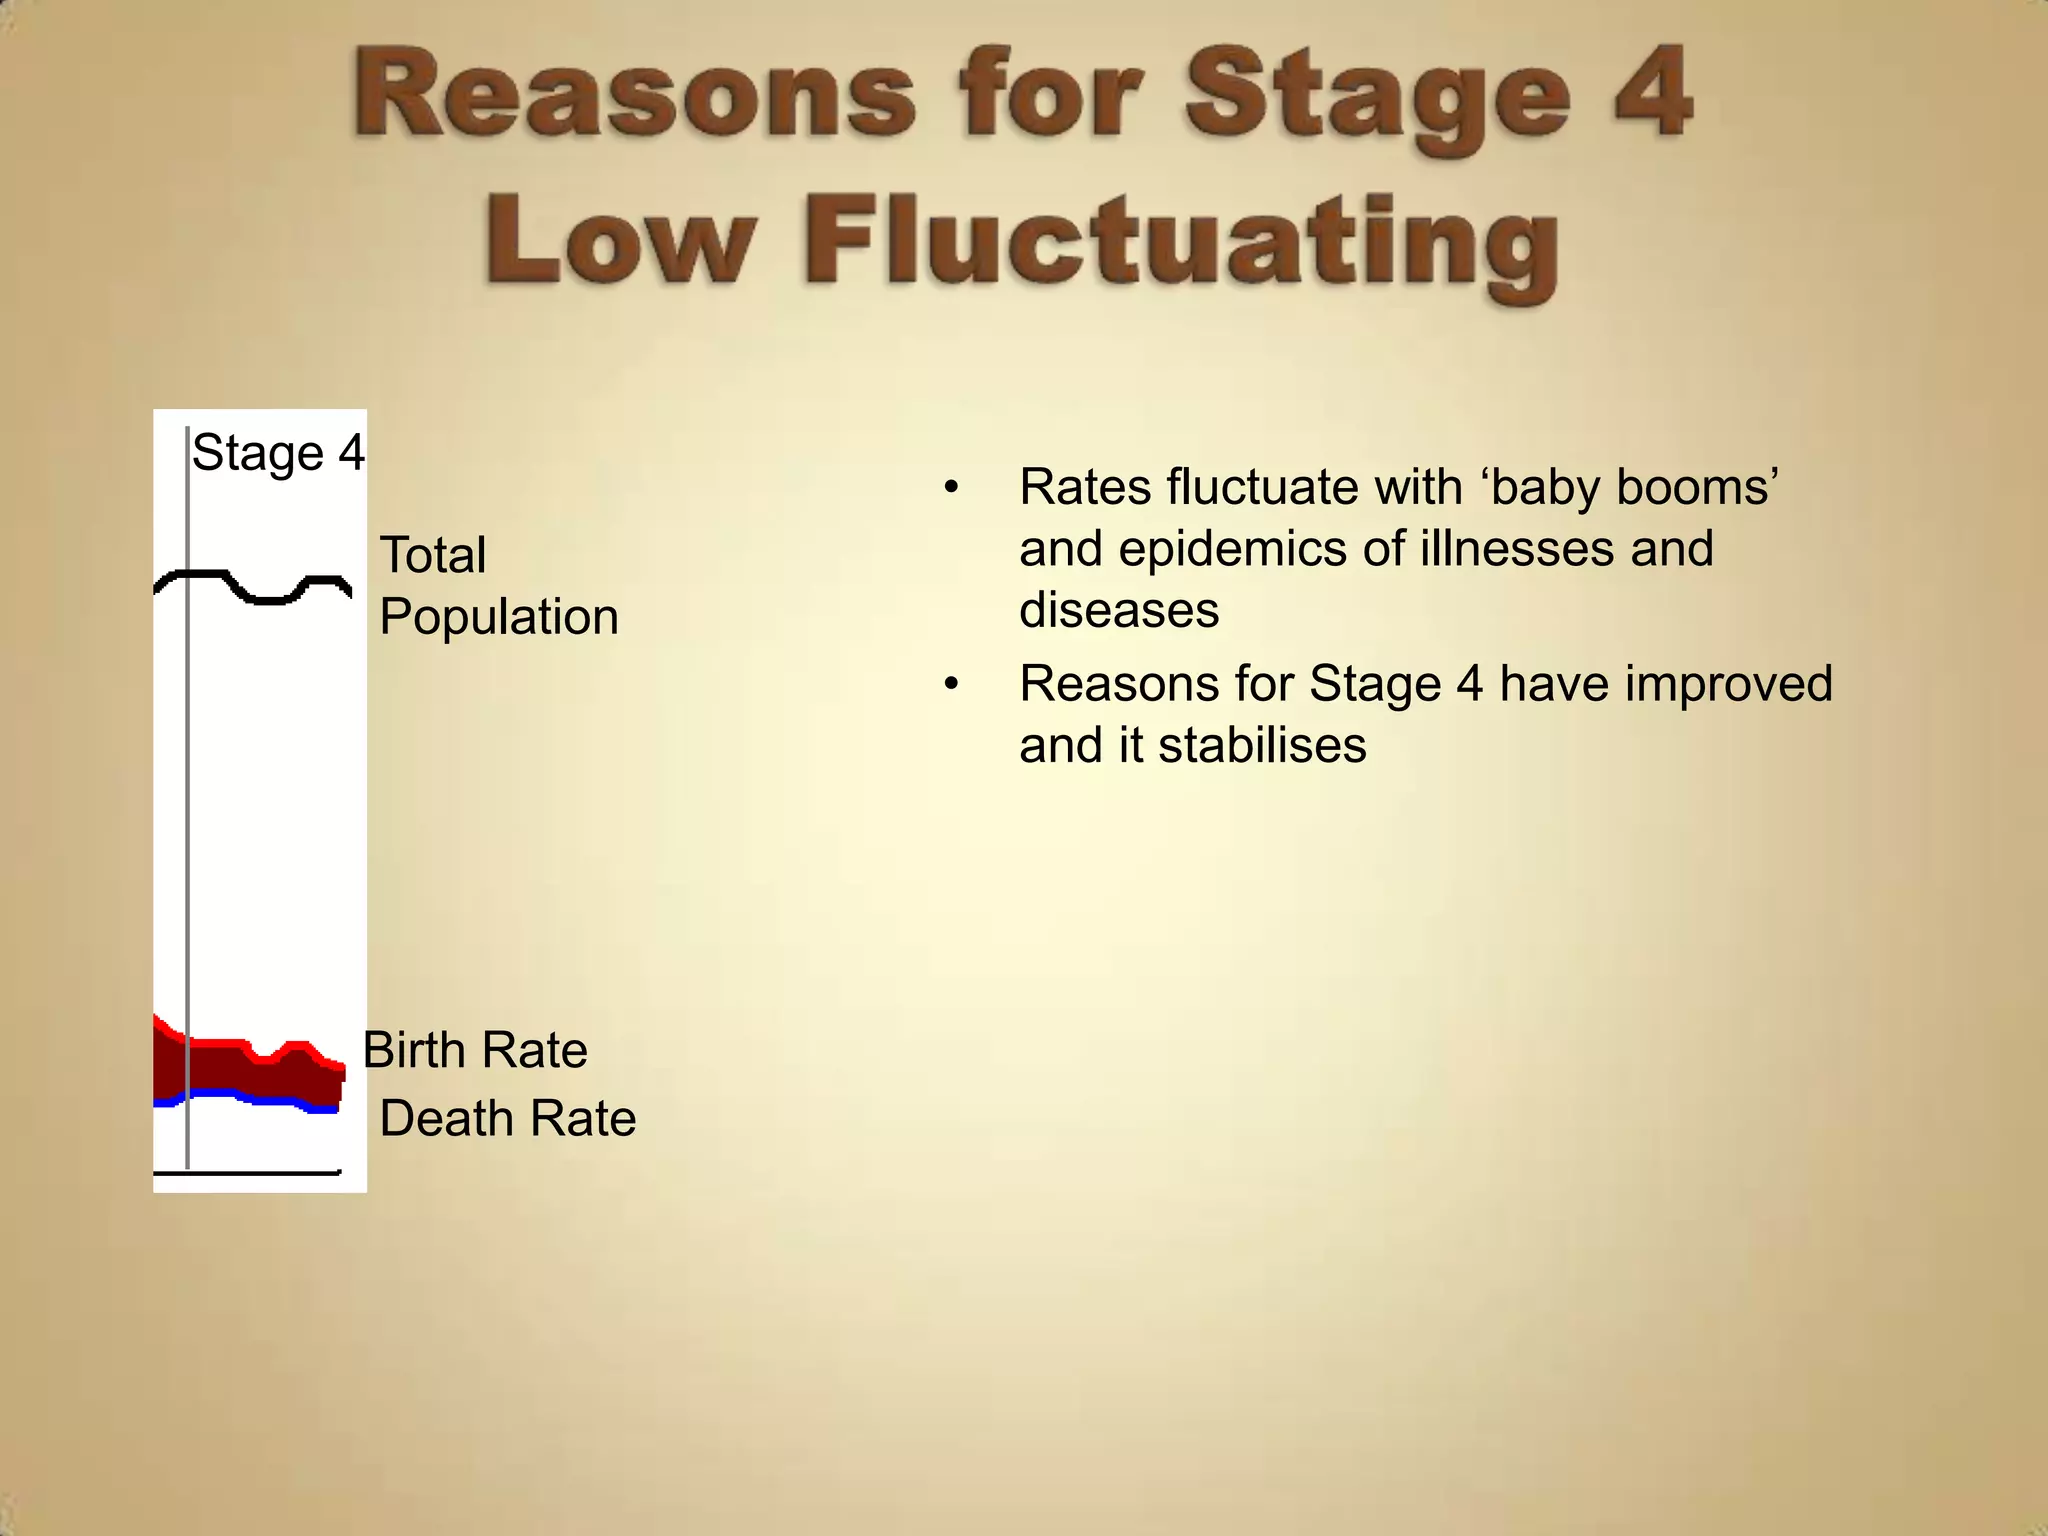
4) Low birth and death rates as populations stabilize.
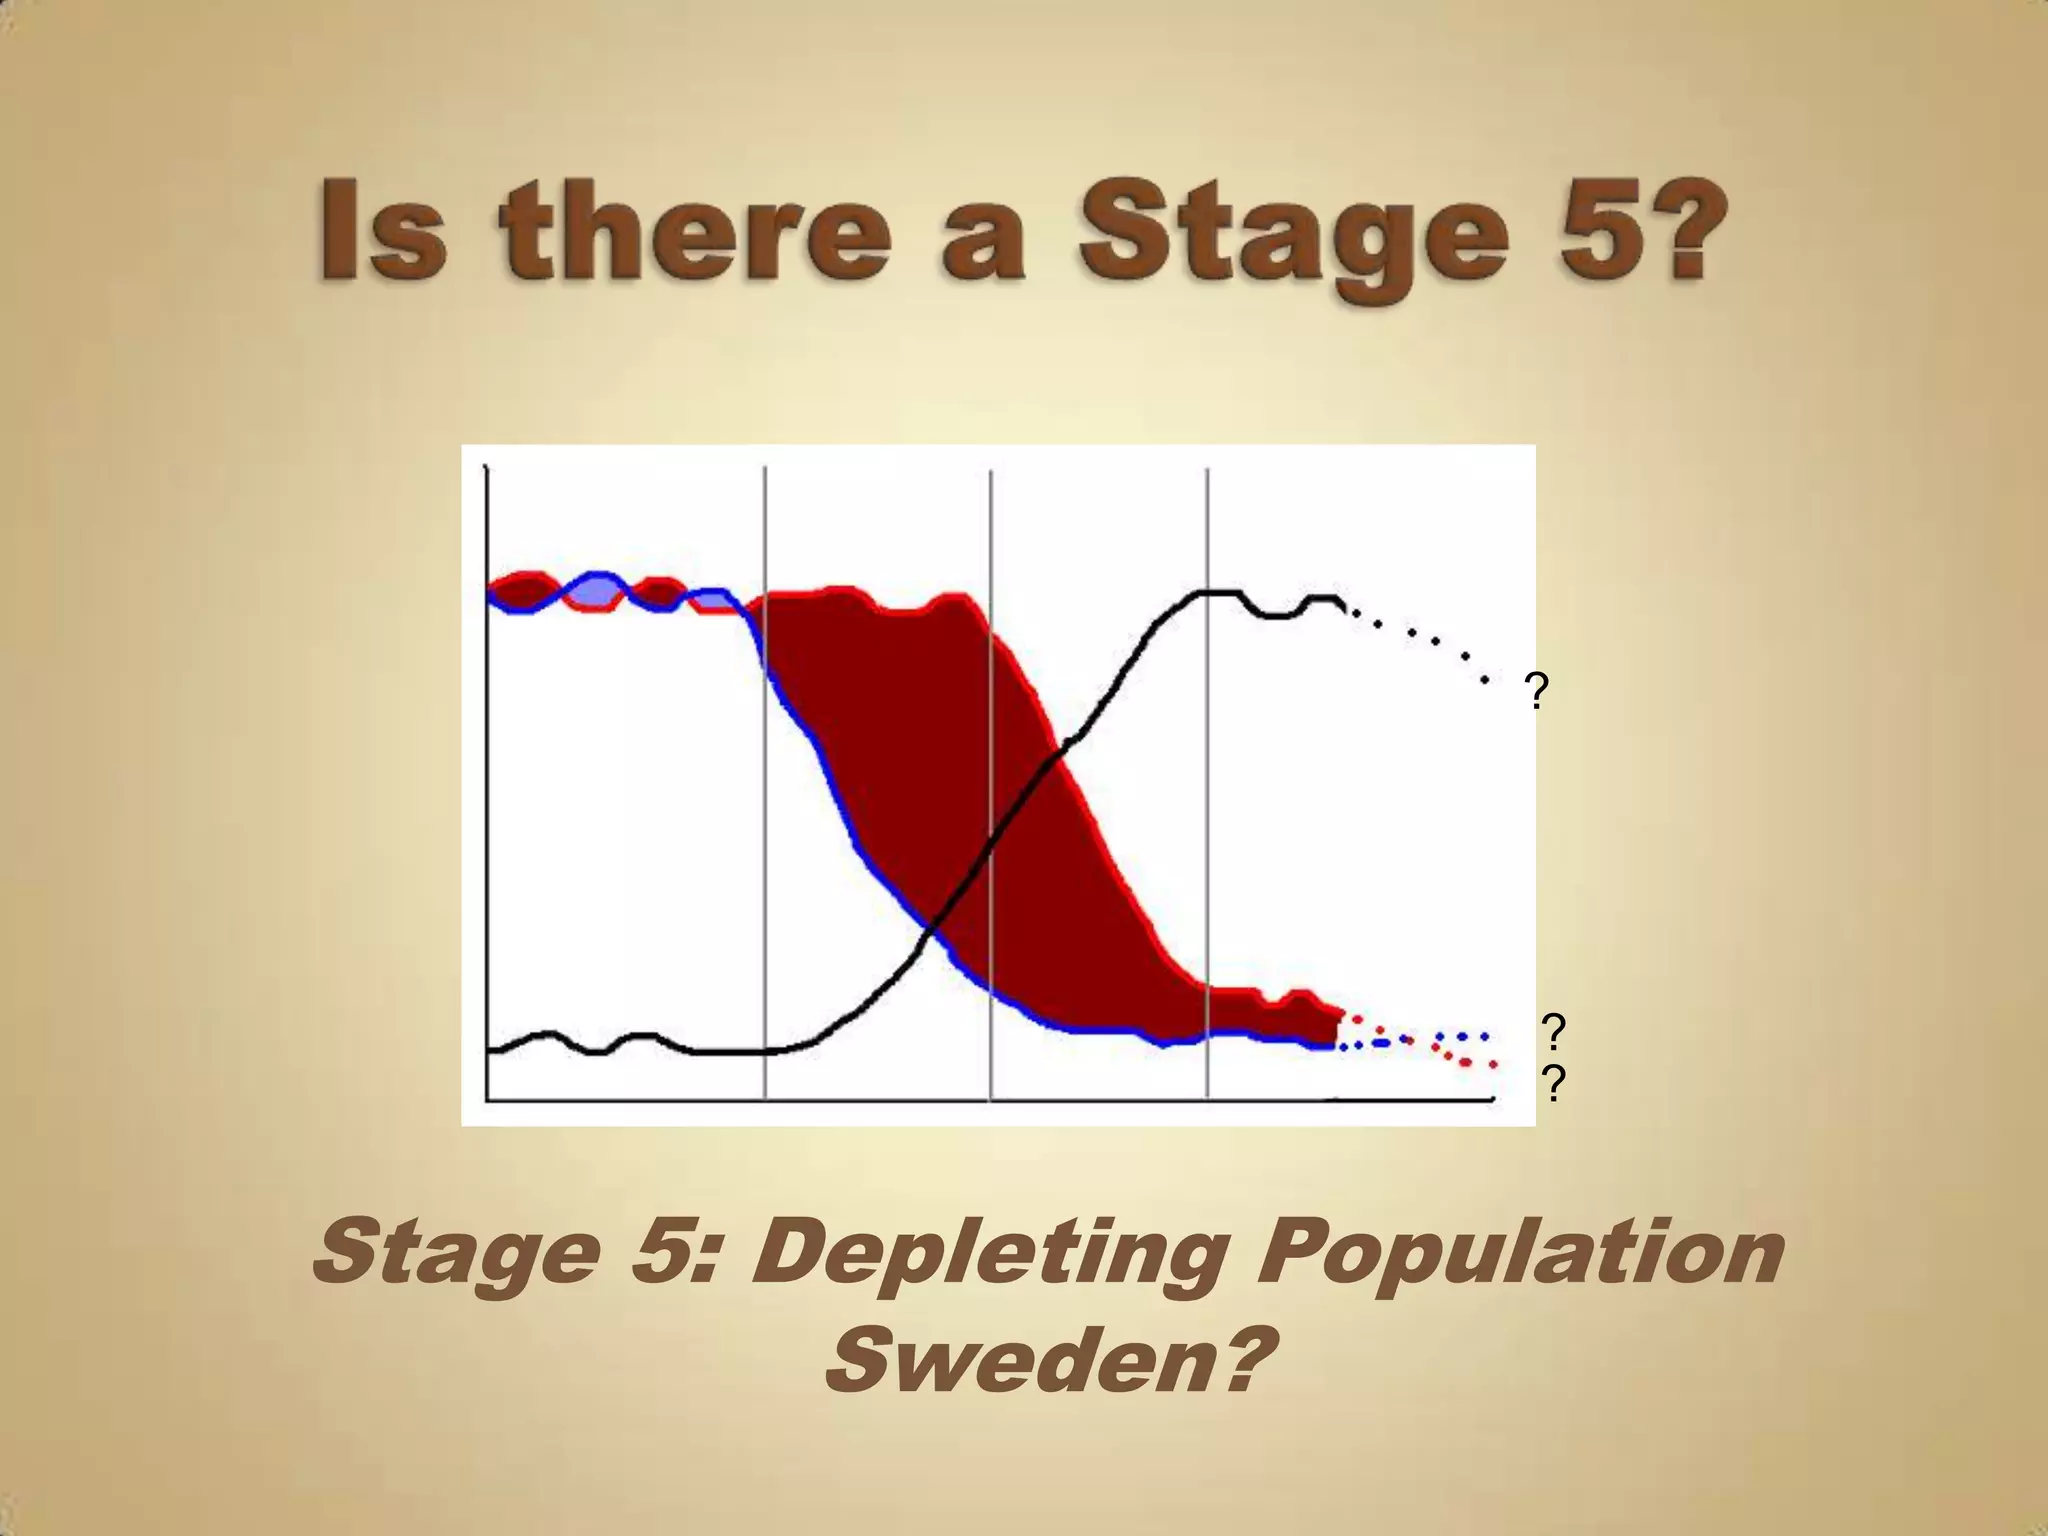
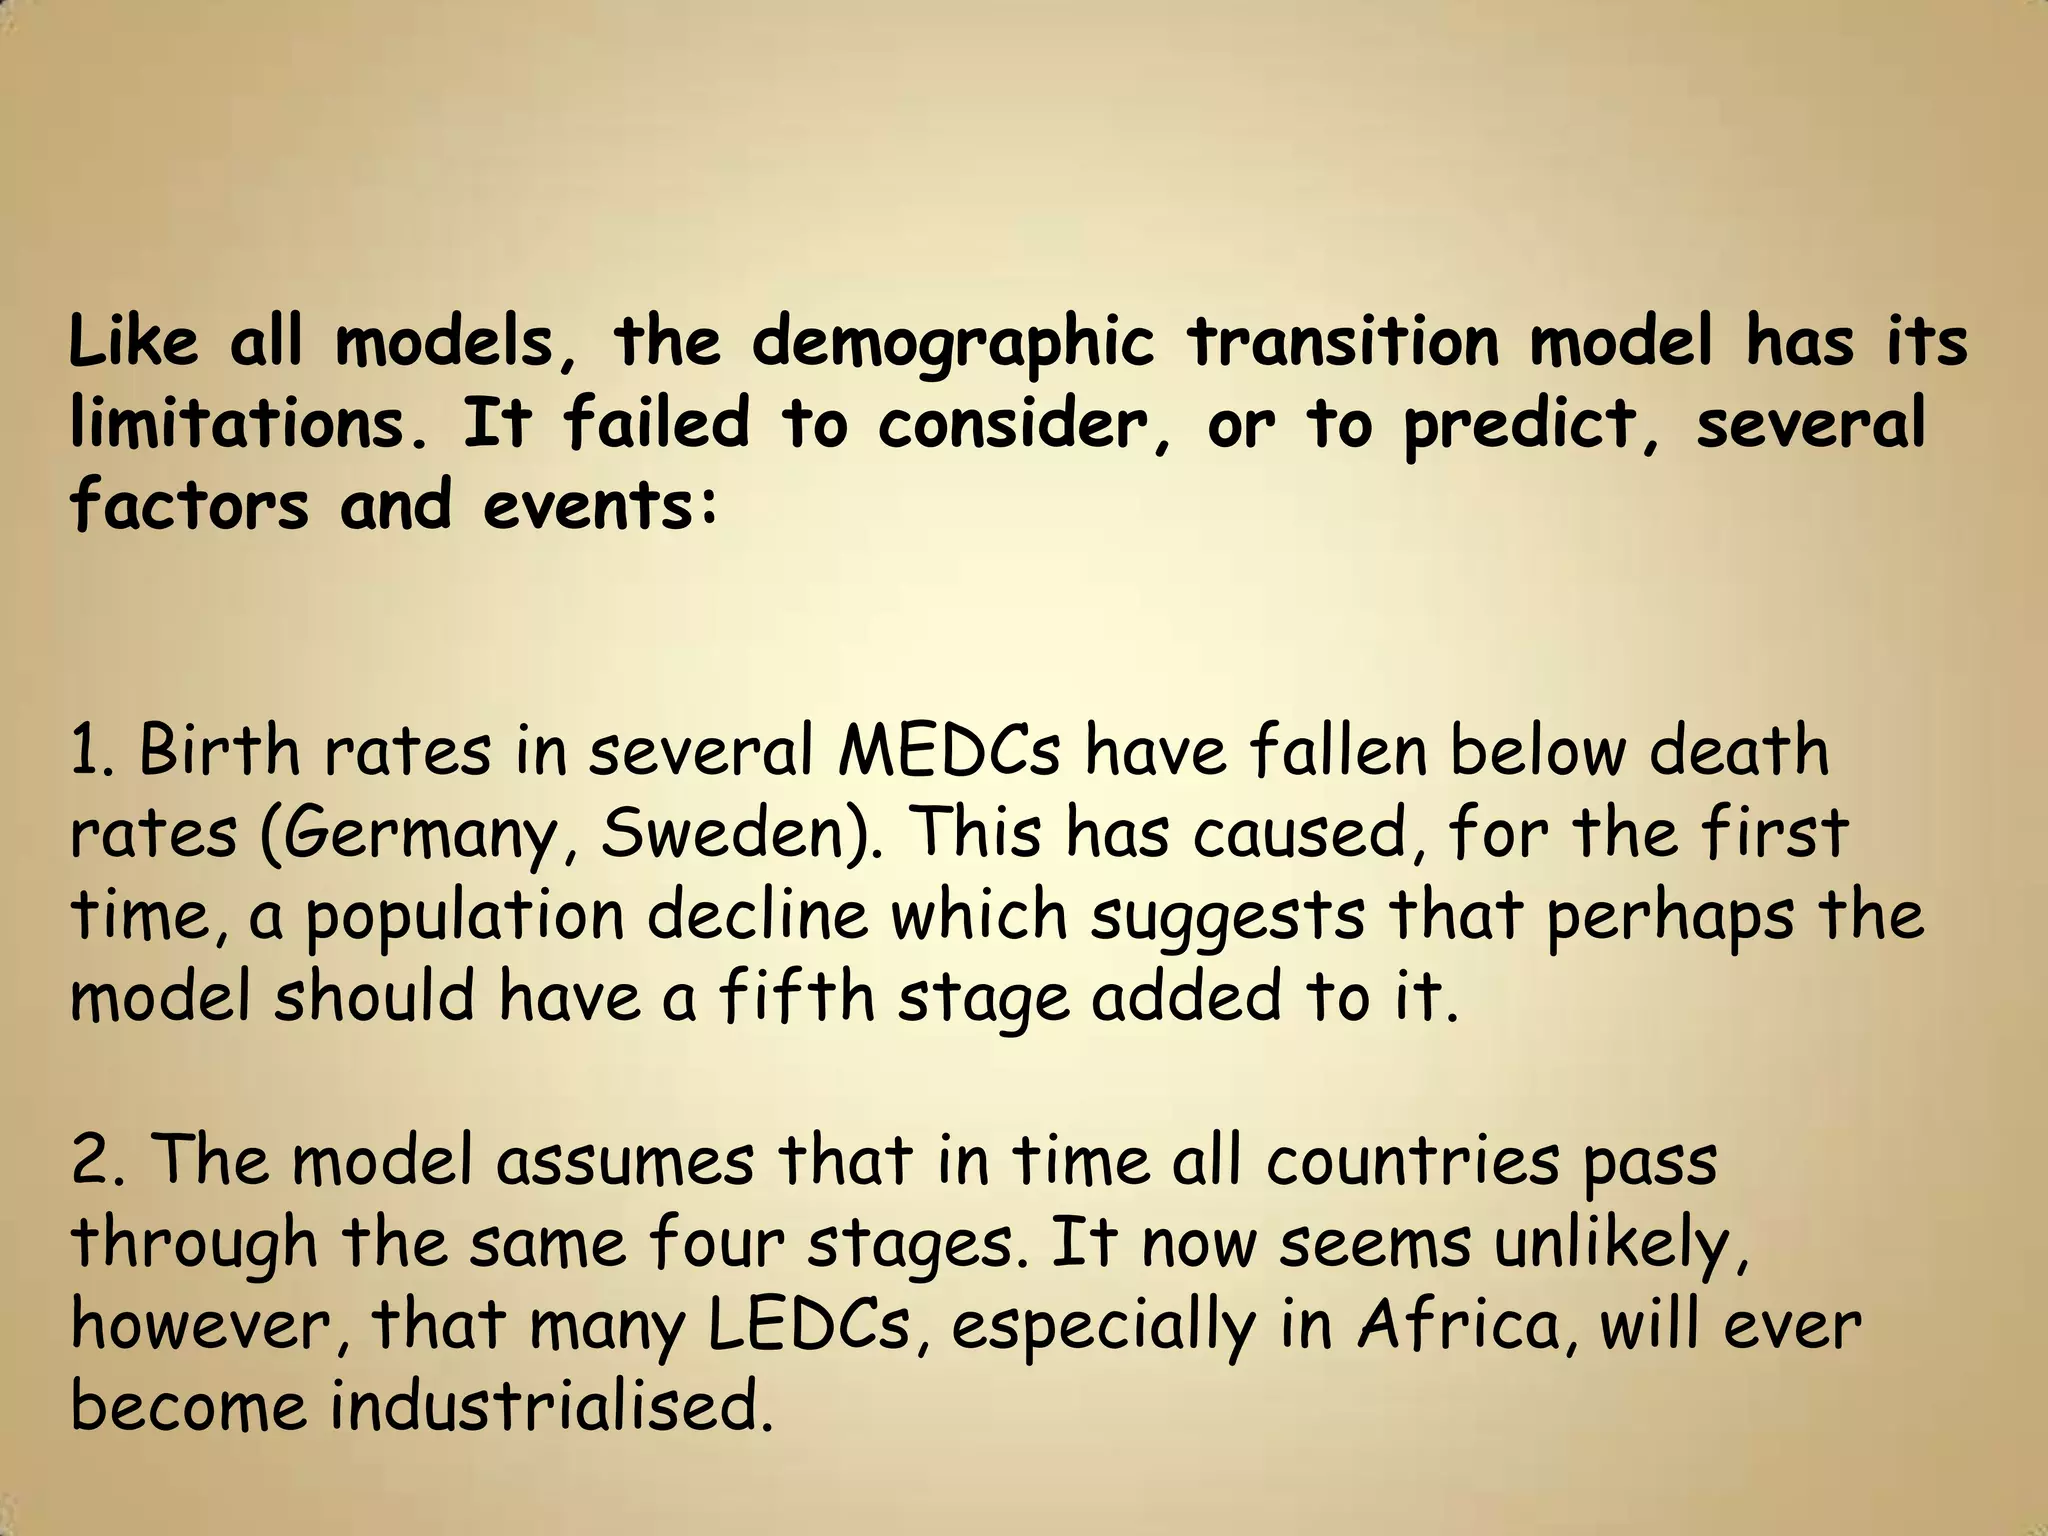
5) Potential population decline if birth rates fall below replacement levels.
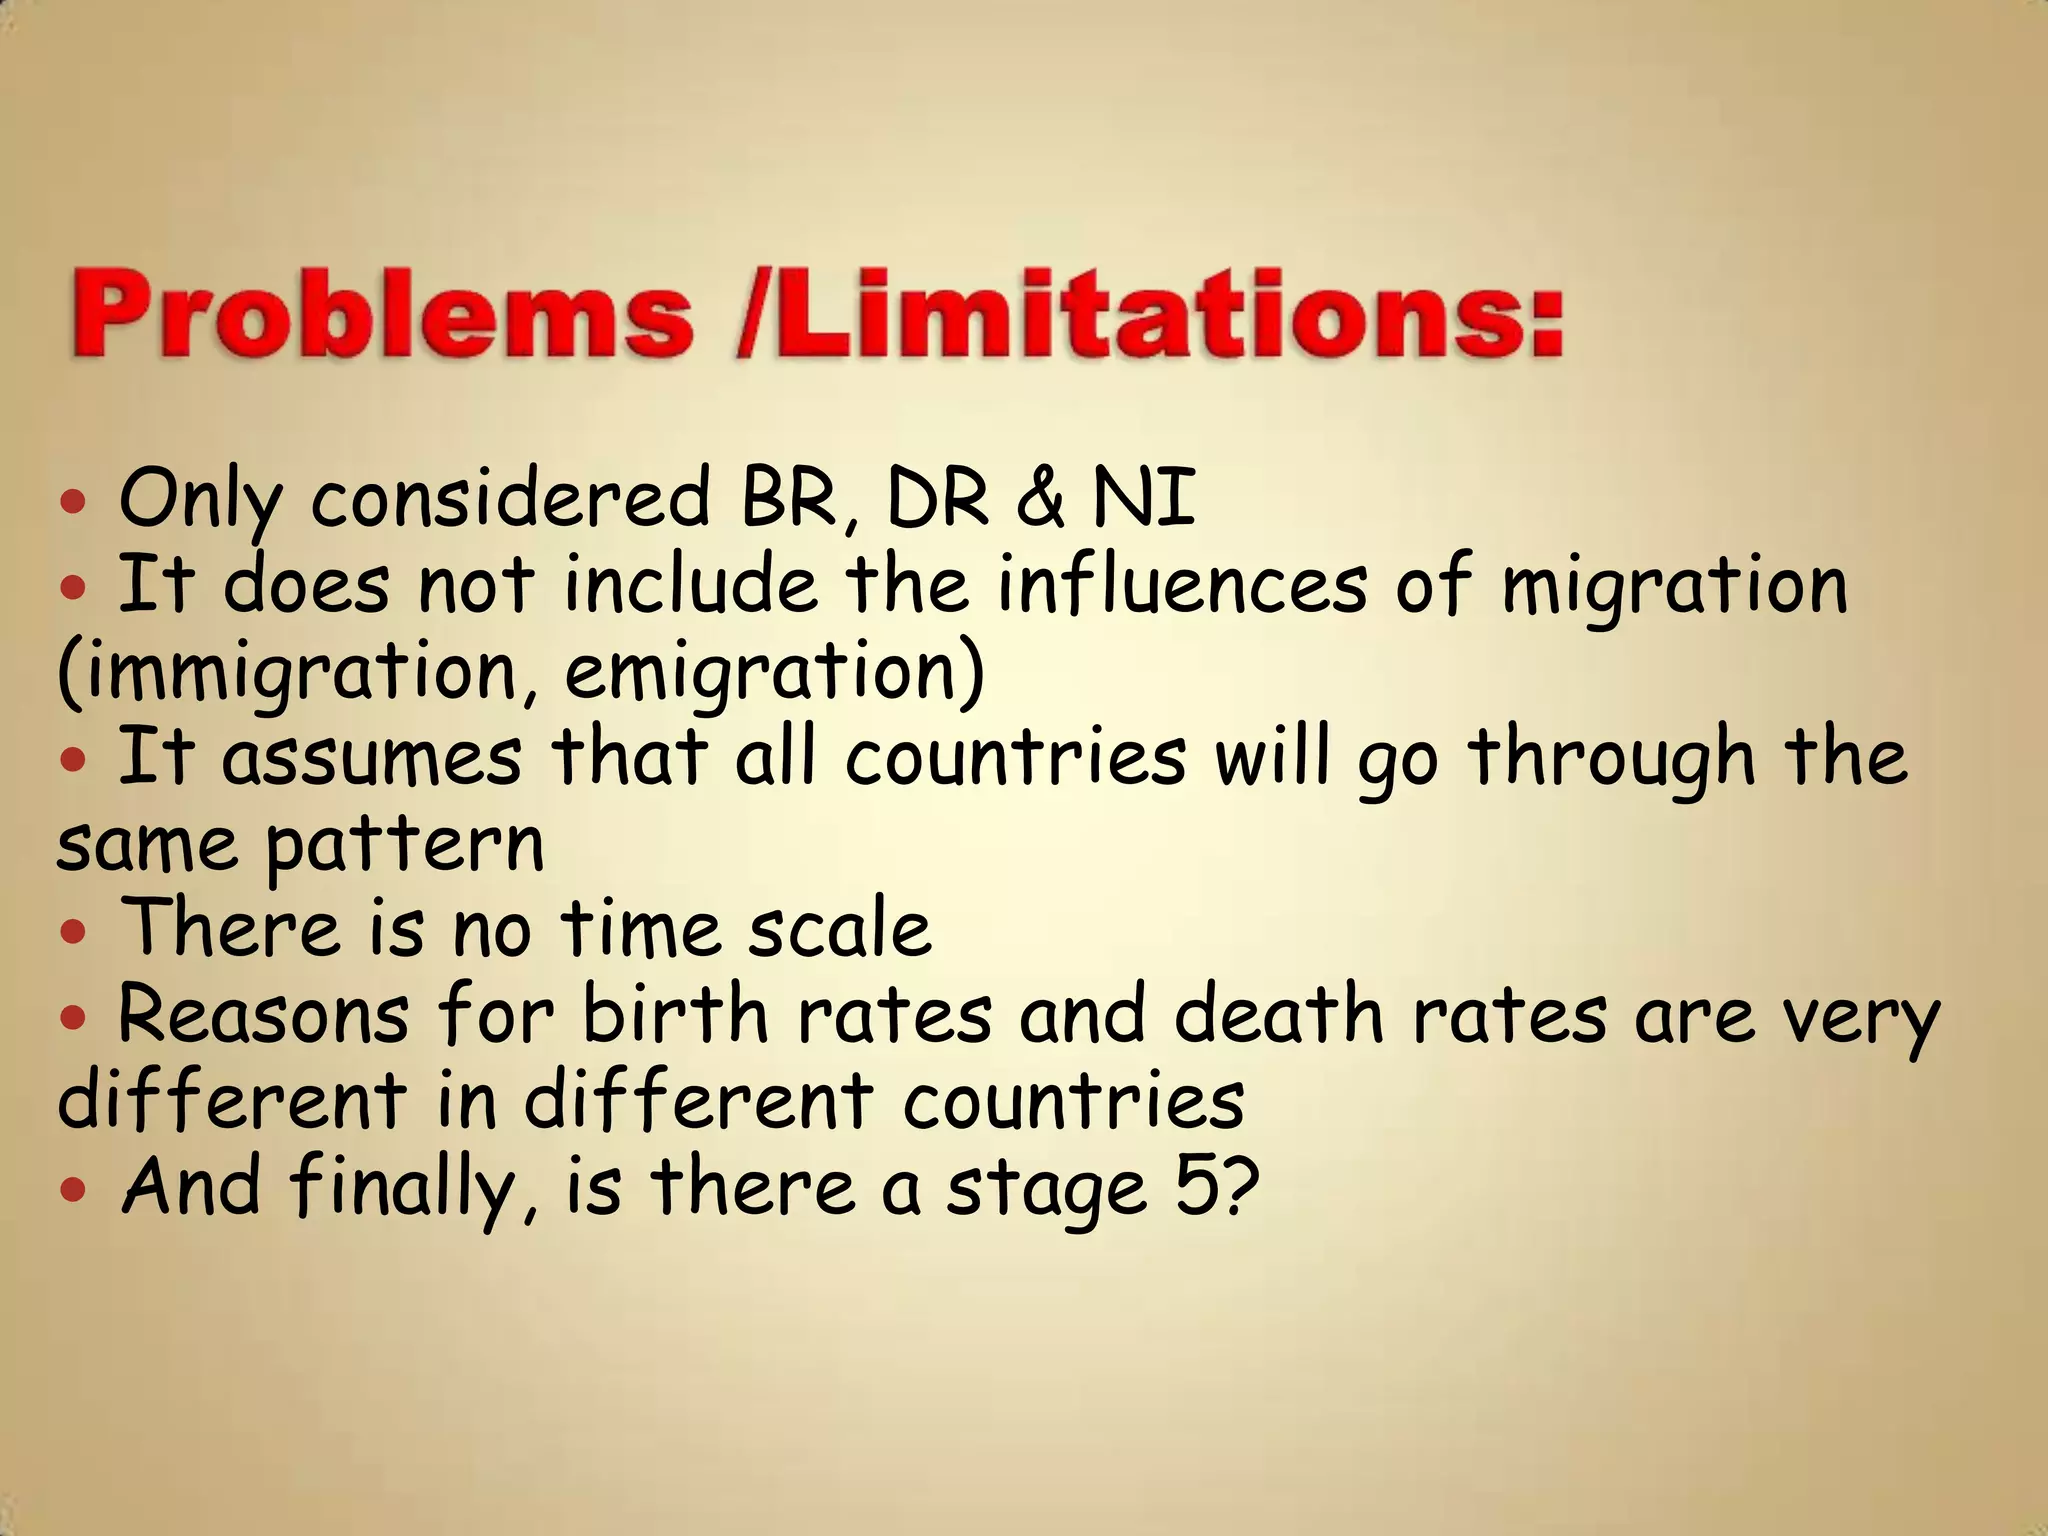
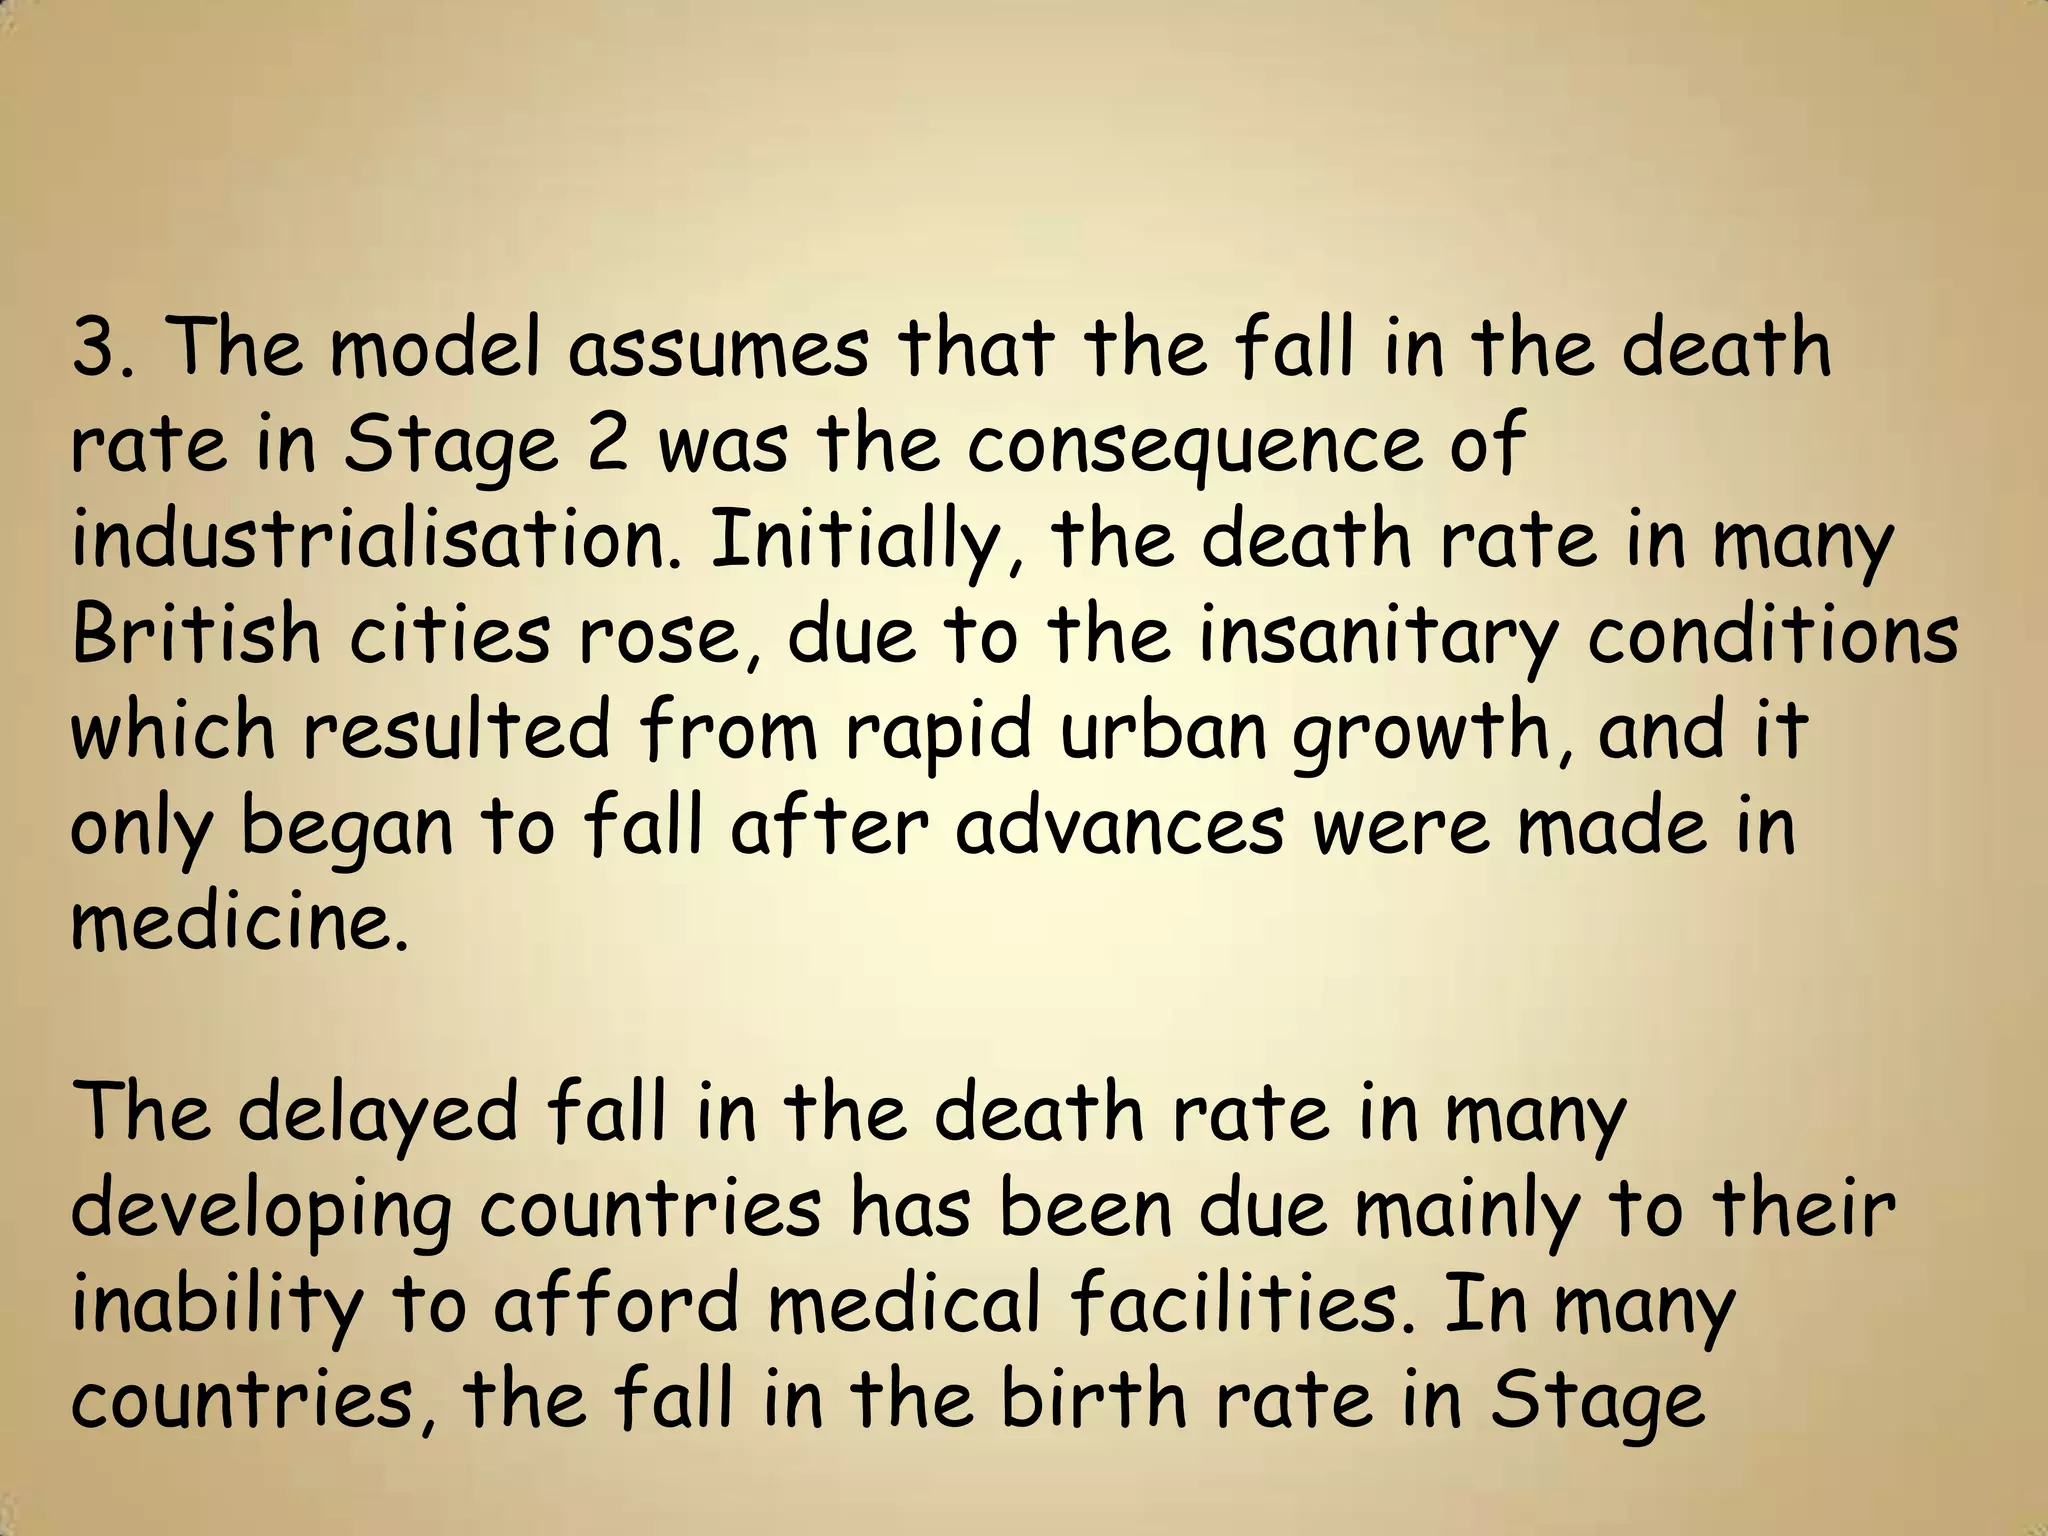
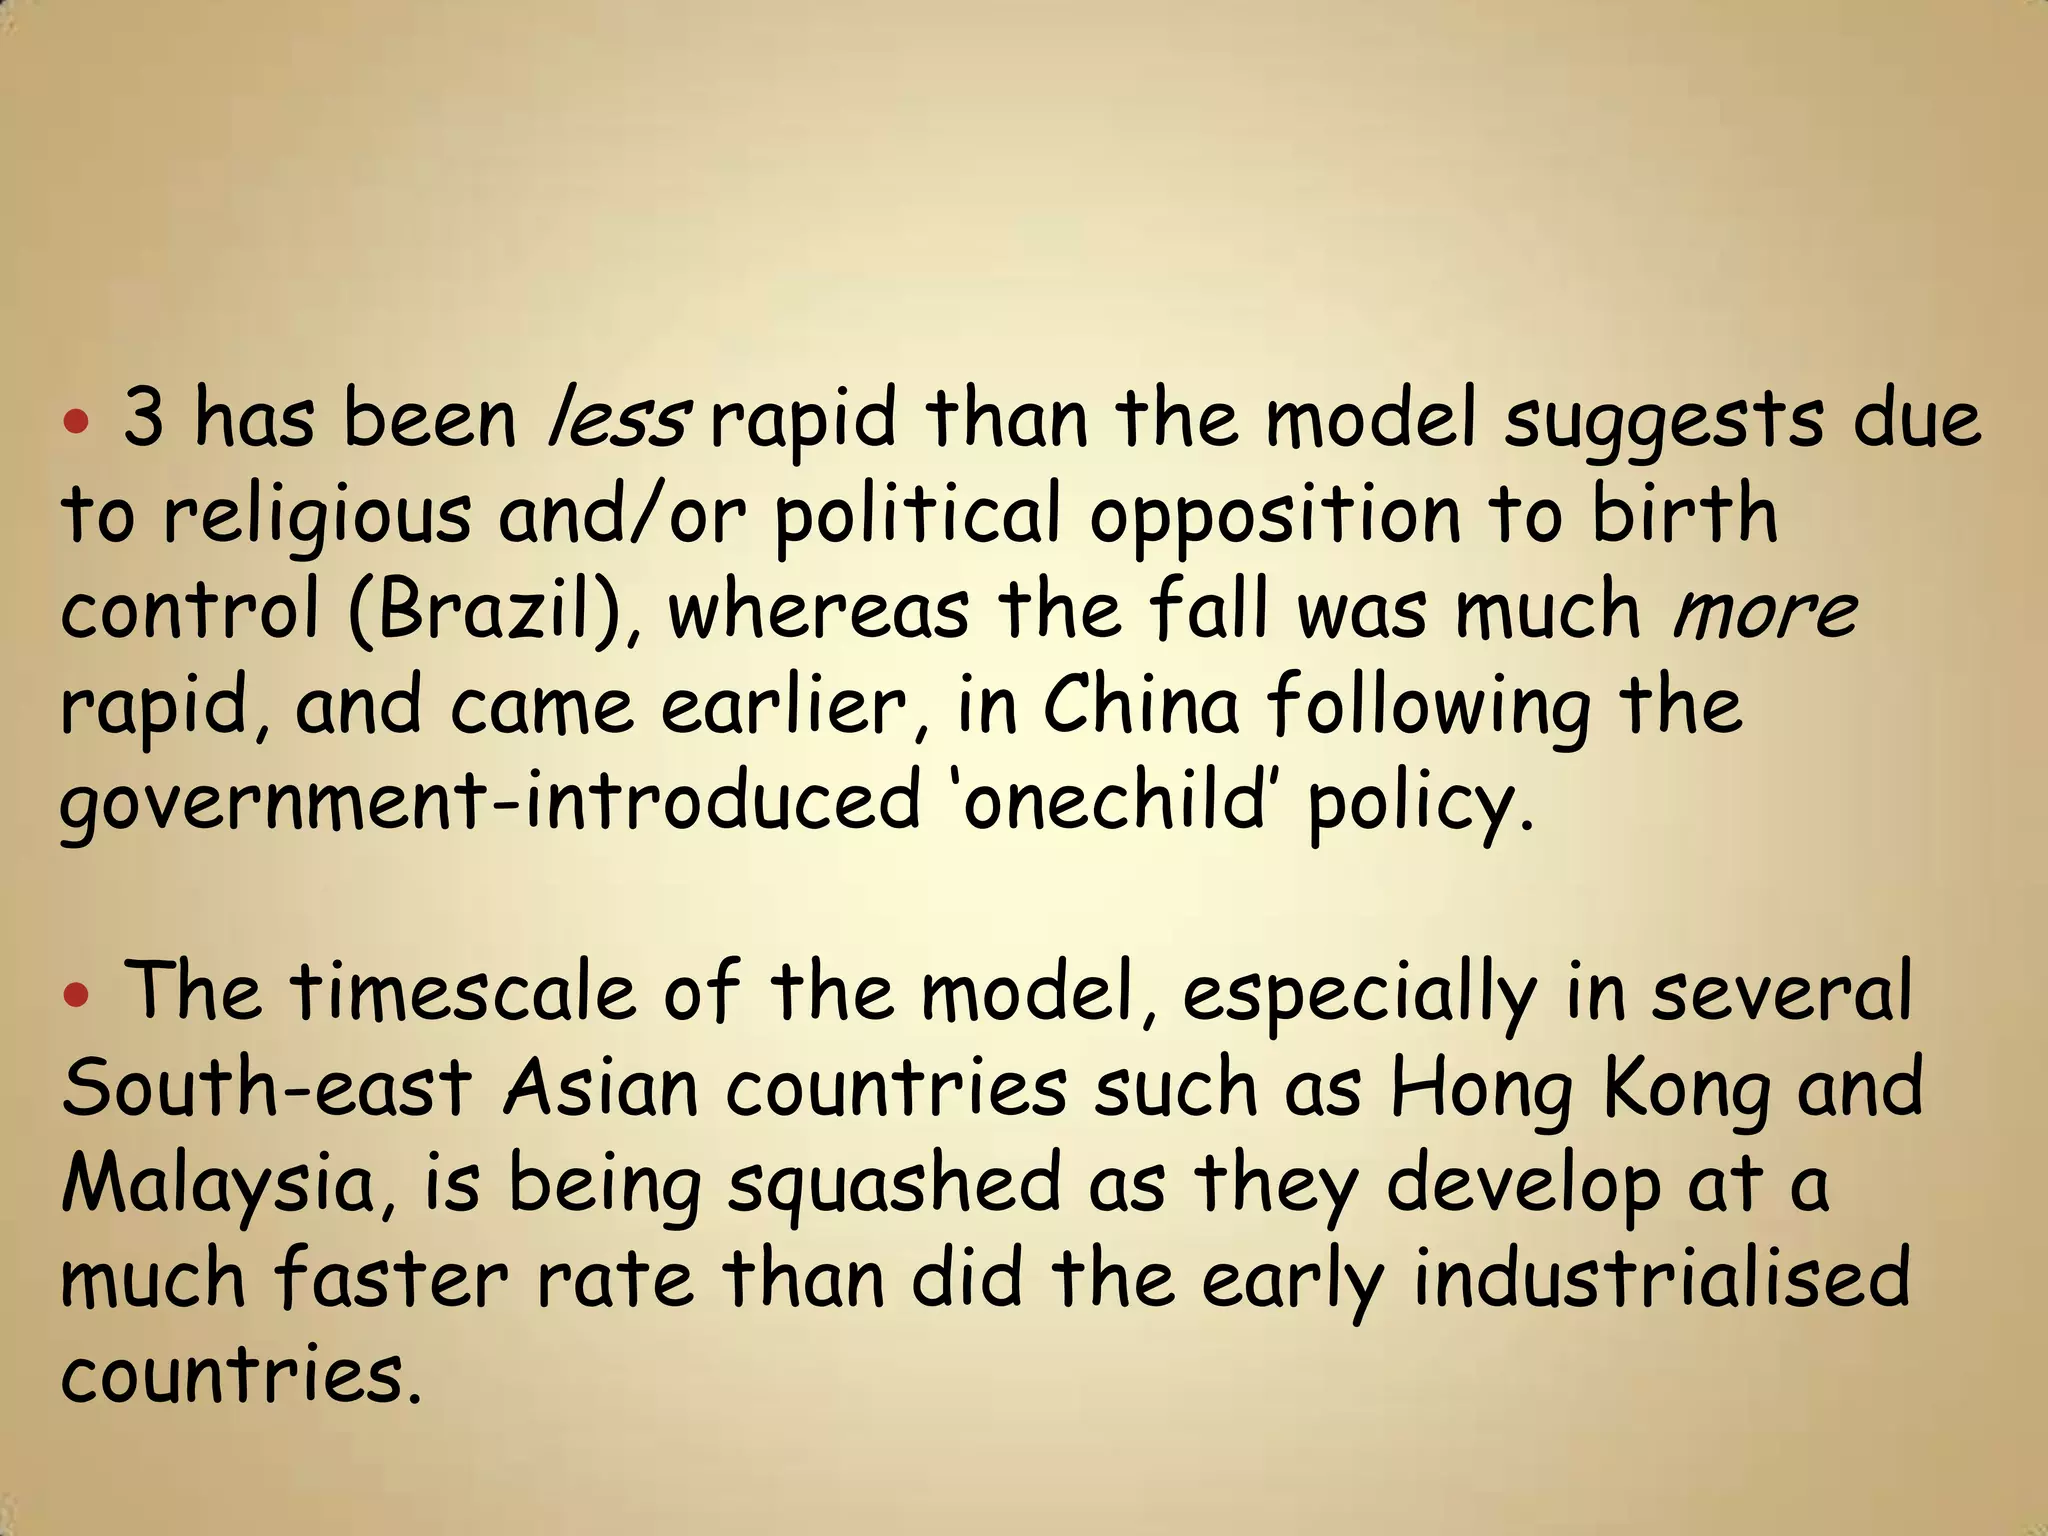
The model has limitations as it fails to consider migration, assumes all countries follow the same pattern, and timescales vary between countries developing at different paces. It also oversimplifies reasons


![Apporach to lung biopsy [Auto-saved].pptx latest](https://cdn.slidesharecdn.com/ss_thumbnails/apporachtolungbiopsyauto-saved-251211225655-93258539-thumbnail.jpg?width=640&height=640&fit=bounds)


