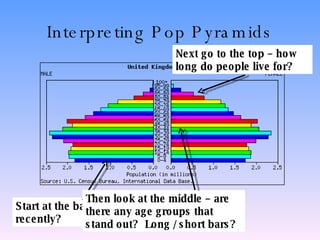
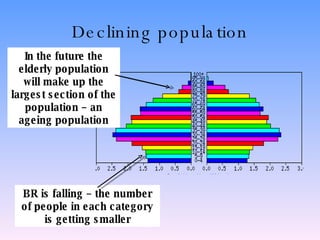
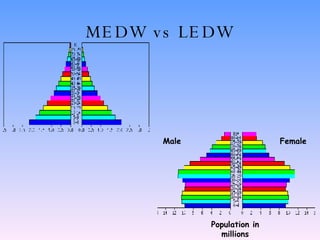
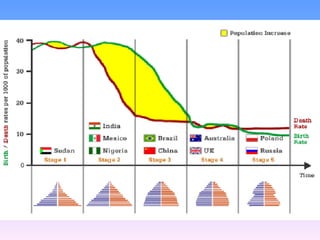
Population Structure
Learning Objectives Interpret the age-sex structure of a country from a population pyramid Describe  how  and explain  why  the UK’s population structure has changed Make links between the DTM and population structure Compare population pyramids from the LEDW and MEDW
Population Structure Population structure is the make up of the total population in a country or area where people are grouped by age and sex. The graphical technique used to summarise age structure is the population pyramid.
Interpreting Pop Pyramids Start at the base – what has happened recently? Next go to the top – how long do people live for?  Then look at the middle – are there any age groups that stand out?  Long / short bars?
Dependent Population
Dependent Population The  dependency ratio  is directly linked to a country’s age structure. To calculate it, the population is split into economically active (15-64) and inactive (0-14 and 65+) Dependency ratio is calculated as a % using: Number of economically active  Number of non-economically active  X 100
How has the population structure of the UK changed over time?
How has the population structure of the UK changed over time? Male Female Population in millions
How has the population structure of the UK changed over time?
Population Structure of the UK Write a case study to describe  how  and  why  the population structure of the UK has changed from 1841-1981. Use annotated sketches of population pyramids to help you. P172-173
MEDW vs LEDW The shape of a population pyramid gives a clear indication of the development status of a country and can therefore be linked with countries in the MEDW or the LEDW.
LEDW This country has a high BR – the pyramid has a wide base But it also has a high DR – shown by the steeply sloping pyramid
Falling BR In some LEDCs, the Government is encouraging families to have fewer children so the BR is falling – the base is becoming narrower.
MEDW Low DR – pyramid is wider at the top The largest group of people was born around 40 years ago – ‘baby boomers’. There are roughly the same amount of people in each age category – BR is stable. Male Female Population in millions
Declining population BR is falling – the number of people in each category is getting smaller In the future the elderly population will make up the largest section of the population – an ageing population
MEDW vs LEDW Male Female Population in millions
Population Structure and the DTM The shape of a population pyramid gives a clear indication of the development status of a country and can therefore be linked with a particular stage of the DTM http://www.bbc.co.uk/scotland/education/geog/population/
Activity Using P174-175 Sketch population pyramid for each stage of the DTM Give reasons for the changes
 

Population Structure

  • 1.
  • 2.
    Learning Objectives Interpretthe age-sex structure of a country from a population pyramid Describe how and explain why the UK’s population structure has changed Make links between the DTM and population structure Compare population pyramids from the LEDW and MEDW
  • 3.
    Population Structure Populationstructure is the make up of the total population in a country or area where people are grouped by age and sex. The graphical technique used to summarise age structure is the population pyramid.
  • 4.
    Interpreting Pop PyramidsStart at the base – what has happened recently? Next go to the top – how long do people live for? Then look at the middle – are there any age groups that stand out? Long / short bars?
  • 5.
  • 6.
    Dependent Population The dependency ratio is directly linked to a country’s age structure. To calculate it, the population is split into economically active (15-64) and inactive (0-14 and 65+) Dependency ratio is calculated as a % using: Number of economically active Number of non-economically active X 100
  • 7.
    How has thepopulation structure of the UK changed over time?
  • 8.
    How has thepopulation structure of the UK changed over time?
  • 9.
    How has thepopulation structure of the UK changed over time? Male Female Population in millions
  • 10.
    How has thepopulation structure of the UK changed over time?
  • 11.
    Population Structure ofthe UK Write a case study to describe how and why the population structure of the UK has changed from 1841-1981. Use annotated sketches of population pyramids to help you. P172-173
  • 12.
    MEDW vs LEDWThe shape of a population pyramid gives a clear indication of the development status of a country and can therefore be linked with countries in the MEDW or the LEDW.
  • 13.
    LEDW This countryhas a high BR – the pyramid has a wide base But it also has a high DR – shown by the steeply sloping pyramid
  • 14.
    Falling BR Insome LEDCs, the Government is encouraging families to have fewer children so the BR is falling – the base is becoming narrower.
  • 15.
    MEDW Low DR– pyramid is wider at the top The largest group of people was born around 40 years ago – ‘baby boomers’. There are roughly the same amount of people in each age category – BR is stable. Male Female Population in millions
  • 16.
    Declining population BRis falling – the number of people in each category is getting smaller In the future the elderly population will make up the largest section of the population – an ageing population
  • 17.
    MEDW vs LEDWMale Female Population in millions
  • 18.
    Population Structure andthe DTM The shape of a population pyramid gives a clear indication of the development status of a country and can therefore be linked with a particular stage of the DTM http://www.bbc.co.uk/scotland/education/geog/population/
  • 19.
    Activity Using P174-175Sketch population pyramid for each stage of the DTM Give reasons for the changes
  • 20.