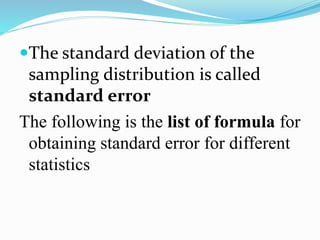
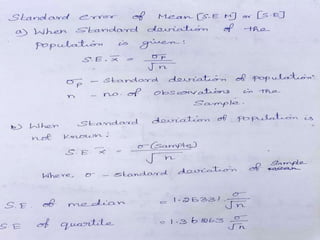
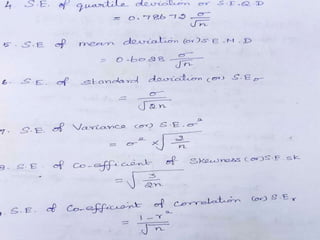
K.SUDHA RAMESHWARI
ASSISTANT PROFESSOR,
V.V.VANNIAPERUMAL COLLEGE FOR WOMEN,VIRUDHUNAGAR
TAMILNADU,INDIA
The standard deviation of the
sampling distribution is called
standard error
The following is the list of formula for
obtaining standard error for different
statistics
Utility of standard error
 It is used as an instrument in testing a given hypothesis.
When the hypothesis is tested at 5% level of significance
, if the difference between observed and expected mean
is more than 1.96 standard error, we may conclude that
the result of the experiment does not support the
hypothesis at 5% level and if the difference is less than
1.96 SE, we can accept the hypothesis.
 At 1% significance level, if the difference is more than
2.58 SE, we can’t accept the hypothesisa and vice versa
Tests of significance can be
classified into three
1. Tests of significance for attributes
2. Tests if significance for variables (large
samples)
3. Tests of significance for variables
(small samples)
Application of tests of significance in
biological sciences
Tests of significance of attributes:
1. To find out whether both vegetarian and non-
vegetarian food eaters are equally intelligent
or not
2. To test the hypothesis that male and female
babies are born in equal number
When we take two samples from two different
populations, we can find out whether there is
any significant difference in the proportion of
success. Examples -To find out whether there
is any significant difference in the food habits
of two villagers
Tests of significance of large samples:
A sample is considered to be large when its size exceeds
30 (n>30)
The various fields of applications are:
1. To test the hypothesis that there is no significant
difference between sample mean height and
hypothetical mean height of sugarcane
2. To test the hypothesis that there is no significant
difference in the yield of grains between the two
varieties
3.To test the hypothesis that there is no significant
difference between mean accidents in the two
towns
4. To test the hypothesis that there is no significant
difference in standard deviation of yield between
paddy and wheat
5. To test the hypothesis that Indian paddy plants are
on an average not taller than Australian paddy
plants
Tests of significance of small samples
 Small samples means (n<30) t-test and F-test are
applied
Applications of t-test are
1. To find out whether systolic blood pressure of a
sample of 10 persons in the age group of 40-50 is
significantly differ from the hypothetical value of
blood pressure of the population
2. To test the hypothesis that the average weight of goat
population is 12kgs.
Reference
 Statistical methods for biologists(Biostatistics)-
S.Palanichamy, M.Manoharan

Standard error-Biostatistics

  • 1.
    K.SUDHA RAMESHWARI ASSISTANT PROFESSOR, V.V.VANNIAPERUMALCOLLEGE FOR WOMEN,VIRUDHUNAGAR TAMILNADU,INDIA
  • 2.
    The standard deviationof the sampling distribution is called standard error The following is the list of formula for obtaining standard error for different statistics
  • 6.
    Utility of standarderror  It is used as an instrument in testing a given hypothesis. When the hypothesis is tested at 5% level of significance , if the difference between observed and expected mean is more than 1.96 standard error, we may conclude that the result of the experiment does not support the hypothesis at 5% level and if the difference is less than 1.96 SE, we can accept the hypothesis.  At 1% significance level, if the difference is more than 2.58 SE, we can’t accept the hypothesisa and vice versa
  • 7.
    Tests of significancecan be classified into three 1. Tests of significance for attributes 2. Tests if significance for variables (large samples) 3. Tests of significance for variables (small samples)
  • 8.
    Application of testsof significance in biological sciences Tests of significance of attributes: 1. To find out whether both vegetarian and non- vegetarian food eaters are equally intelligent or not 2. To test the hypothesis that male and female babies are born in equal number When we take two samples from two different populations, we can find out whether there is any significant difference in the proportion of success. Examples -To find out whether there is any significant difference in the food habits of two villagers
  • 9.
    Tests of significanceof large samples: A sample is considered to be large when its size exceeds 30 (n>30) The various fields of applications are: 1. To test the hypothesis that there is no significant difference between sample mean height and hypothetical mean height of sugarcane 2. To test the hypothesis that there is no significant difference in the yield of grains between the two varieties
  • 10.
    3.To test thehypothesis that there is no significant difference between mean accidents in the two towns 4. To test the hypothesis that there is no significant difference in standard deviation of yield between paddy and wheat 5. To test the hypothesis that Indian paddy plants are on an average not taller than Australian paddy plants
  • 11.
    Tests of significanceof small samples  Small samples means (n<30) t-test and F-test are applied Applications of t-test are 1. To find out whether systolic blood pressure of a sample of 10 persons in the age group of 40-50 is significantly differ from the hypothetical value of blood pressure of the population 2. To test the hypothesis that the average weight of goat population is 12kgs.
  • 12.
    Reference  Statistical methodsfor biologists(Biostatistics)- S.Palanichamy, M.Manoharan