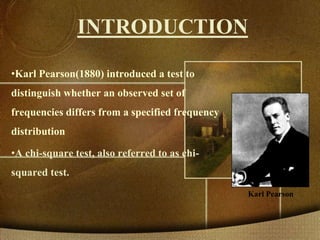
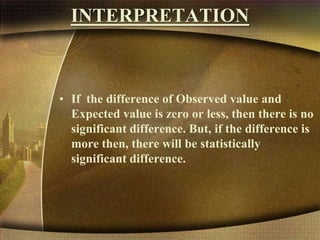
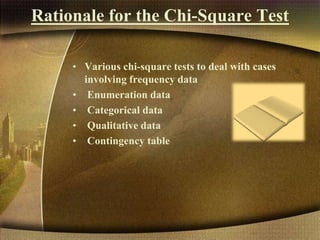
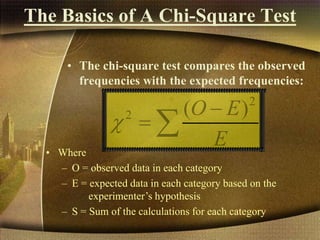
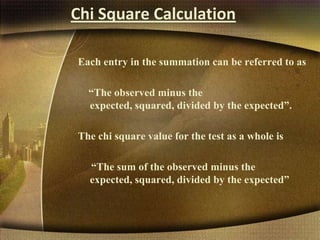
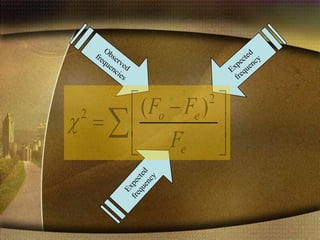
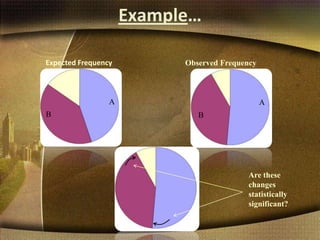
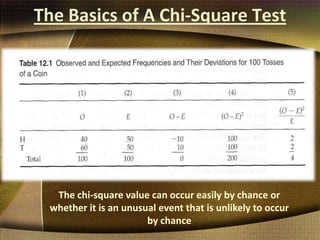
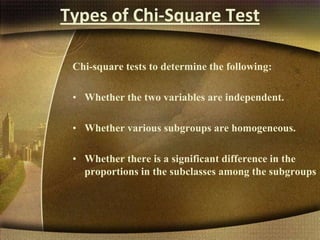
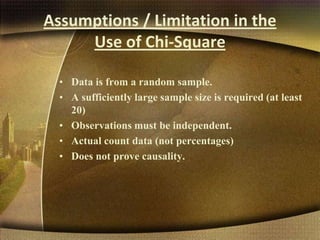
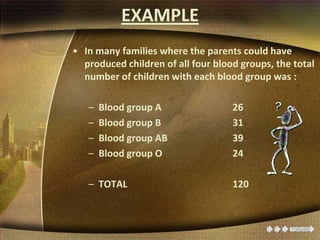
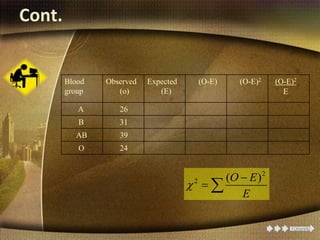
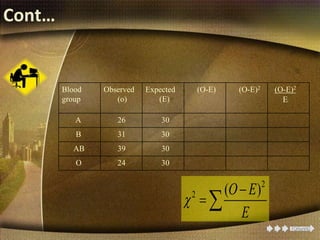
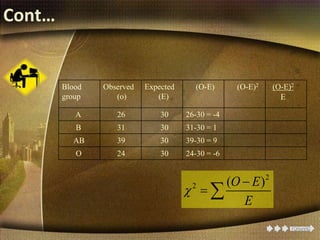
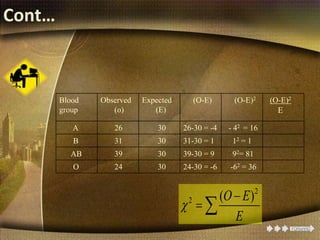
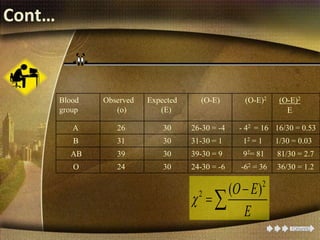
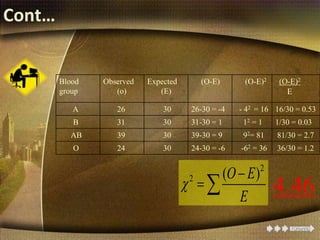
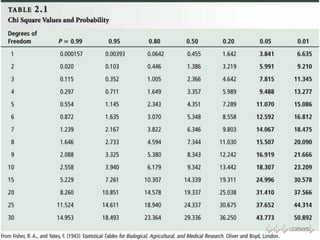
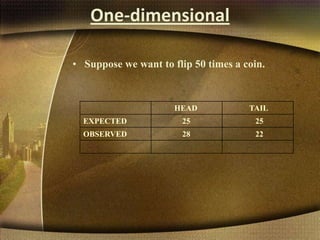
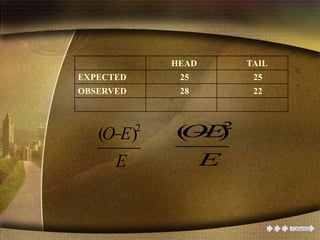
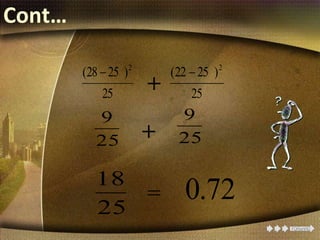
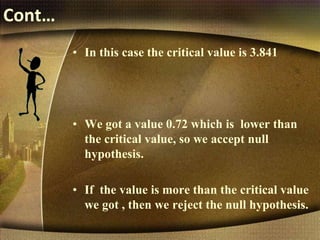
The document provides information about the chi-square test, including its introduction by Karl Pearson, its applications and uses, assumptions, and examples. The chi-square test is used to determine if an observed set of frequencies differ from expected frequencies. It can be used to test differences between categorical data and expected values. Examples shown include a goodness of fit test comparing blood group frequencies to expected equal distribution, and a one-dimensional coin flipping example.
The ppt cover General Introduction to the topic,
Description of CHI-SQUARE TEST, Contingency table, Degree of Freedom, Determination of Chi – square test, Assumption for validity of chi - square test, Characteristics , Applications, Limitations
The ppt cover General Introduction to the topic,
Description of CHI-SQUARE TEST, Contingency table, Degree of Freedom, Determination of Chi – square test, Assumption for validity of chi - square test, Characteristics , Applications, Limitations
Measures of Central Tendency
Requirements of good measures of central tendency
mean, median, mode
skewness of distribution
relation between mean, median,mode
The number that divides the normal distribution into region where we will reject the null hypothesis and the region where we fail to reject the null hypothesis. For normal distribution Z at 5% level of significance (z= plus-minus 1.96) is often referred to as the critical value (or critical region).
One of the three points that divide a data set into four equal parts. Or the values that divide data into quarters. Each group contains equal number of observations or data. Median acts as base for calculation of quartile.
For More Medicine Free PPT - http://playnever.blogspot.com/
For Health benefits and medicine videos Subscribe youtube channel - https://www.youtube.com/playlist?list=PLKg-H-sMh9G01zEg4YpndngXODW2bq92w
A chi-squared test is a statistical hypothesis test that is valid to perform when the test statistic is chi-squared distributed under the null hypothesis, specifically Pearson's chi-squared test and variants
differences between the observed values
Categorical Data and Statistical AnalysisMichael770443
In this presentation, we will introduce two tests and hypothesis testing based on it, and different non-parametric methods such as the Kolmogorov-Smirnov test, the Wilcoxon’s signed-rank test, the Mann-Whitney U test, and the Kruskal-Wallis test.
Ethanol (CH3CH2OH), or beverage alcohol, is a two-carbon alcohol
that is rapidly distributed in the body and brain. Ethanol alters many
neurochemical systems and has rewarding and addictive properties. It
is the oldest recreational drug and likely contributes to more morbidity,
mortality, and public health costs than all illicit drugs combined. The
5th edition of the Diagnostic and Statistical Manual of Mental Disorders
(DSM-5) integrates alcohol abuse and alcohol dependence into a single
disorder called alcohol use disorder (AUD), with mild, moderate,
and severe subclassifications (American Psychiatric Association, 2013).
In the DSM-5, all types of substance abuse and dependence have been
combined into a single substance use disorder (SUD) on a continuum
from mild to severe. A diagnosis of AUD requires that at least two of
the 11 DSM-5 behaviors be present within a 12-month period (mild
AUD: 2–3 criteria; moderate AUD: 4–5 criteria; severe AUD: 6–11 criteria).
The four main behavioral effects of AUD are impaired control over
drinking, negative social consequences, risky use, and altered physiological
effects (tolerance, withdrawal). This chapter presents an overview
of the prevalence and harmful consequences of AUD in the U.S.,
the systemic nature of the disease, neurocircuitry and stages of AUD,
comorbidities, fetal alcohol spectrum disorders, genetic risk factors, and
pharmacotherapies for AUD.
Prix Galien International 2024 Forum ProgramLevi Shapiro
June 20, 2024, Prix Galien International and Jerusalem Ethics Forum in ROME. Detailed agenda including panels:
- ADVANCES IN CARDIOLOGY: A NEW PARADIGM IS COMING
- WOMEN’S HEALTH: FERTILITY PRESERVATION
- WHAT’S NEW IN THE TREATMENT OF INFECTIOUS,
ONCOLOGICAL AND INFLAMMATORY SKIN DISEASES?
- ARTIFICIAL INTELLIGENCE AND ETHICS
- GENE THERAPY
- BEYOND BORDERS: GLOBAL INITIATIVES FOR DEMOCRATIZING LIFE SCIENCE TECHNOLOGIES AND PROMOTING ACCESS TO HEALTHCARE
- ETHICAL CHALLENGES IN LIFE SCIENCES
- Prix Galien International Awards Ceremony
- Video recording of this lecture in English language: https://youtu.be/lK81BzxMqdo
- Video recording of this lecture in Arabic language: https://youtu.be/Ve4P0COk9OI
- Link to download the book free: https://nephrotube.blogspot.com/p/nephrotube-nephrology-books.html
- Link to NephroTube website: www.NephroTube.com
- Link to NephroTube social media accounts: https://nephrotube.blogspot.com/p/join-nephrotube-on-social-media.html
Factory Supply Best Quality Pmk Oil CAS 28578–16–7 PMK Powder in Stockrebeccabio
Factory Supply Best Quality Pmk Oil CAS 28578–16–7 PMK Powder in Stock
Telegram: bmksupplier
signal: +85264872720
threema: TUD4A6YC
You can contact me on Telegram or Threema
Communicate promptly and reply
Free of customs clearance, Double Clearance 100% pass delivery to USA, Canada, Spain, Germany, Netherland, Poland, Italy, Sweden, UK, Czech Republic, Australia, Mexico, Russia, Ukraine, Kazakhstan.Door to door service
Hot Selling Organic intermediates
Report Back from SGO 2024: What’s the Latest in Cervical Cancer?bkling
Are you curious about what’s new in cervical cancer research or unsure what the findings mean? Join Dr. Emily Ko, a gynecologic oncologist at Penn Medicine, to learn about the latest updates from the Society of Gynecologic Oncology (SGO) 2024 Annual Meeting on Women’s Cancer. Dr. Ko will discuss what the research presented at the conference means for you and answer your questions about the new developments.
These lecture slides, by Dr Sidra Arshad, offer a quick overview of physiological basis of a normal electrocardiogram.
Learning objectives:
1. Define an electrocardiogram (ECG) and electrocardiography
2. Describe how dipoles generated by the heart produce the waveforms of the ECG
3. Describe the components of a normal electrocardiogram of a typical bipolar leads (limb II)
4. Differentiate between intervals and segments
5. Enlist some common indications for obtaining an ECG
Study Resources:
1. Chapter 11, Guyton and Hall Textbook of Medical Physiology, 14th edition
2. Chapter 9, Human Physiology - From Cells to Systems, Lauralee Sherwood, 9th edition
3. Chapter 29, Ganong’s Review of Medical Physiology, 26th edition
4. Electrocardiogram, StatPearls - https://www.ncbi.nlm.nih.gov/books/NBK549803/
5. ECG in Medical Practice by ABM Abdullah, 4th edition
6. ECG Basics, http://www.nataliescasebook.com/tag/e-c-g-basics
Flu Vaccine Alert in Bangalore Karnatakaaddon Scans
As flu season approaches, health officials in Bangalore, Karnataka, are urging residents to get their flu vaccinations. The seasonal flu, while common, can lead to severe health complications, particularly for vulnerable populations such as young children, the elderly, and those with underlying health conditions.
Dr. Vidisha Kumari, a leading epidemiologist in Bangalore, emphasizes the importance of getting vaccinated. "The flu vaccine is our best defense against the influenza virus. It not only protects individuals but also helps prevent the spread of the virus in our communities," he says.
This year, the flu season is expected to coincide with a potential increase in other respiratory illnesses. The Karnataka Health Department has launched an awareness campaign highlighting the significance of flu vaccinations. They have set up multiple vaccination centers across Bangalore, making it convenient for residents to receive their shots.
To encourage widespread vaccination, the government is also collaborating with local schools, workplaces, and community centers to facilitate vaccination drives. Special attention is being given to ensuring that the vaccine is accessible to all, including marginalized communities who may have limited access to healthcare.
Residents are reminded that the flu vaccine is safe and effective. Common side effects are mild and may include soreness at the injection site, mild fever, or muscle aches. These side effects are generally short-lived and far less severe than the flu itself.
Healthcare providers are also stressing the importance of continuing COVID-19 precautions. Wearing masks, practicing good hand hygiene, and maintaining social distancing are still crucial, especially in crowded places.
Protect yourself and your loved ones by getting vaccinated. Together, we can help keep Bangalore healthy and safe this flu season. For more information on vaccination centers and schedules, residents can visit the Karnataka Health Department’s official website or follow their social media pages.
Stay informed, stay safe, and get your flu shot today!
The prostate is an exocrine gland of the male mammalian reproductive system
It is a walnut-sized gland that forms part of the male reproductive system and is located in front of the rectum and just below the urinary bladder
Function is to store and secrete a clear, slightly alkaline fluid that constitutes 10-30% of the volume of the seminal fluid that along with the spermatozoa, constitutes semen
A healthy human prostate measures (4cm-vertical, by 3cm-horizontal, 2cm ant-post ).
It surrounds the urethra just below the urinary bladder. It has anterior, median, posterior and two lateral lobes
It’s work is regulated by androgens which are responsible for male sex characteristics
Generalised disease of the prostate due to hormonal derangement which leads to non malignant enlargement of the gland (increase in the number of epithelial cells and stromal tissue)to cause compression of the urethra leading to symptoms (LUTS
3. INTRODUCTION
•Karl Pearson(1880) introduced a test to
distinguish whether an observed set of
frequencies differs from a specified frequency
distribution
•A chi-square test, also referred to as chi-
squared test.
Karl Pearson
4. • “x” in Greek represents „chi‟ , square of this is „chi
square‟ or „ chi-squared test‟ .
• It is used to check the prevalence among the data.
• The chi-square test uses frequency data to generate
a statistical result
• Pearson's chi-squared test (χ2) is the best-known of
several chi-squared tests.
5. APPLICATION/UTILITY
• Chi square test is the test which tests
the significant difference between
expected value and observed value
which can be used for categorical data.
• OR, In simple words it is used to test
whether a significant difference exists
between the observed number of
samples and the expected number of
responses.
6. Parametric and Nonparametric Tests
• The term "non-parametric" refers to the fact that
the chi-square tests do not require assumptions
about population parameters nor do they test
hypotheses about population parameters.
• Some examples of hypothesis tests, such as the t
tests and ANOVA, are parametric tests and they
do include assumptions about parameters and
hypotheses about parameters.
6
7. Parametric and Nonparametric Tests
• The most obvious difference between the chi-
square tests and the other hypothesis tests we have
considered (t and ANOVA) is the nature of the
data.
• For chi-square, the data are frequencies rather
than numerical scores.
7
8. The Chi-Square Test for Goodness-of-Fit
• A statistical method used to determine goodness
of fit.
– Goodness of fit refers to how close the
observed data are to those predicted from a
hypothesis
Note:
– The chi square test does not prove that a
hypothesis is correct
• It evaluates to what extent the data and the
hypothesis have a good fit
8
9. The Chi-Square Test for Goodness-of-Fit
(cont.)
• The chi-square test for goodness-of-fit uses
frequency data from a sample to test hypotheses
about the shape or proportions of a population.
• Each individual in the sample is classified into one
category on the scale of measurement.
• The data, called observed frequencies, simply
count how many individuals from the sample are
in each category.
10. The Chi-Square Test for Goodness-of-Fit
(cont.)
• The null hypothesis specifies the proportion of the
population that should be in each category.
• The proportions from the null hypothesis are used
to compute expected frequencies that describe how
the sample would appear if it were in perfect
agreement with the null hypothesis.
10
11. Insight of chi-square Test
Interpretation
Rationale for the Chi-Square Test
The Basics of a Chi-Square Test
Types of Chi-Square Tests
One dimensional example
Two folded example
Conclusion
12. INTERPRETATION
• If the difference of Observed value and
Expected value is zero or less, then there is no
significant difference. But, if the difference is
more then, there will be statistically
significant difference.
13. Rationale for the Chi-Square Test
• Various chi-square tests to deal with cases
involving frequency data
• Enumeration data
• Categorical data
• Qualitative data
• Contingency table
14. The Basics of A Chi-Square Test
• The chi-square test compares the observed
frequencies with the expected frequencies:
2
2 ( )O E
E
• Where
– O = observed data in each category
– E = expected data in each category based on the
experimenter’s hypothesis
– S = Sum of the calculations for each category
15. Chi Square Calculation
Each entry in the summation can be referred to as
“The observed minus the
expected, squared, divided by the expected”.
The chi square value for the test as a whole is
“The sum of the observed minus the
expected, squared, divided by the expected”
18. Characteristics of the Chi-Square Distribution
1. It is not symmetric.
2. The shape of the chi-square distribution
depends upon the degrees of freedom, just
like Student’s t-distribution.
19. Characteristics of the Chi-Square Distribution
1. It is not symmetric.
2. The shape of the chi-square distribution
depends upon the degrees of freedom, just
like Student’s t-distribution.
3. As the number of degrees of freedom
increases, the chi-square distribution
becomes more symmetric.
20. Characteristics of the Chi-Square Distribution
1. It is not symmetric.
2. The shape of the chi-square
distribution depends upon the degrees
of freedom, just like Student’s t-distribution.
3. As the number of degrees of freedom
increases, the chi-square distribution
becomes more symmetric.
4. The values are non-negative. That is, the
values of are greater than or equal to 0.
22. The Basics of A Chi-Square Test
The chi-square value can occur easily by chance or
whether it is an unusual event that is unlikely to occur
by chance
25. Types of Chi-Square Test
Chi-square tests to determine the following:
• Whether the two variables are independent.
• Whether various subgroups are homogeneous.
• Whether there is a significant difference in the
proportions in the subclasses among the subgroups
26. Assumptions / Limitation in the
Use of Chi-Square
• Data is from a random sample.
• A sufficiently large sample size is required (at least
20)
• Observations must be independent.
• Actual count data (not percentages)
• Does not prove causality.
28. EXAMPLE
• In many families where the parents could have
produced children of all four blood groups, the total
number of children with each blood group was :
– Blood group A 26
– Blood group B 31
– Blood group AB 39
– Blood group O 24
– TOTAL 120
29. Cont…
Those numbers are the results observed and
have been put into the O column in this table
46. Cont…
• Which is always the amount of
possible phenotypes minus one.
So in this case 4 – 1 = 3
47. Cont…
• Then we find the 3 degrees of freedom row
and read along until we find the number
which is closest to our result…
• Finally we look which column this value is
in…
48. Cont…
• If its in the 0.05 (or 50 %) column or
any column less than this…
( meaning that the chi squared value is
bigger than the one in the 0.05 column)
• Then any differences are NOT due to
chance…
• Which means that something else is
affecting our results…
50. cont
• But if its in a column above 0.05 (known as
the critical value)…
• (meaning that the chi squared value is
smaller than the one in the 0.05 column)
• Then any differences in our results are due to
chance…
51. Cont…
• And the null Hypothesis is accepted
• Remember that the critical value is
ALWAYS 0.05…
57. Cont…
• In this case the critical value is 3.841
• We got a value 0.72 which is lower than
the critical value, so we accept null
hypothesis.
• If the value is more than the critical value
we got , then we reject the null hypothesis.
58. SOME AYURVEDIC JOURNALS
USING CHI SQUARE
• Allopathic vs. Ayurvedic practices in tertiary care
institutes of urban North India
(Indian Journal of Pharmacology, Vol. 39, No. 1,
January-February, 2007, pp. 52-54).
• Assessment of oligospermia with special reference to
rakta dusti.
(International research journal of Pharmacy 2012)
• Evaluation of efficacy of karshaneeya yavagu (An
Ayurvedic preparation) in the management of
Obesity.
(International Journal of Research in Ayurveda &
Pharmacy;Mar2012, Vol. 3 Issue 2, p295)
59. Conclusion
• Note that all we really can conclude is that our data
is different from the expected outcome given a
situation
– Regardless of the position of the frequencies
we’d have come up with the same result
– It is a non-directional test regardless of the
prediction.
Editor's Notes
A portmanteau test is a type of statistical hypothesis test in which the null hypothesis is well specified, but the alternative hypothesis is more loosely specified. Tests constructed in this context can have the property of being at least moderately powerful against a wide range of departures from the null hypothesis. Thus, in applied statistics, a portmanteau test provides a reasonable way of proceeding as a general check of a model's match to a dataset where there are many different ways in which the model may depart from the underlying data generating process. Use of such tests avoids having to be very specific about the particular type of departure being tested.
The percentage of various drugs used in both the hospitals was compared using Chi-square test. P -value < 0.001 was considered statistically significant.