Downloaded 350 times
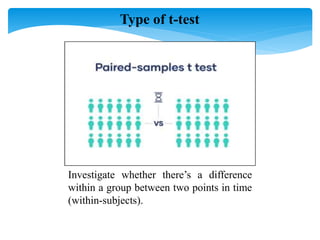
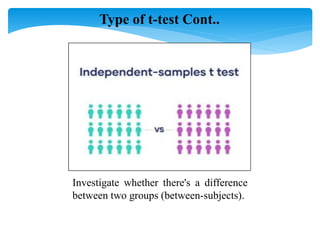
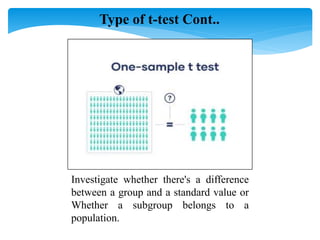
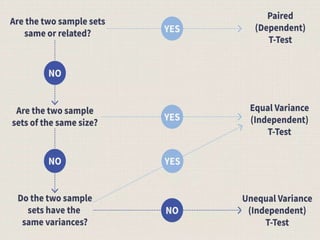
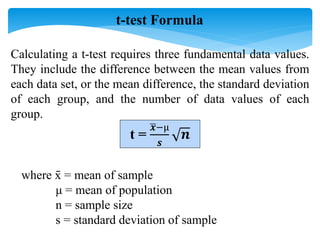
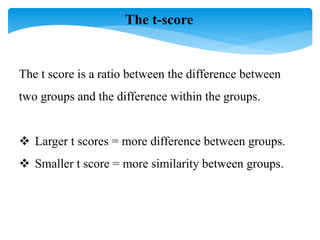

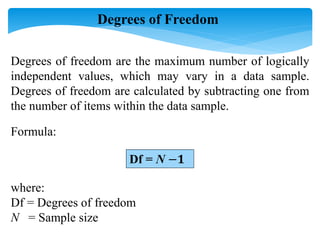
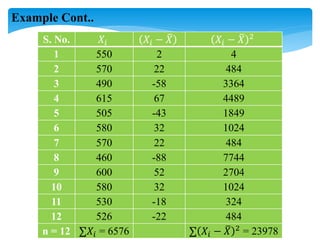
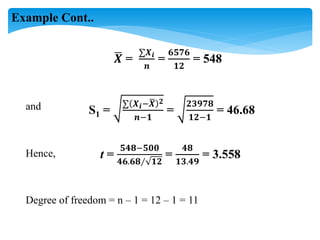
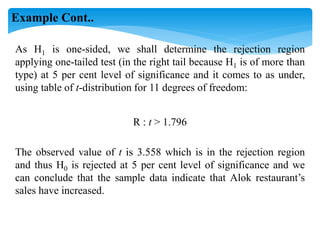
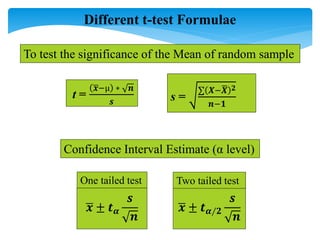
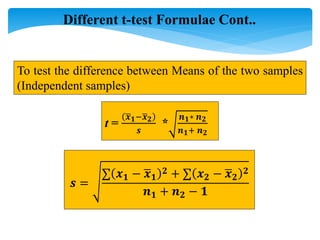
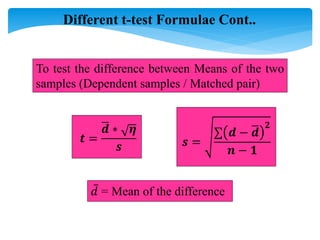
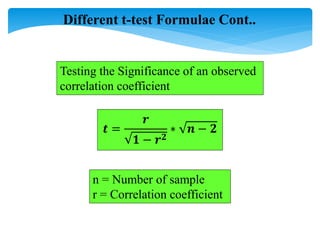

The document discusses the t-test, an inferential statistic developed by William Sealy Gosset under the pseudonym 'Student' in 1980, which is used to determine significant differences between the means of two variables. It covers various types of t-tests, including paired, independent, one-sample, one-tailed, and two-tailed tests, as well as the necessary calculations, including t-scores, p-values, and degrees of freedom. An example of the application of a t-test is provided, demonstrating how to determine if a restaurant's sales have increased after the establishment of a nearby bus stand.


