INTRODUCTION:
In 1908William Sealy Gosset , an Englishman publishing under
the pseudonym Student developed the t-test and t distribution.
It is also known as Students T-Test.
A t-test is a statistical tool that is used to compare the means of two groups. It is often
used in hypothesis testing to determine whether a process or treatment actually has an
effect on the population of interest, or whether two groups are different from one another.
A t-test can only be used when comparing the means of two groups :
→ Are (approximately) normally distributed.
→ Sample size should be less than <30.
3.
Types of T-Test
One-sample T-test:
The one-sample t-test is a statistical hypothesis test used to determine whether an
unknown population mean is different from a specific value.
Two-sample T-test (Independent):
The two-sample t-test (also known as the independent samples t-test) is a method
used to test whether the unknown population means of two groups are equal or not.
Paired T-test (Dependent):
The paired t-test is designed to compare the means of the same group or item under
Two separate scenarios.
4.
Merits:
Essential forgeneralization
Easy to interpret
Provide necessary information
Saves time
Demerits:
Difficult to find subjects
Multiple comparisons
Small amount of noise
Reliability of data
5.
What is Hypothesis?
A Hypothesis is a mere assumption to be proved or disapproved.
Is the statement or an assumption about relationships between variables.
It is a principal instrument in research and for researcher. It’s a formal question
that he intents to resolve.
There are 2 types :
Null Hypothesis - A null hypothesis is a hypothesis that says there is no statistical significance
between the two variables. It is denoted with H0
Alternate Hypothesis – A alternative hypothesis is a position that states something is different
between two data. It is denoted by Ha or H1
Degree of Freedom (D.O.F.)
Degrees of Freedom refers to the maximum number of logically independent values, which
are values that have the freedom to vary, in the data sample.
6.
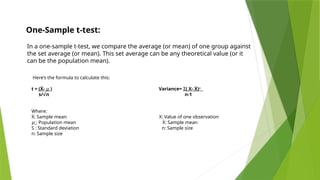
In a one-samplet-test, we compare the average (or mean) of one group against
the set average (or mean). This set average can be any theoretical value (or it
can be the population mean).
One-Sample t-test:
Here’s the formula to calculate this:
t = (Ẋ- 𝜇 ) Variance= Σ( X- Ẋ)²
s/ n n-1
√
Where:
Ẋ: Sample mean X: Value of one observation
𝜇 : Population mean Ẋ: Sample mean
S : Standard deviation n: Sample size
n: Sample size
7.
A customer servicecompany wants to know if their 12 support agents are performing
on parameters with industry standards or not, the industry standard is (µ)=20.(Table-
value = 1.796)
x = [21.5, 24.5, 18.5, 17.2, 14.5, 23.2, 22.1, 20.5, 19.4, 18.1, 24.1, 18.5]
Test if the support agents are performing on parameters with industry standards or
not.
Step 1: identify the Null Hypothesis
H0= There is no statistical difference between the performance of the agents and
industry standard.
8.
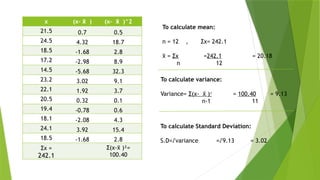
x (x- x
̄) (x- x
̄ )^2
21.5 0.7 0.5
24.5 4.32 18.7
18.5 -1.68 2.8
17.2 -2.98 8.9
14.5 -5.68 32.3
23.2 3.02 9.1
22.1 1.92 3.7
20.5 0.32 0.1
19.4 -0.78 0.6
18.1 -2.08 4.3
24.1 3.92 15.4
18.5 -1.68 2.8
Σx =
242.1
Σ(x-x
̄ )²=
100.40
To calculate mean:
n = 12 , Σx= 242.1
=
x
̄ Σx =242.1 = 20.18
n 12
To calculate variance:
Variance= Σ(x- x
̄ )² = 100.40 = 9.13
n-1 11
To calculate Standard Deviation:
S.D=√variance =√9.13 = 3.02
9.
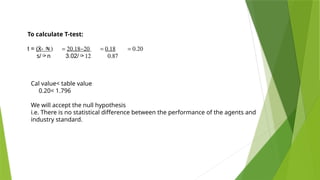
To calculate T-test:
t= (Ẋ- ) = 20.18-20 = 0.18 = 0.20
s/n 3.02/ 12 0.87
Cal value< table value
0.20< 1.796
We will accept the null hypothesis
i.e. There is no statistical difference between the performance of the agents and
industry standard.
10.
Two sample T-test(unpaired/Independent)
The two-sample t-test (also known as the independent samples t-test) is a method
used to test whether the unknown population means of two groups are equal or
not.
Here’s the formula to calculate this:
Where:
x
̄ 1= mean of sample 1
x
̄ 2= mean of sample 2
n 1= no of sample 1 observations
n 2= no of sample 2 observations
X1= data of sample 1
X2= data of sample 2
S.D= √ [ Σ(X1- 1)
x
̄ ² + Σ(X2- 2)
x
̄ ² ]
[ n1 + n2 – 2 ]
t = 1- 2
x
̄ x
̄ × √ [ n1n2 ]
S [ n1+n2]
11.
In company XYZ,one of the employee from Team A complained HR about his team leader that he
is causing stress on them which is also causing effect on his other team members. Due to which
HR conducted stress level reports of Team A and Team B which was also given the same work
and was lead by sarah. HR decided to compare both the teams stress level and find out
difference in their stress levels.(T-table value is 1.761)
Team A Team B
13 5
17 15
12 6
18 14
19 8
8 12
14 7
9 10
Step 1: identify the Null Hypothesis
H0= there is no difference between the stress level of Team A &
Team B
12.
DIVA
(X1)
X1-x
̄
1
(X1- 1)^2
x
̄ DIVB
(X2)
X2-x
̄
2
(X2- 2)^2
x
̄
13
0.88 0.77
5
-4.63 21.39
17
4.88 23.77
15
5.38 28.89
12
-0.13 0.02
6
-3.63 13.14
18
5.88 34.52
14
4.38 19.14
19
6.88 47.27
8
-1.63 2.64
8
-4.13 17.02
12
2.38 5.64
14
1.88 3.52
7
-2.63 6.89
9
-3.13 9.77
10
0.38 0.14
Σx1=110 Σ(X1- 1)
x
̄ ²
=115.50
Σx2=
77
Σ(X2- 2)
x
̄ ²
=97.88
To calculate mean of Team A & B:
=
x
̄ Σx n = 8
n
1=
x
̄ 110 =13.75 , 2=
x
̄ 77 =9.63
8 8
S.D= √ [ Σ(X1- 1)
x
̄ ² + Σ(X2- 2)
x
̄ ² ]
[ n1 + n2 – 2 ]
= √ [ 115.50+97.88 ]
[ 8+8-2 ]
= 15.24
13.
t = 1-2
x
̄ x
̄ × √ [ n1n2 ]
S [ n1+n2]
= 13.75-9.63 × √ [ 8 ×8 ]
15.24 [ 8+8 ]
= 0.54
T-table value is 1.761
T-table > T- cal value
We will accept the null hypothesis
There is no difference between the stress level of Team A & B.
14.
Paired T-Test (DependentT-Test)
The Paired Samples t Test compares the means of two measurements taken from the
same individual, object, or related units. These "paired" measurements can represent
things like: A measurement taken at two different times (e.g., pre-test and post-
test score with an intervention administered between the two time points).
Here is the formula to calculate paired t-test
t = d
̅ √ (n)
S
S = √ [ Σd² - n( )²]
d
̅
[ n-1 ]
Where,
n= Number of observations
d= difference between pre-post
data
=
d
̅ Σd
n
S= standard deviation
15.
Raj a newdietician in town wants to know if he’s diet plan prescribed to his patients is working or
not. So with the help of his clients pre and post data he made a report and decided to carry out T-
test.(T-table value is 1.833)
He collected the data of following weights in the first visit and then after 2 weeks visit of his clients :
Patients Weights
1st
visit
2nd
visit
Ganesh 95 94
Riya 89 85
Aryan 75 73
Dhwani 72 77
Samarth 74 69
Vedika 80 80
Shree 90 92
Neha 85 82
Ashish 92 91
Jui 83 88
Step 1: identify the Null Hypothesis
There is no statistical difference in weights of patients
after diet plan.
16.
Before
(1st
visit)
After
(2nd
visit)
d d²
95 941 1
89 85 4 16
75 73 2 4
72 77 -5 25
74 69 5 25
80 80 0 0
90 92 -2 4
85 82 3 9
92 91 1 1
83 88 -5 25
Σ(d)=
4
Σ(d²)=
110
=
d
̅ Σd = 4 = 0.4
n 10
S = √ [ Σd² - n( )²]
d
̅ = √ [ 110- 10(0.4)]
[ n-1 ] [ 10-1 ]
= 3.43
T Calculated = d
̅ √ (n) = 0.4 √ (10)
S 3.43
= 0.37
Table value 1.83 .
Table value >T Calculated Value
Therefore Accept the Null Hypothesis
There is no statistical difference in weights of
patients after diet plan


![A customer service company wants to know if their 12 support agents are performing
on parameters with industry standards or not, the industry standard is (µ)=20.(Table-
value = 1.796)
x = [21.5, 24.5, 18.5, 17.2, 14.5, 23.2, 22.1, 20.5, 19.4, 18.1, 24.1, 18.5]
Test if the support agents are performing on parameters with industry standards or
not.
Step 1: identify the Null Hypothesis
H0= There is no statistical difference between the performance of the agents and
industry standard.](https://image.slidesharecdn.com/ttest-23316-250416054358-ad69ab8e/85/ttest-2331bbbbbbbbbbbbbbbbbbbbbbbb6-pptx-7-320.jpg)
![Two sample T-test (unpaired/Independent)
The two-sample t-test (also known as the independent samples t-test) is a method
used to test whether the unknown population means of two groups are equal or
not.
Here’s the formula to calculate this:
Where:
x
̄ 1= mean of sample 1
x
̄ 2= mean of sample 2
n 1= no of sample 1 observations
n 2= no of sample 2 observations
X1= data of sample 1
X2= data of sample 2
S.D= √ [ Σ(X1- 1)
x
̄ ² + Σ(X2- 2)
x
̄ ² ]
[ n1 + n2 – 2 ]
t = 1- 2
x
̄ x
̄ × √ [ n1n2 ]
S [ n1+n2]](https://image.slidesharecdn.com/ttest-23316-250416054358-ad69ab8e/85/ttest-2331bbbbbbbbbbbbbbbbbbbbbbbb6-pptx-10-320.jpg)

![DIVA
(X1)
X1-x
̄
1
(X1- 1)^2
x
̄ DIV B
(X2)
X2-x
̄
2
(X2- 2)^2
x
̄
13
0.88 0.77
5
-4.63 21.39
17
4.88 23.77
15
5.38 28.89
12
-0.13 0.02
6
-3.63 13.14
18
5.88 34.52
14
4.38 19.14
19
6.88 47.27
8
-1.63 2.64
8
-4.13 17.02
12
2.38 5.64
14
1.88 3.52
7
-2.63 6.89
9
-3.13 9.77
10
0.38 0.14
Σx1=110 Σ(X1- 1)
x
̄ ²
=115.50
Σx2=
77
Σ(X2- 2)
x
̄ ²
=97.88
To calculate mean of Team A & B:
=
x
̄ Σx n = 8
n
1=
x
̄ 110 =13.75 , 2=
x
̄ 77 =9.63
8 8
S.D= √ [ Σ(X1- 1)
x
̄ ² + Σ(X2- 2)
x
̄ ² ]
[ n1 + n2 – 2 ]
= √ [ 115.50+97.88 ]
[ 8+8-2 ]
= 15.24](https://image.slidesharecdn.com/ttest-23316-250416054358-ad69ab8e/85/ttest-2331bbbbbbbbbbbbbbbbbbbbbbbb6-pptx-12-320.jpg)
![t = 1- 2
x
̄ x
̄ × √ [ n1n2 ]
S [ n1+n2]
= 13.75-9.63 × √ [ 8 ×8 ]
15.24 [ 8+8 ]
= 0.54
T-table value is 1.761
T-table > T- cal value
We will accept the null hypothesis
There is no difference between the stress level of Team A & B.](https://image.slidesharecdn.com/ttest-23316-250416054358-ad69ab8e/85/ttest-2331bbbbbbbbbbbbbbbbbbbbbbbb6-pptx-13-320.jpg)
![Paired T-Test (Dependent T-Test)
The Paired Samples t Test compares the means of two measurements taken from the
same individual, object, or related units. These "paired" measurements can represent
things like: A measurement taken at two different times (e.g., pre-test and post-
test score with an intervention administered between the two time points).
Here is the formula to calculate paired t-test
t = d
̅ √ (n)
S
S = √ [ Σd² - n( )²]
d
̅
[ n-1 ]
Where,
n= Number of observations
d= difference between pre-post
data
=
d
̅ Σd
n
S= standard deviation](https://image.slidesharecdn.com/ttest-23316-250416054358-ad69ab8e/85/ttest-2331bbbbbbbbbbbbbbbbbbbbbbbb6-pptx-14-320.jpg)

![Before
(1st
visit)
After
(2nd
visit)
d d²
95 94 1 1
89 85 4 16
75 73 2 4
72 77 -5 25
74 69 5 25
80 80 0 0
90 92 -2 4
85 82 3 9
92 91 1 1
83 88 -5 25
Σ(d)=
4
Σ(d²)=
110
=
d
̅ Σd = 4 = 0.4
n 10
S = √ [ Σd² - n( )²]
d
̅ = √ [ 110- 10(0.4)]
[ n-1 ] [ 10-1 ]
= 3.43
T Calculated = d
̅ √ (n) = 0.4 √ (10)
S 3.43
= 0.37
Table value 1.83 .
Table value >T Calculated Value
Therefore Accept the Null Hypothesis
There is no statistical difference in weights of
patients after diet plan](https://image.slidesharecdn.com/ttest-23316-250416054358-ad69ab8e/85/ttest-2331bbbbbbbbbbbbbbbbbbbbbbbb6-pptx-16-320.jpg)