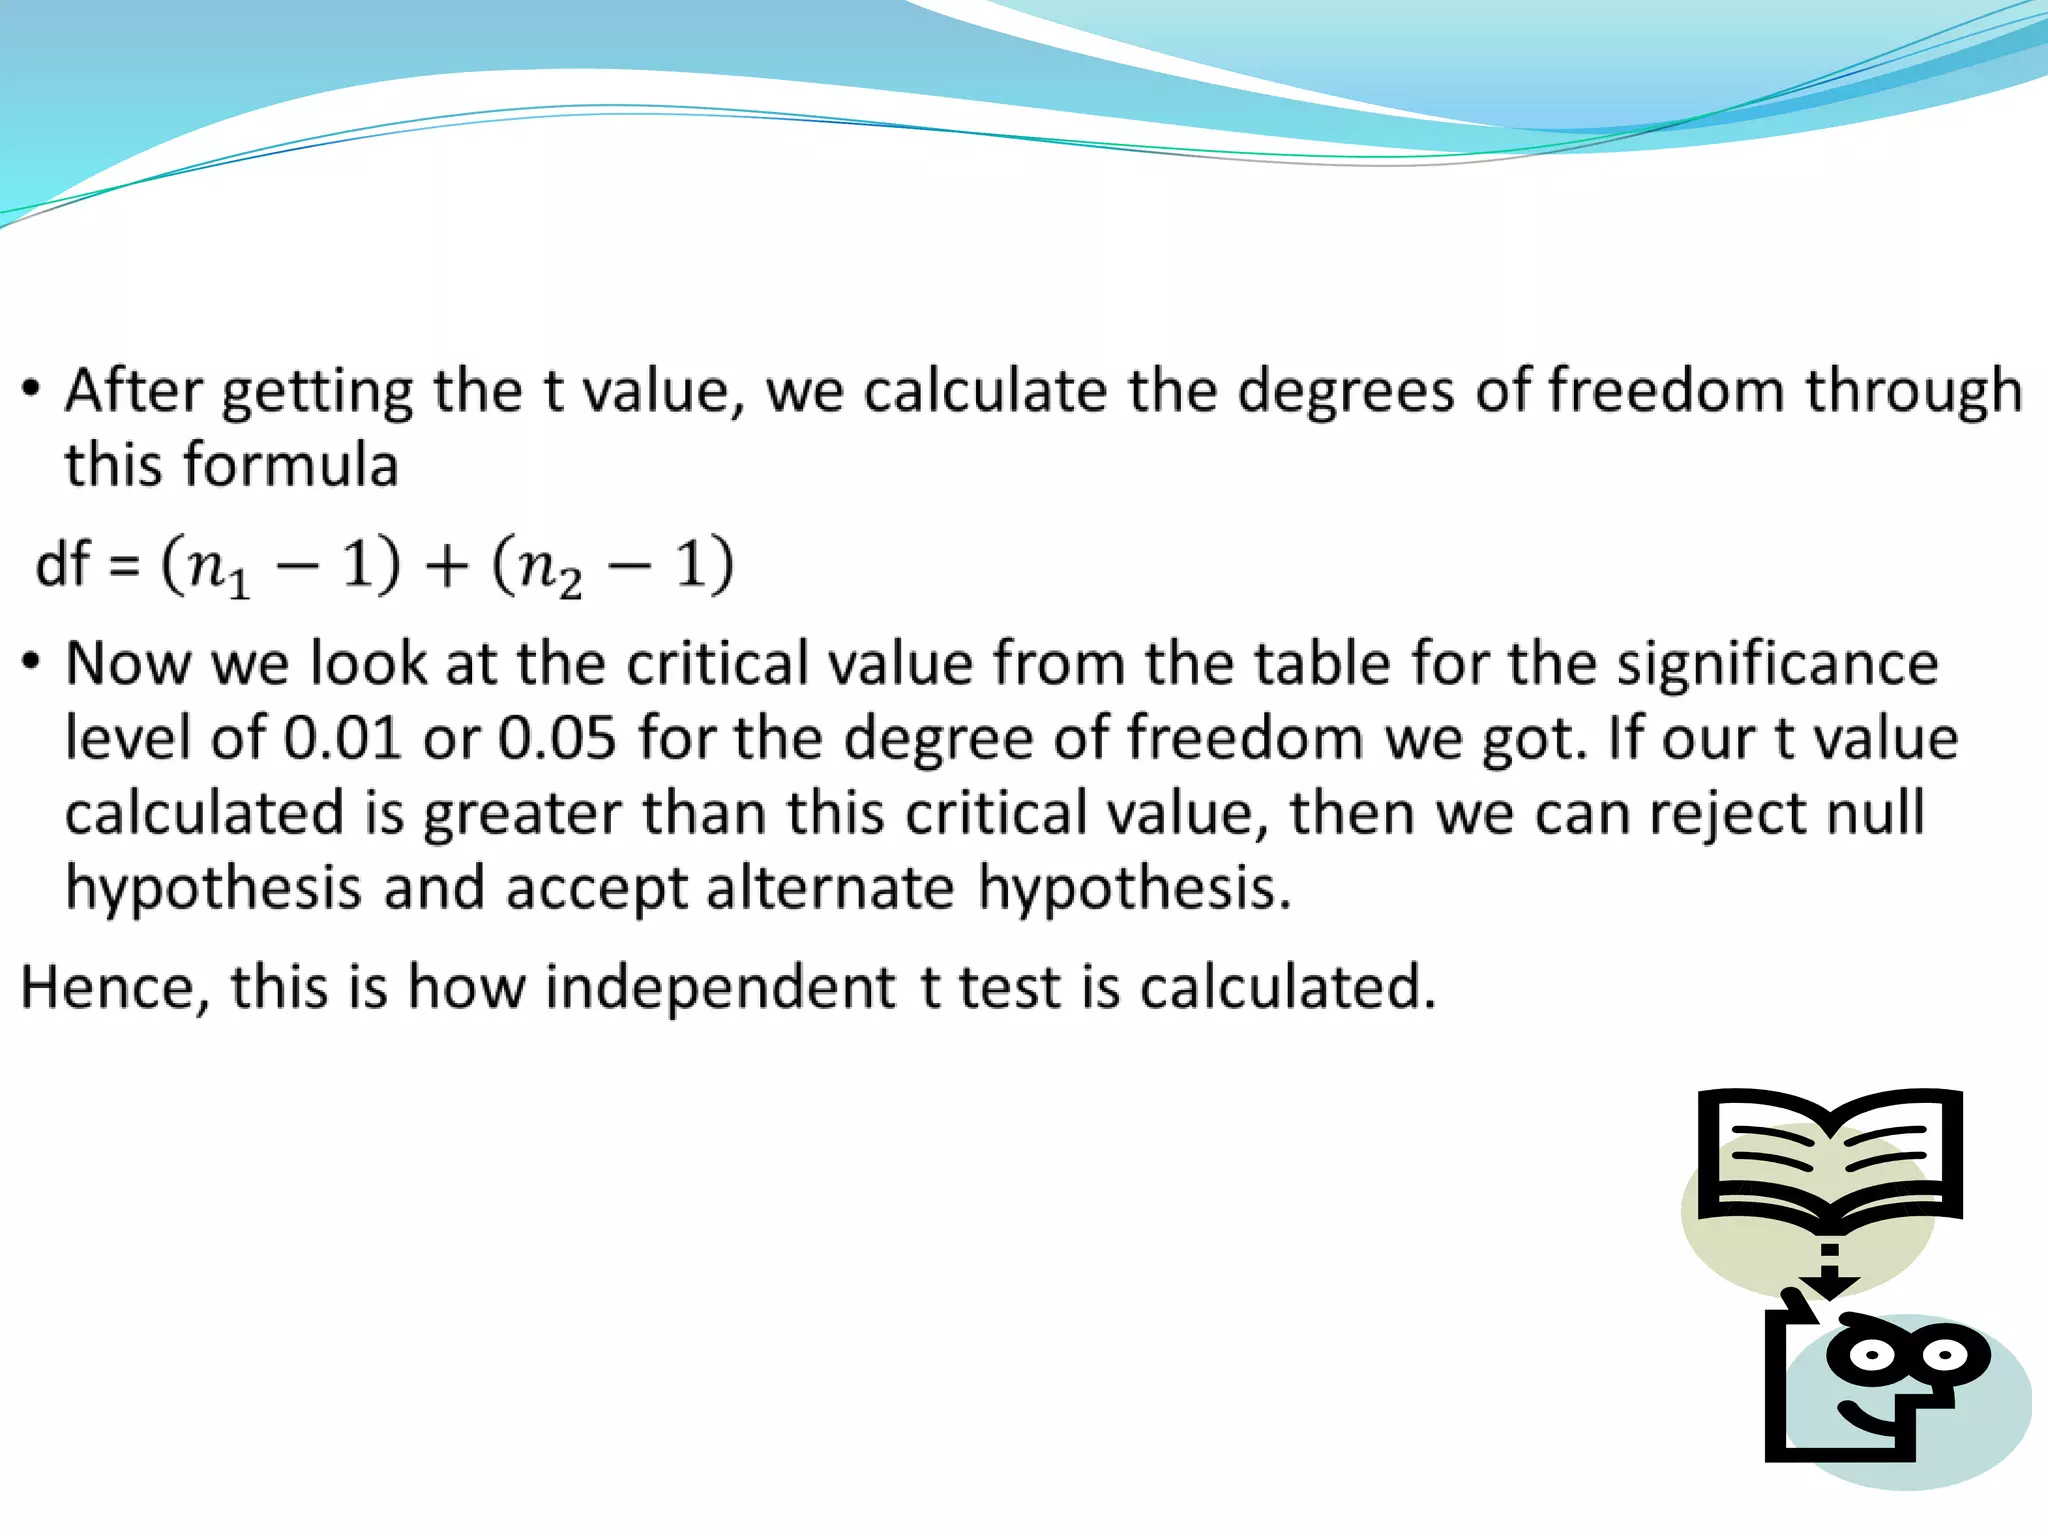
 NAME – AMRITA KUMARI
 AFFILIATION – BANARAS HINDU UNIVERSITY
Application no.-8fff099e67c11e9801339e3a95769ac
PARAMETRIC TESTS
 Parametric function were mentioned by R.Fisher.
 It’s a statistical test in which specific assumptions are made
about the population distribution from which the sample is
drawn.
ASSUMPTIONS :
 The population data is normally distributed.
 The observations must be independent.
 The population must have same variance.
 The samples drawn from population must follow
homogenity principle .
 The data should be on ratio or interval scale.
WHEN & WHY WE DO PARAMETRIC
TEST?
• It can perform well with skewed and non
normal distributions.
• It can also be done when the spread of each
group is different.
• It has more statistical power.
TYPES OF PARAMETRIC TEST
t-test
Two sample
t-test
paired
unpaired
One sample
t-test
Z-test
ANOVA
One-way ANOVA Two-way ANOVA
• t-test
One-sample t-test
Two
sample
Two sample t-test
t-test
•It’s a method of testing hypothesis about the mean of small
sample drawn from a normally distributed population when
SD(standard deviation) for the sample is unknown.
ASSUMPTIONS
•Observations in the study are independent of each other.
•Homogeneity of variance : distribution of scores around mean
are of 2 or more samples are equal
• sample is drawn from a normally distributed
population.
•DVs are on interval or ratio scale.
TYPES OF t-test
Types of t-
test
Two sample
Independent
Paired
One sample
ONE SAMPLE t- test
 It’s used to measure whether a sample value significantly
differs from a hypothesized value.
 For eg: a research scholar might hypothesize that on an
average it takes 3 minutes for people to drink a standard
cup of coffee.
 He conducts an experiment & measures how long it takes
his subjects to drink a standard cup of coffee.
 The one sample t-test measures whether the mean amount
of time it took the experimental group to complete the task
varies significantly from the hypothesized 3 min value.
Equation for one-sample t-test
DEPENDENT t-test
 It compares the means of two related samples to check
whether there is a significant difference between their
means.
 It is an example of within subjects or repeated
measures statistical tests.
HYPOTHESIS
STEPS TO CALCULATE
 After getting the t value calculate the degree of
freedom.
 Now we look at the critical value from the table for the
significance level of 0.05 or 0.01 for the degree of
freedom we got. If our t value obtained is greater than
the critical value, the null hypothesis is rejected and
the alternate hypothesis is accepted.
Hence, this is how correlated t test is calculated.
•Independent t-test is used when means of two different samples are
compared.
•The two independent samples are randomly selected and are
completely independent of each other.
•The distribution of dependent variable is normal in the populations
from which samples are drawn and the variances in the population are
roughly equal.
•Data are measured at least at interval level.
TWO SAMPLE :INDEPENDENT
t-test
We test the null hypothesis that the two population
means are same against an appropriate one-tailed or
two-tailed alternative hypothesis.
µ1 = µ2
Where µ1 = Mean of population 1 and µ2 = Mean of
population 2
Since null hypothesis assumes that means of both
populations are same, then µ1 - µ2 = 0
STEPS TO CALCULATE
ADVANTAGES AND
DISADVANTAGES OF
PARAMETRIC STATISTICS
1. Does not require convertable data- biggest advantage.
2. The long calculations provide accuracy and precision to the results.
3. In this specific assumption are made about the population.
4. Based on distribution.
5. There is complete information about the population.
6. Can perform quite well when they have been spread over and each group
happens to be different.
7. It has high statistical power as compared to other tests. Therefore we will be
able to find an effect that is significant when one will exist truly.
ADVANTAGES
DISADVANTAGES
1. Influence of sample size- parametric tests are not valid when it comes
to small sample (if < n=10).
2. You have missing values as well as outliers, you just cannot randomly
remove.
3. Susceptibility to violation of assumptions
4. Scope of application
5. Speed of application
6. Ease of application
7. Simplicity of deviation- high level of maths calculations.
8. Parametric test is used for only interval data and ratio data.
Acknowledgement
SWAYAM online course - Academic writing
Wekipedia.
Winer,,B.J., Brown,D.R. & Michels,K.M.(1991) Statistical
principles in experimental design.NY:McGraw Hill.

Parametric Test

  • 1.
     NAME –AMRITA KUMARI  AFFILIATION – BANARAS HINDU UNIVERSITY Application no.-8fff099e67c11e9801339e3a95769ac
  • 2.
    PARAMETRIC TESTS  Parametricfunction were mentioned by R.Fisher.  It’s a statistical test in which specific assumptions are made about the population distribution from which the sample is drawn. ASSUMPTIONS :  The population data is normally distributed.  The observations must be independent.  The population must have same variance.  The samples drawn from population must follow homogenity principle .  The data should be on ratio or interval scale.
  • 3.
    WHEN & WHYWE DO PARAMETRIC TEST? • It can perform well with skewed and non normal distributions. • It can also be done when the spread of each group is different. • It has more statistical power.
  • 4.
    TYPES OF PARAMETRICTEST t-test Two sample t-test paired unpaired One sample t-test Z-test ANOVA One-way ANOVA Two-way ANOVA • t-test One-sample t-test Two sample Two sample t-test
  • 5.
  • 6.
    •It’s a methodof testing hypothesis about the mean of small sample drawn from a normally distributed population when SD(standard deviation) for the sample is unknown. ASSUMPTIONS •Observations in the study are independent of each other. •Homogeneity of variance : distribution of scores around mean are of 2 or more samples are equal
  • 7.
    • sample isdrawn from a normally distributed population. •DVs are on interval or ratio scale. TYPES OF t-test Types of t- test Two sample Independent Paired One sample
  • 8.
    ONE SAMPLE t-test  It’s used to measure whether a sample value significantly differs from a hypothesized value.  For eg: a research scholar might hypothesize that on an average it takes 3 minutes for people to drink a standard cup of coffee.  He conducts an experiment & measures how long it takes his subjects to drink a standard cup of coffee.  The one sample t-test measures whether the mean amount of time it took the experimental group to complete the task varies significantly from the hypothesized 3 min value.
  • 9.
  • 10.
    DEPENDENT t-test  Itcompares the means of two related samples to check whether there is a significant difference between their means.  It is an example of within subjects or repeated measures statistical tests.
  • 11.
  • 12.
  • 13.
     After gettingthe t value calculate the degree of freedom.  Now we look at the critical value from the table for the significance level of 0.05 or 0.01 for the degree of freedom we got. If our t value obtained is greater than the critical value, the null hypothesis is rejected and the alternate hypothesis is accepted. Hence, this is how correlated t test is calculated.
  • 14.
    •Independent t-test isused when means of two different samples are compared. •The two independent samples are randomly selected and are completely independent of each other. •The distribution of dependent variable is normal in the populations from which samples are drawn and the variances in the population are roughly equal. •Data are measured at least at interval level. TWO SAMPLE :INDEPENDENT t-test
  • 15.
    We test thenull hypothesis that the two population means are same against an appropriate one-tailed or two-tailed alternative hypothesis. µ1 = µ2 Where µ1 = Mean of population 1 and µ2 = Mean of population 2 Since null hypothesis assumes that means of both populations are same, then µ1 - µ2 = 0
  • 16.
  • 20.
  • 21.
    1. Does notrequire convertable data- biggest advantage. 2. The long calculations provide accuracy and precision to the results. 3. In this specific assumption are made about the population. 4. Based on distribution. 5. There is complete information about the population. 6. Can perform quite well when they have been spread over and each group happens to be different. 7. It has high statistical power as compared to other tests. Therefore we will be able to find an effect that is significant when one will exist truly. ADVANTAGES
  • 22.
    DISADVANTAGES 1. Influence ofsample size- parametric tests are not valid when it comes to small sample (if < n=10). 2. You have missing values as well as outliers, you just cannot randomly remove. 3. Susceptibility to violation of assumptions 4. Scope of application 5. Speed of application 6. Ease of application 7. Simplicity of deviation- high level of maths calculations. 8. Parametric test is used for only interval data and ratio data.
  • 23.
  • 24.
    Wekipedia. Winer,,B.J., Brown,D.R. &Michels,K.M.(1991) Statistical principles in experimental design.NY:McGraw Hill.