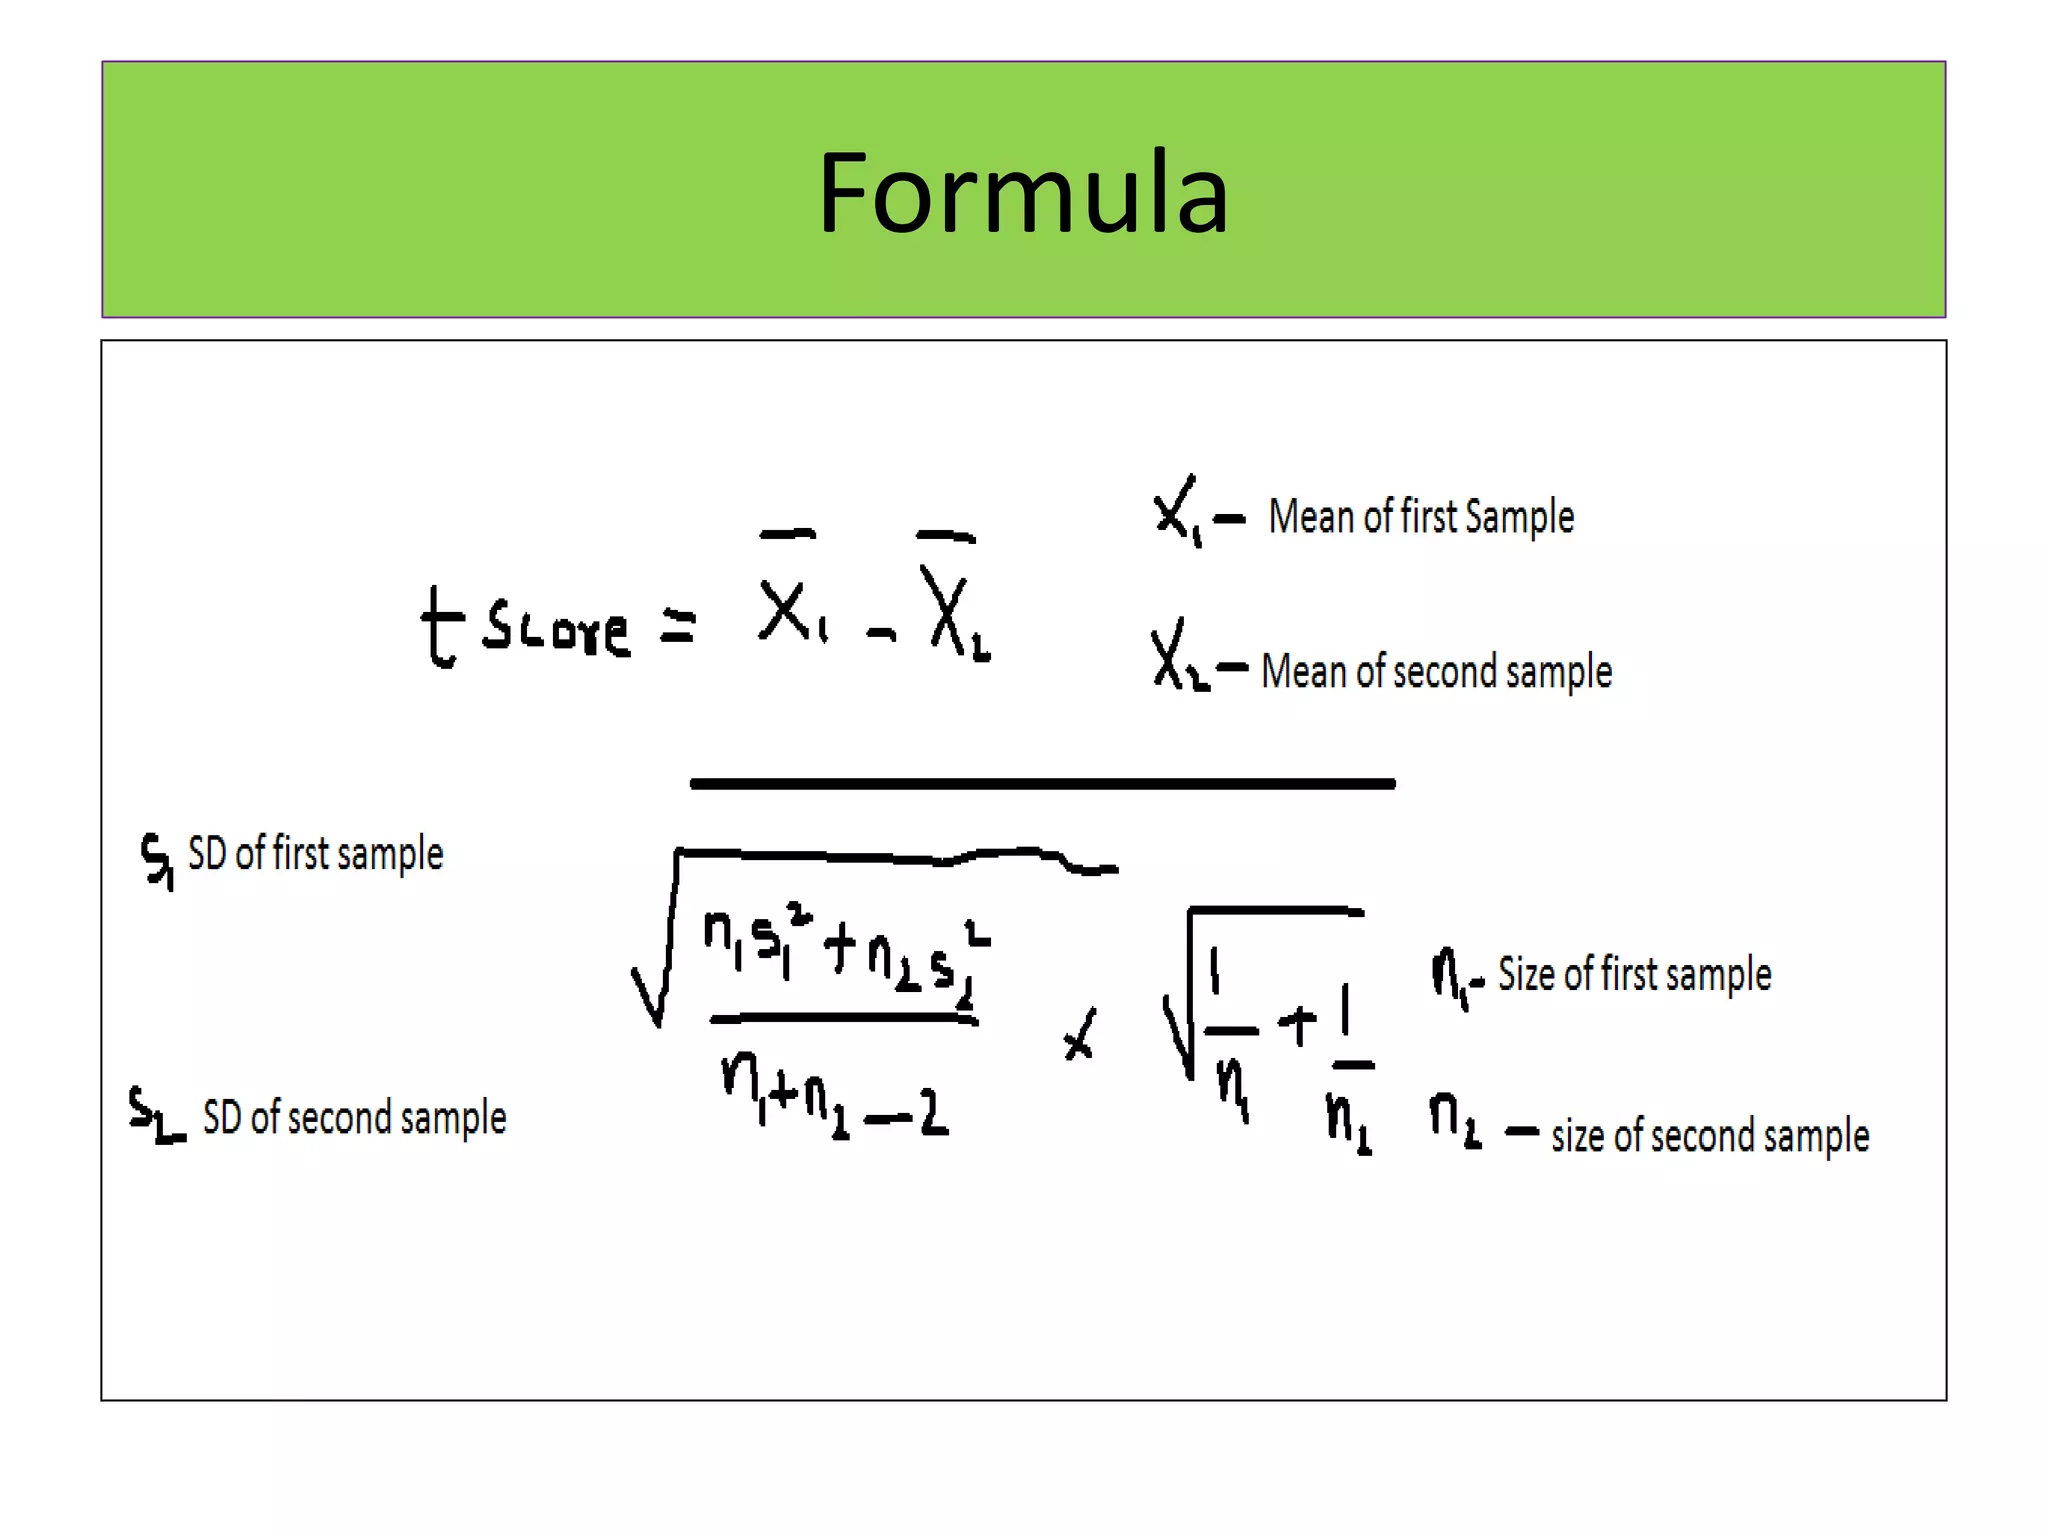
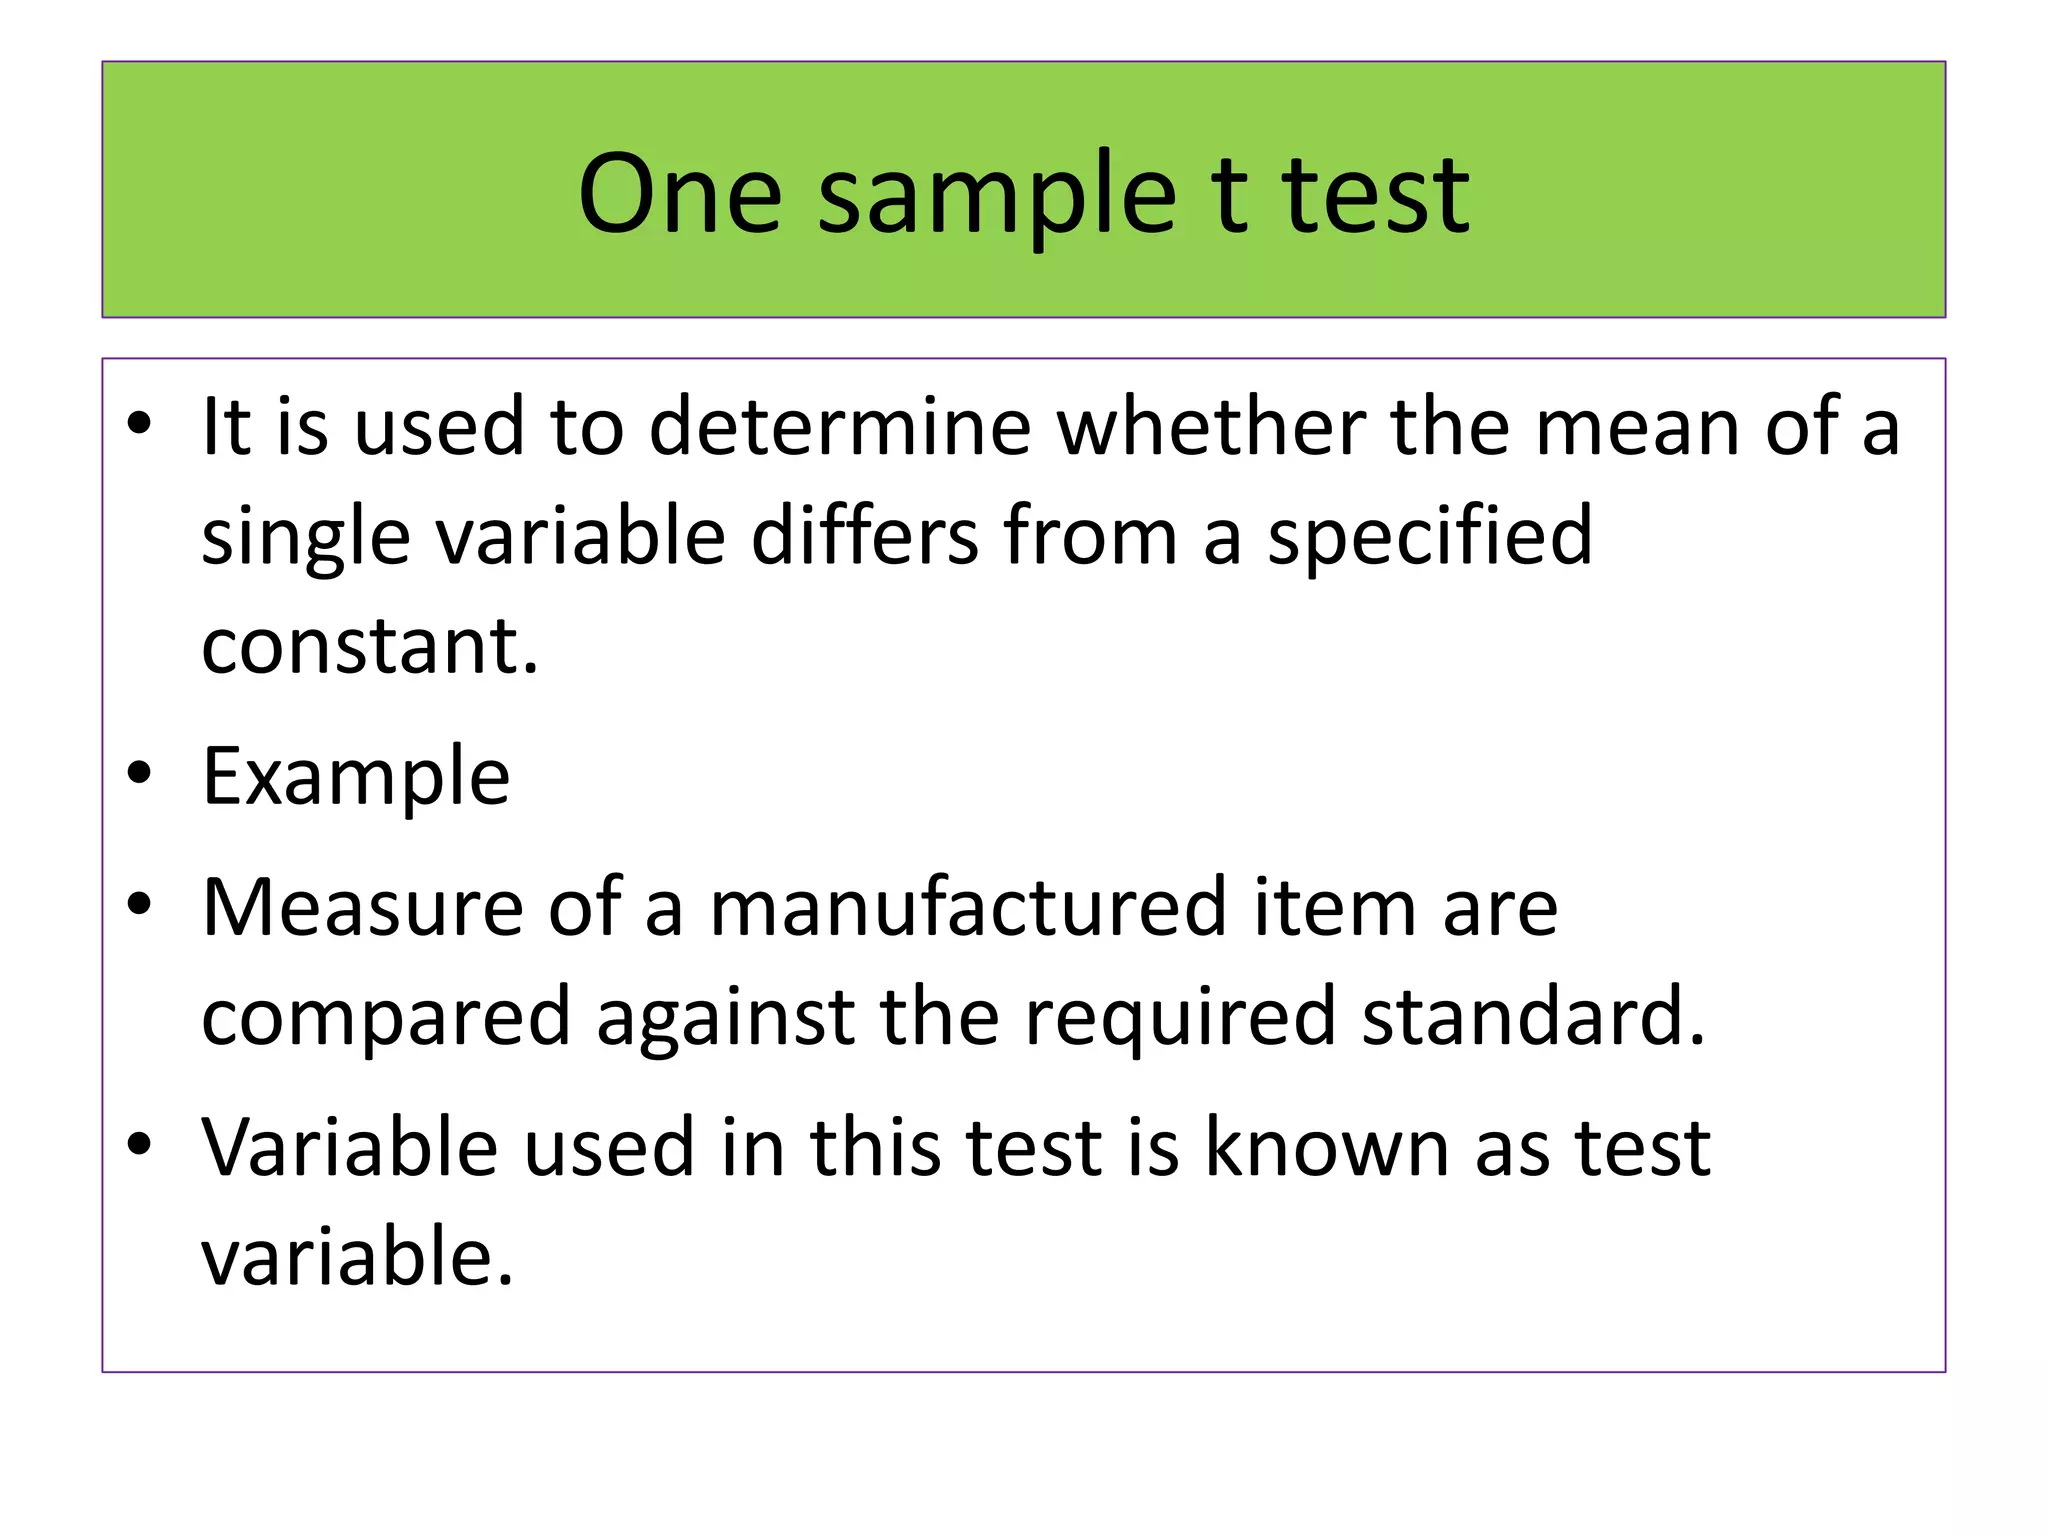
This document provides an overview of parametric statistical tests, including the z-test, t-tests, chi-square test, F-test, and Bartlett's test. It discusses the history and development of the Student's t-test, including its creation by William Gosset under the pseudonym "Student." The t-test is used to compare means between two samples or between a sample and a theoretical population. The document outlines the assumptions, calculations, and interpretations of one-sample, unpaired, and paired t-tests.


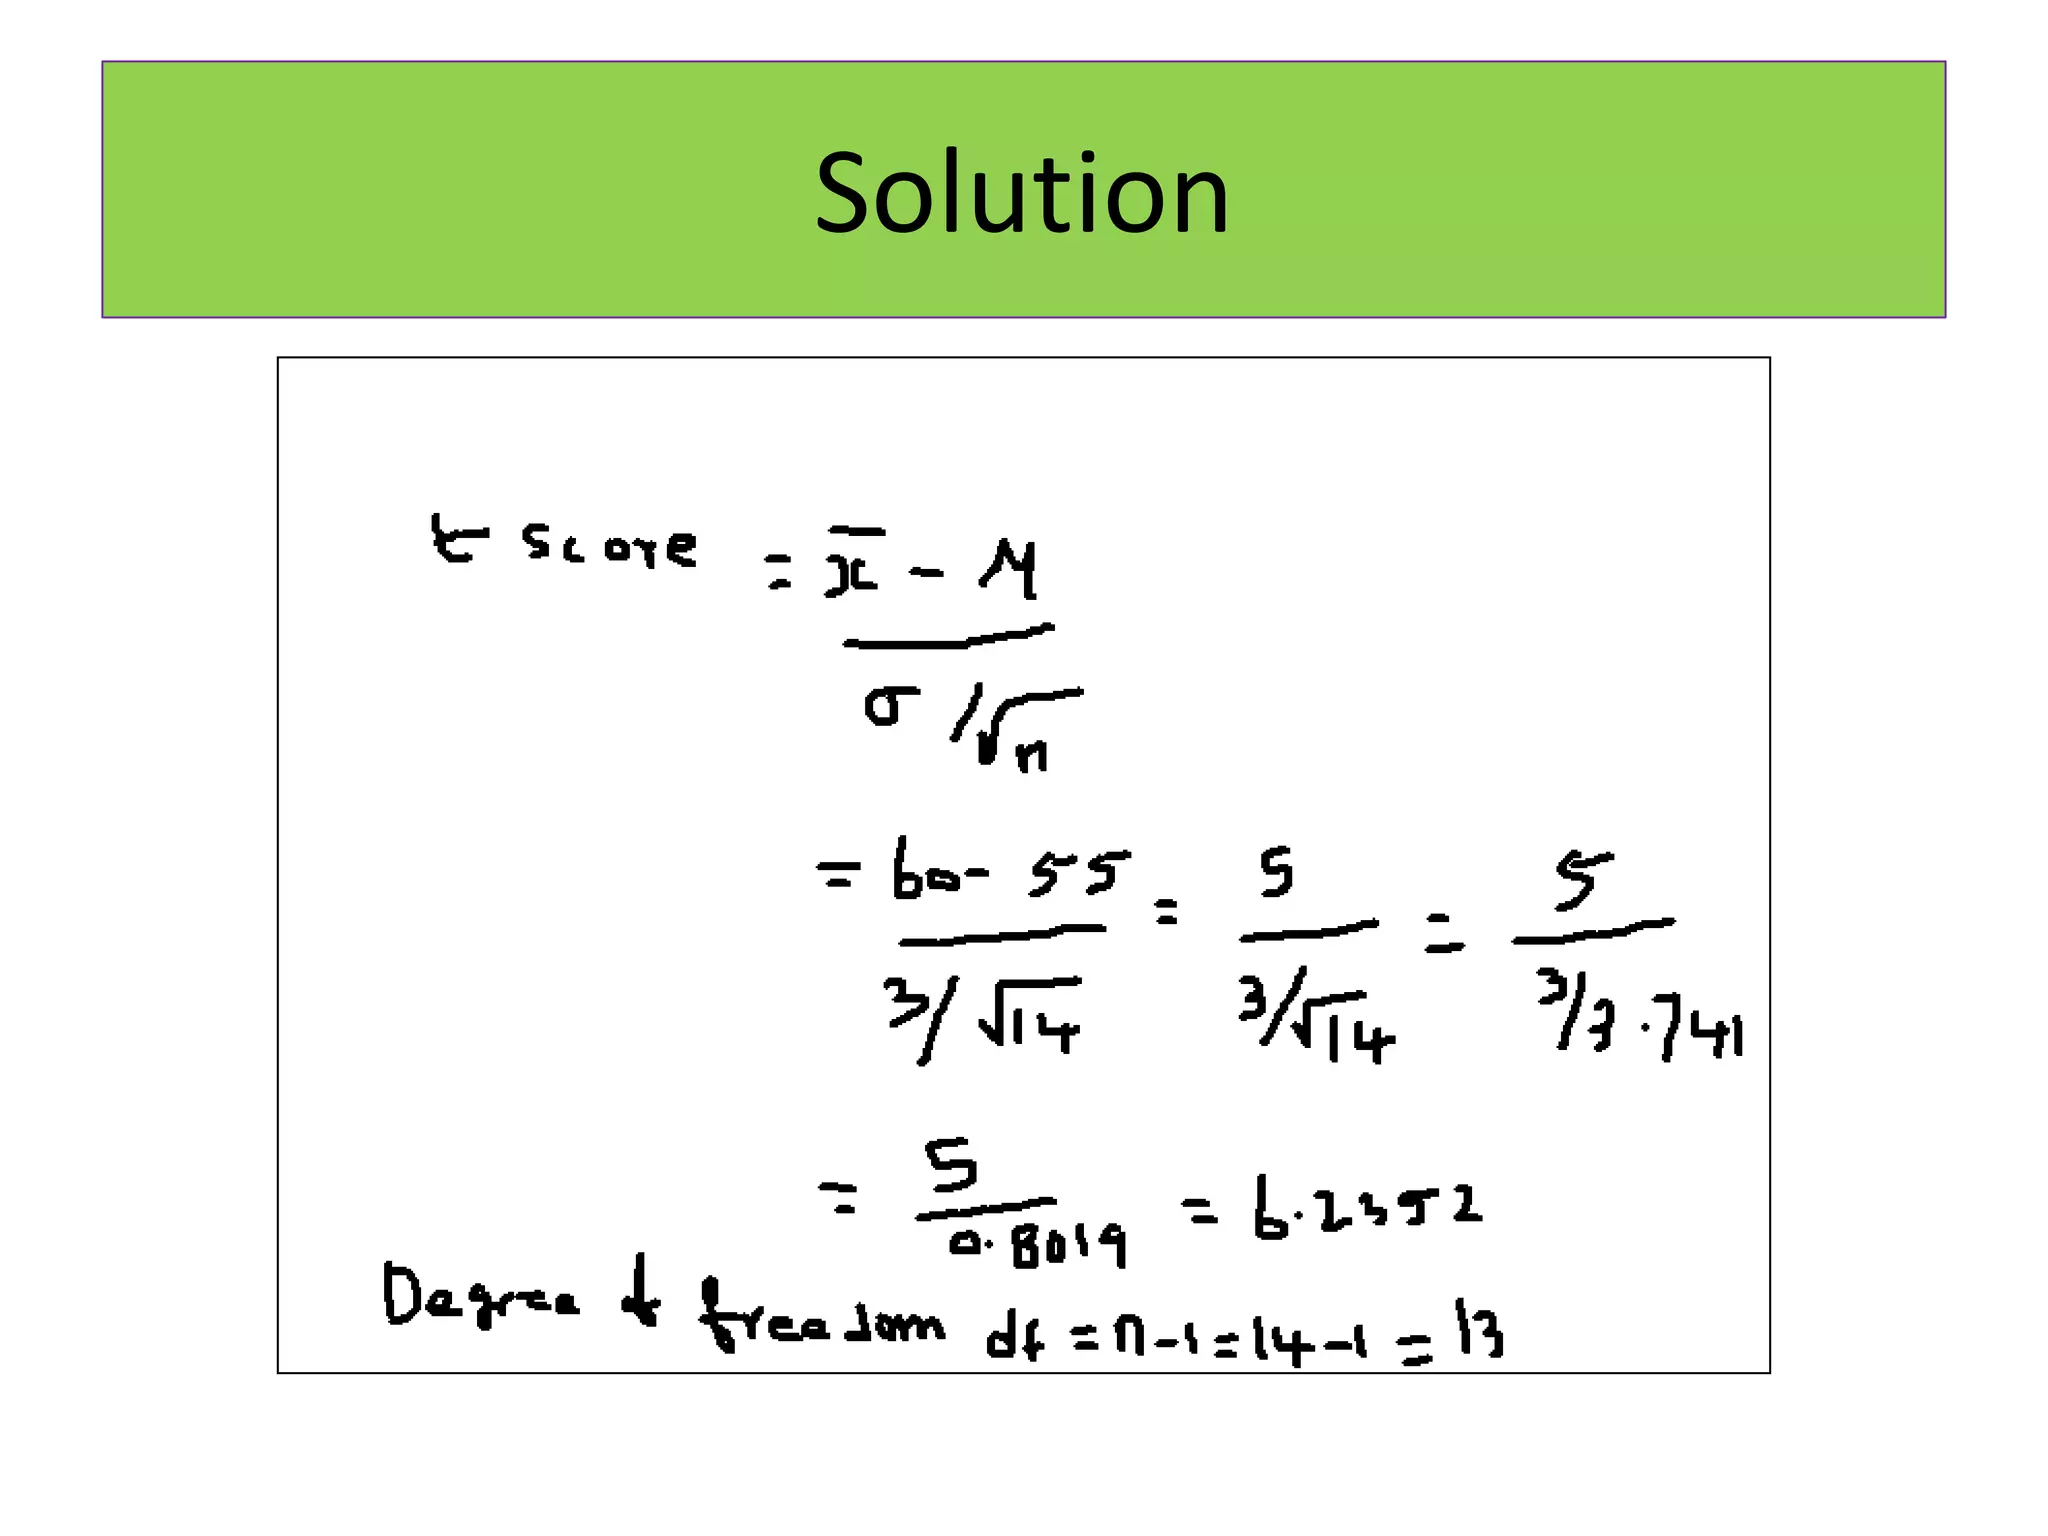
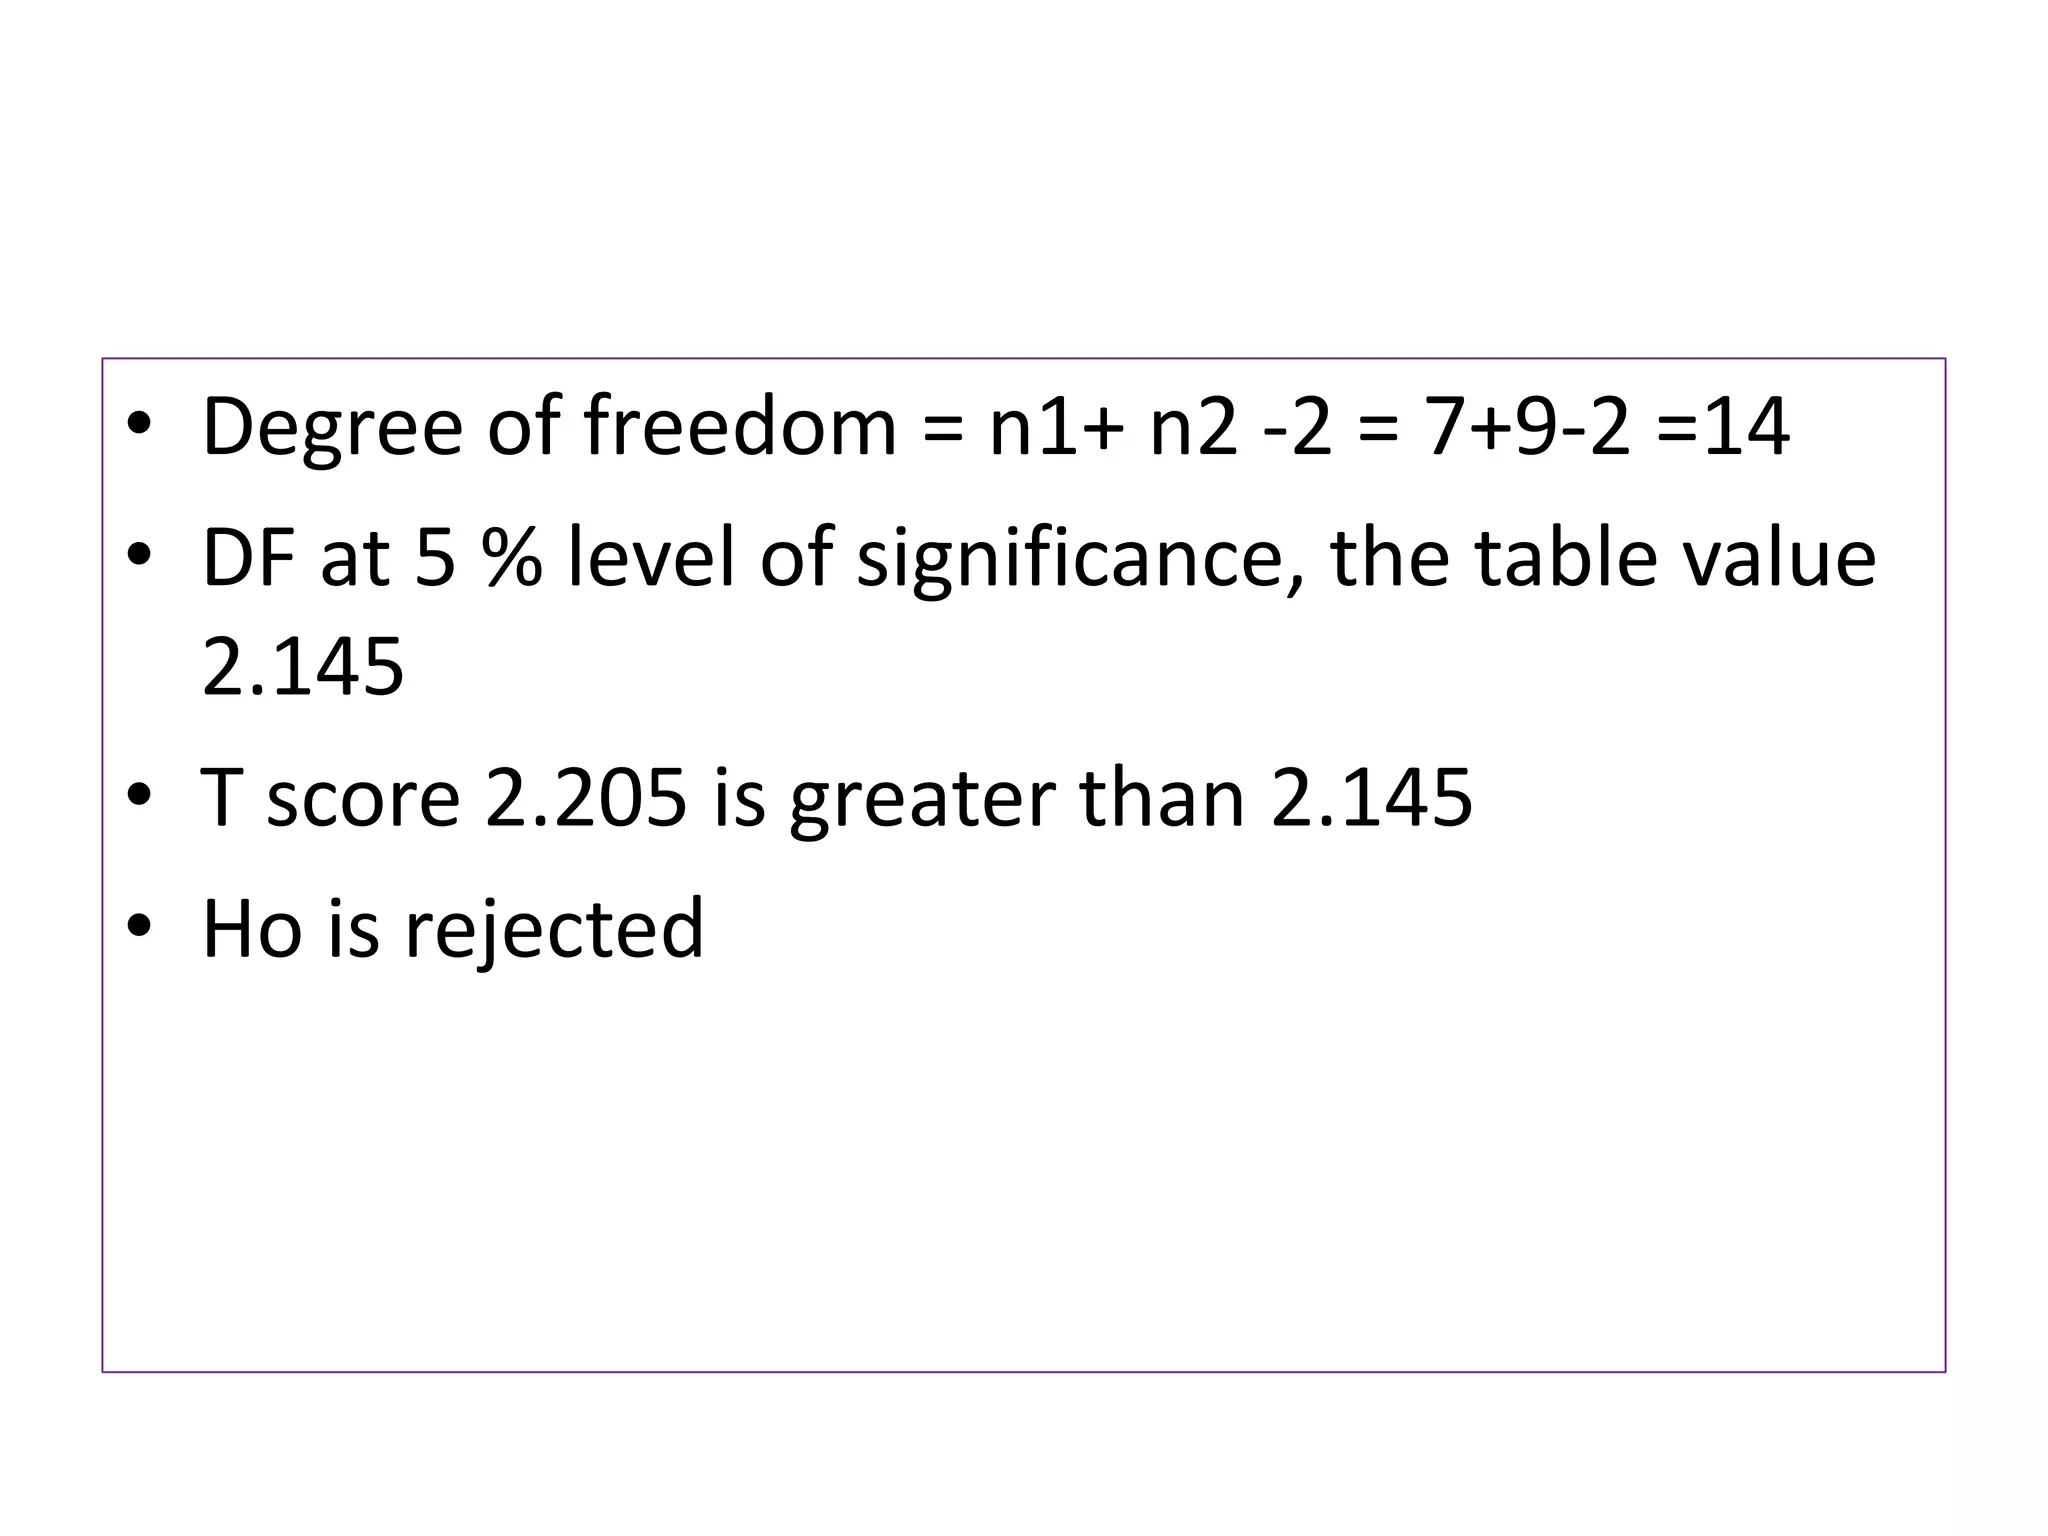
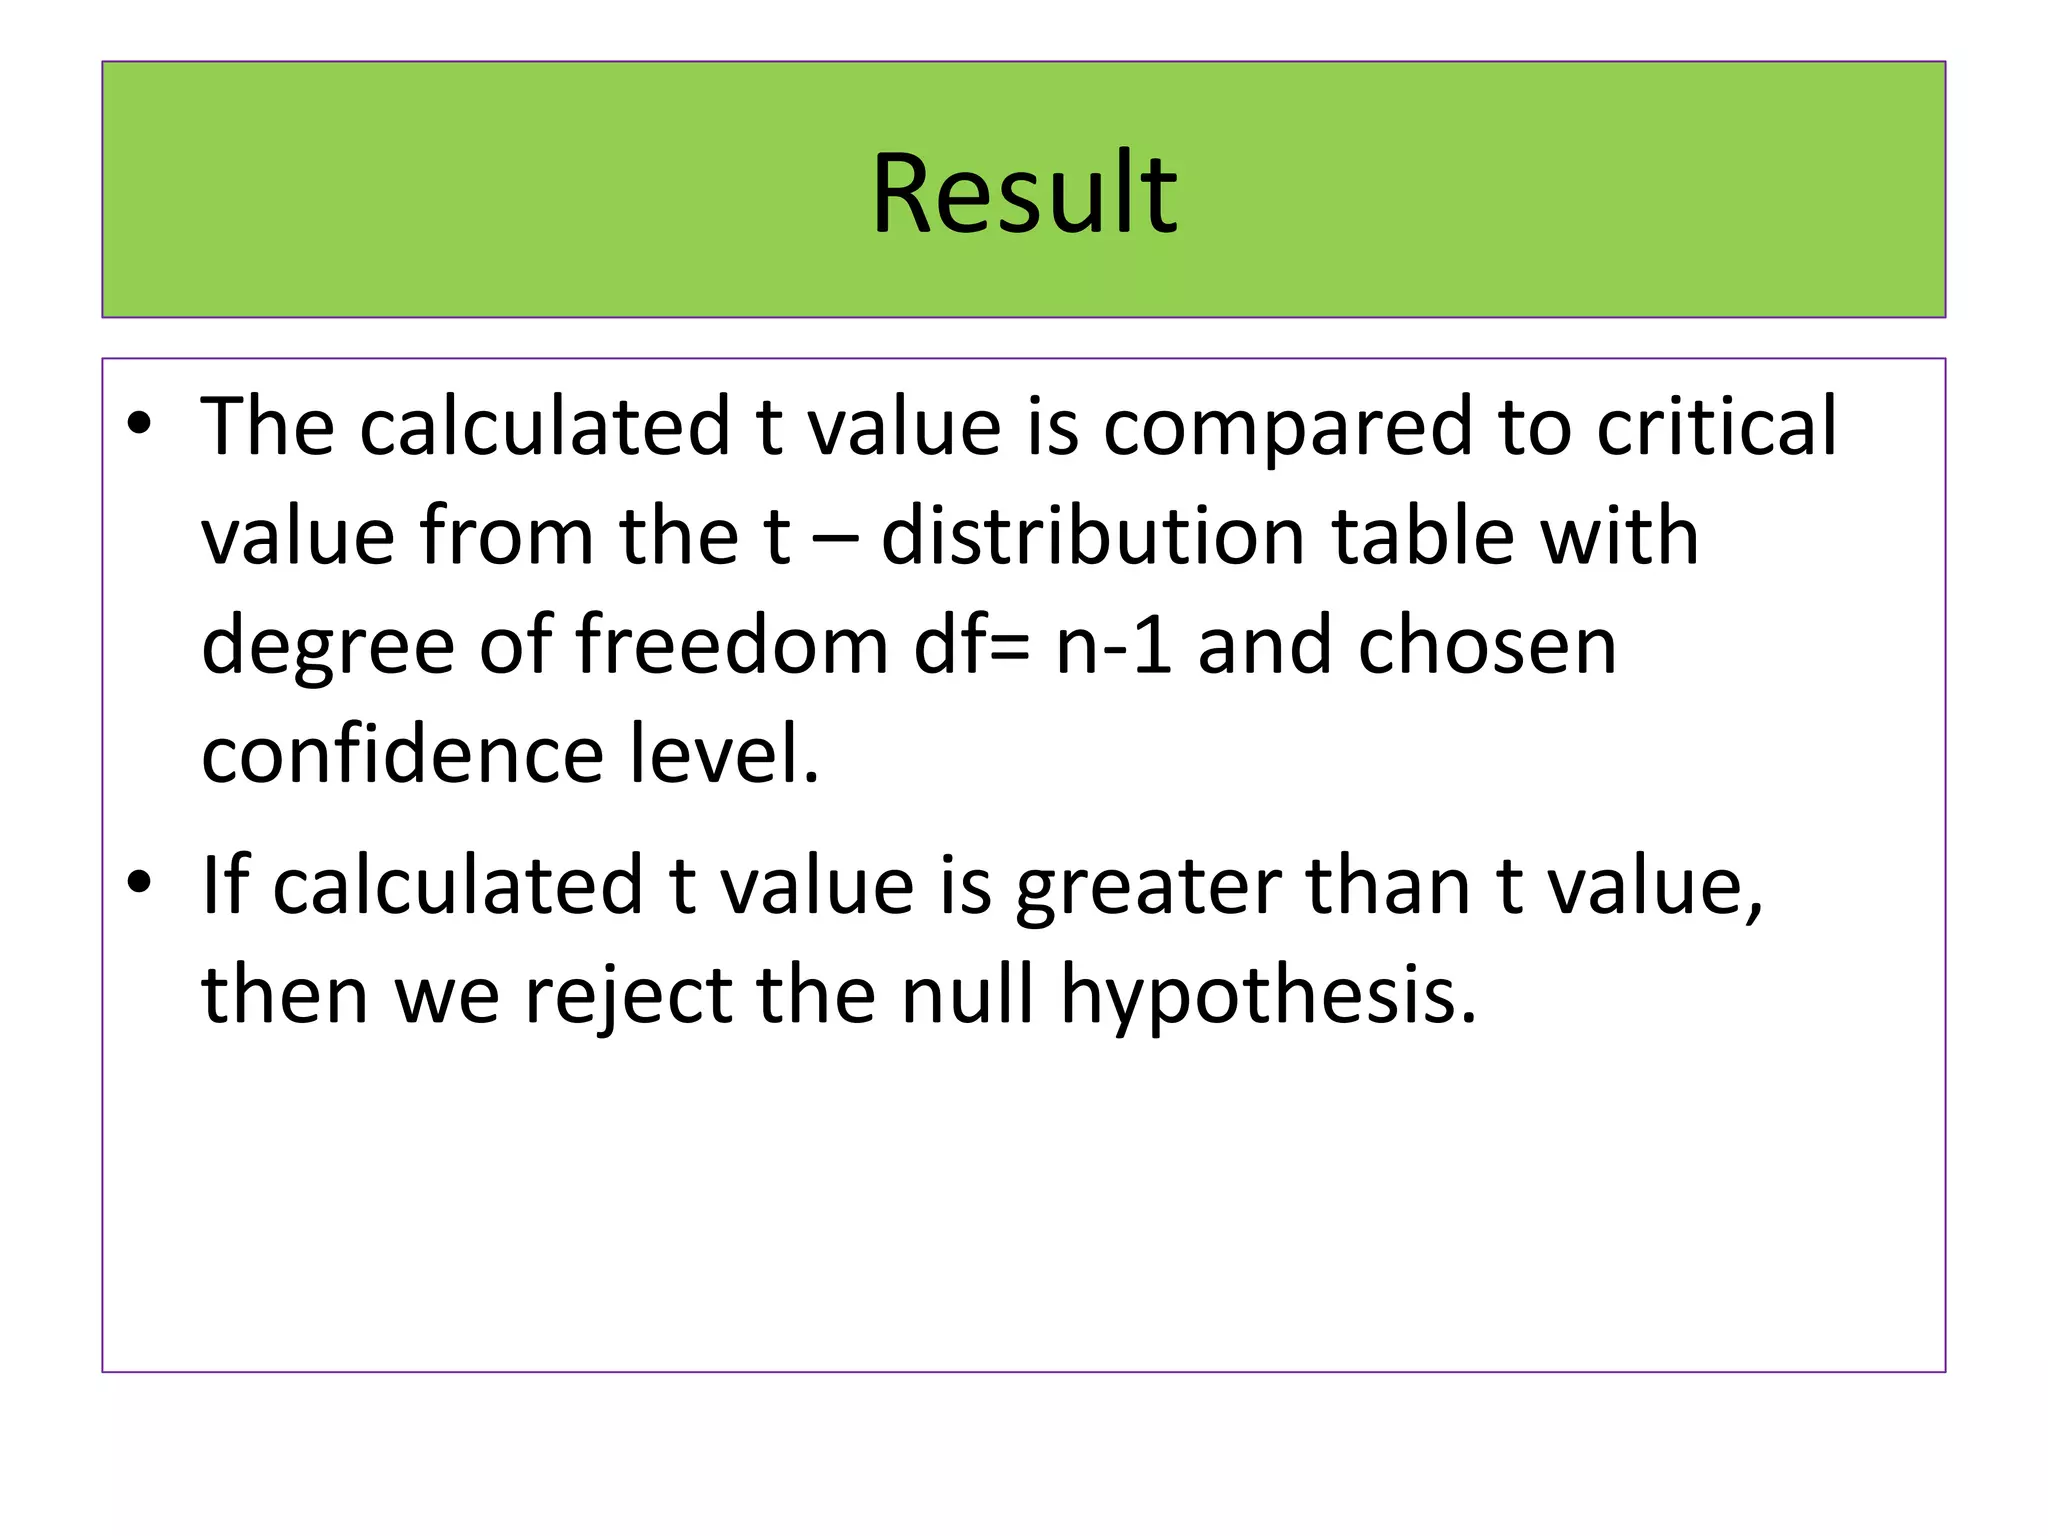
![• For a two tailed test with df 13 at 5 % level of
significance the table value of ‘t’ test = t 0.05
13 = 2.160
• The t score is 6.2352 which is greater than
2.160
• Hence H0 is rejected [null hypothesis]
• The inference is that the sample mean is
significantly differ from the population mean
at 5 % level of significance](https://image.slidesharecdn.com/parametrictest-210419073529/75/Parametric-test-40-2048.jpg)