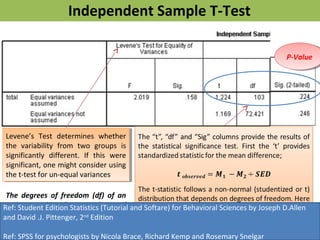
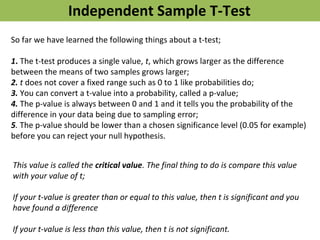
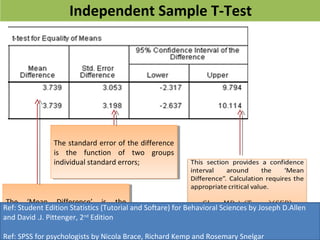
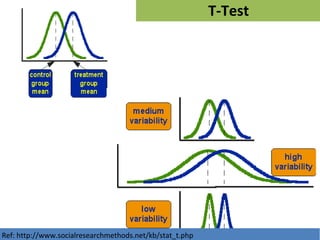
Downloaded 498 times

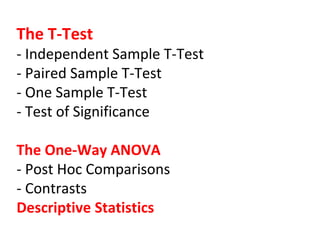
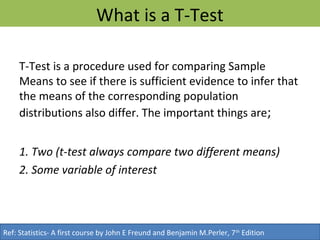
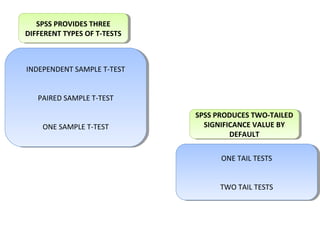
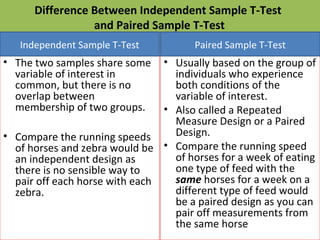
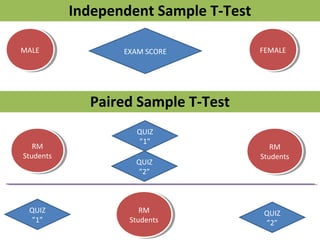
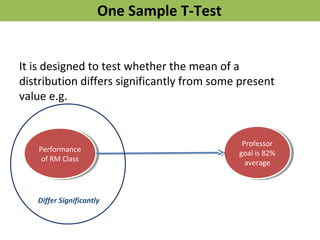
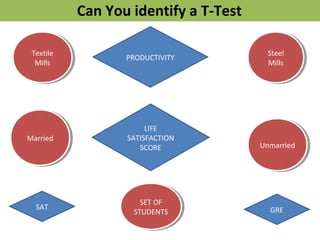
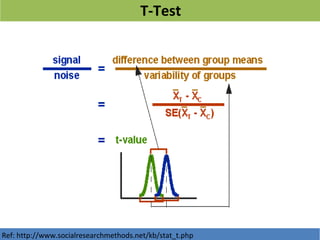
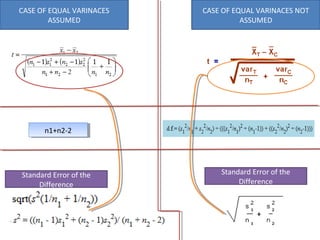
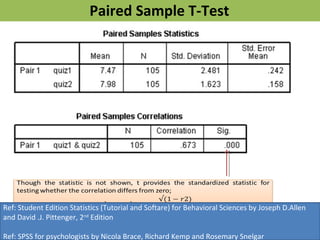
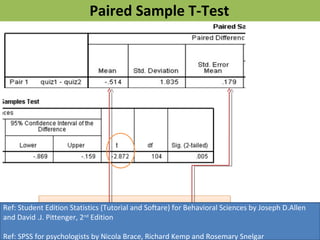
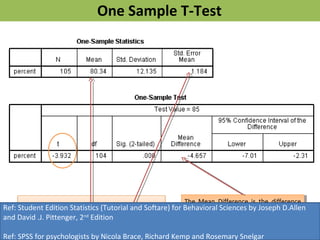
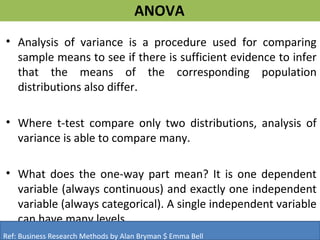
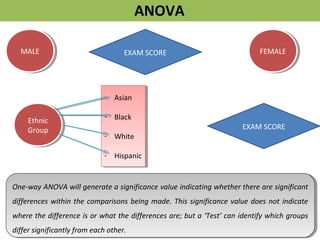
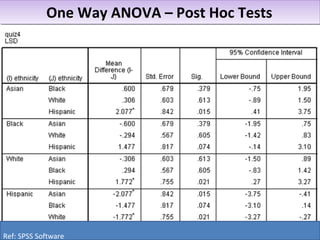

The document provides an overview of t-tests and one-way ANOVA, focusing on their significance in comparing sample means to infer differences in population distributions. It describes different types of t-tests: independent sample, paired sample, and one sample t-tests, along with their appropriate use cases and calculations. Additionally, it explains one-way ANOVA methods for comparing multiple samples, emphasizing the importance of understanding the statistical significance of differences between groups.


![제 23회 보아즈(BOAZ) 빅데이터 컨퍼런스 - [MBOAX] : ABSA를 활용한 소비자 반응 분석 기반 운영 효율화 대시보드 설계](https://cdn.slidesharecdn.com/ss_thumbnails/3-1boaz23rdconferencemboax-260203102709-9d519923-thumbnail.jpg?width=640&height=640&fit=bounds)
![7.__Developing_a_Research_Proposal[1].pptx](https://cdn.slidesharecdn.com/ss_thumbnails/7-260131073037-df92dd7d-thumbnail.jpg?width=640&height=640&fit=bounds)

