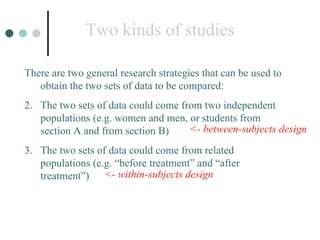
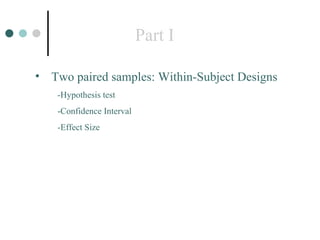
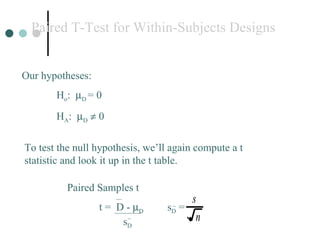
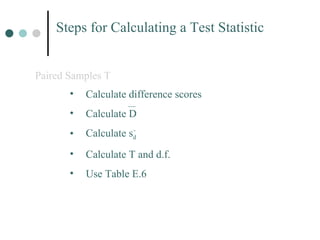
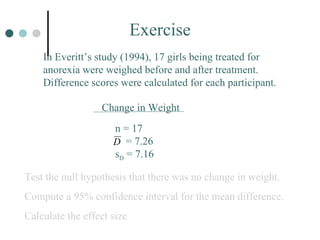
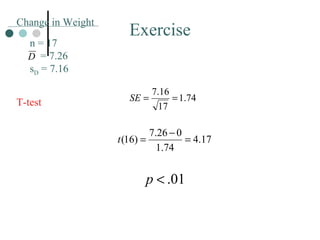
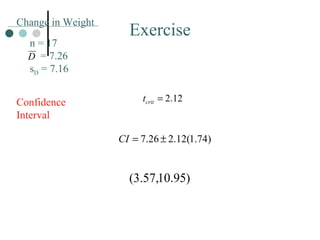
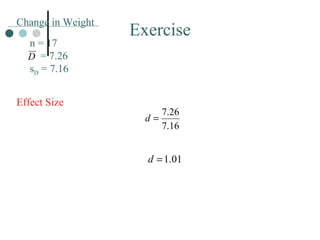
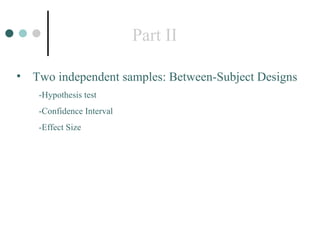
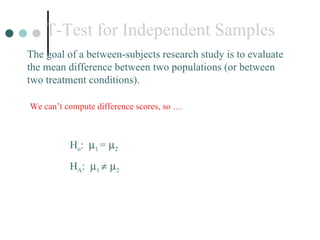
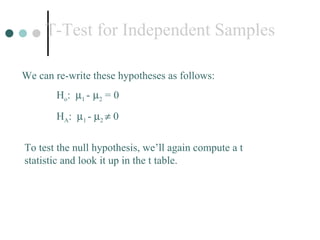
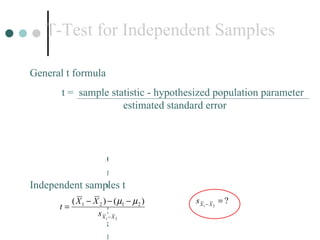
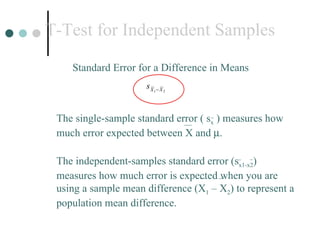
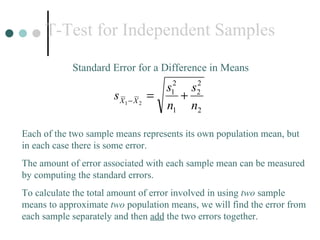
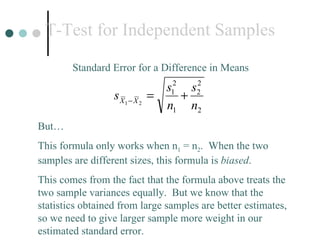
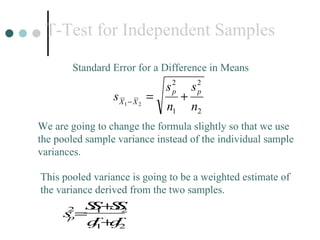
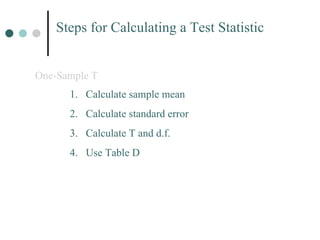
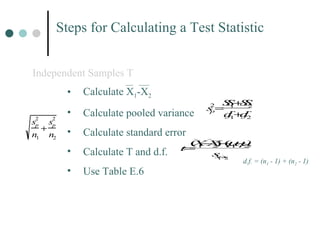
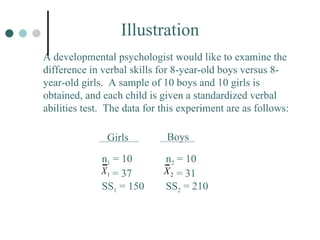
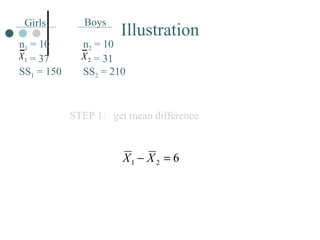
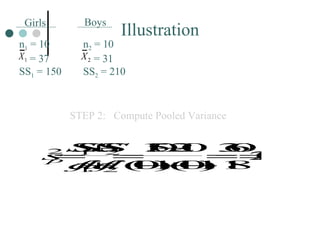
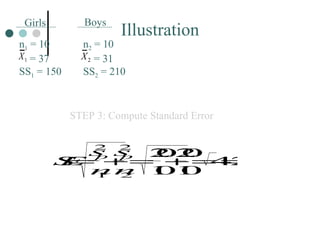
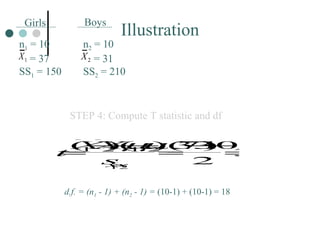
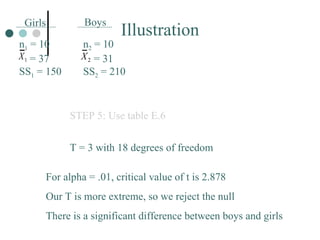
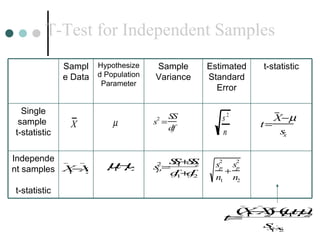
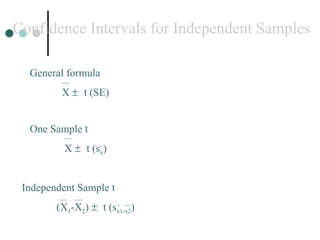
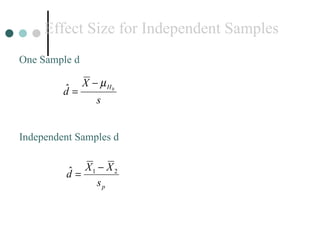
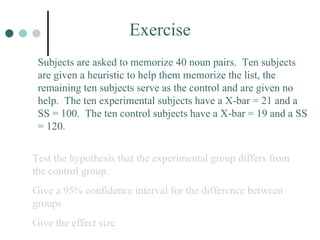
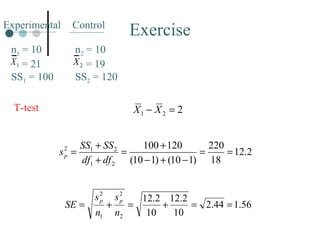
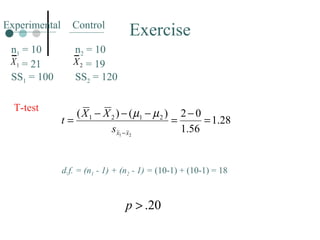
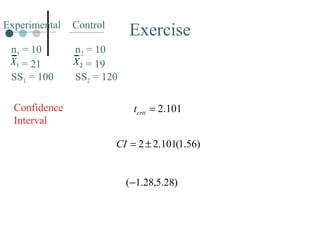
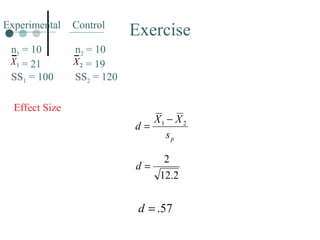
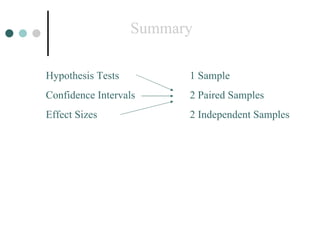
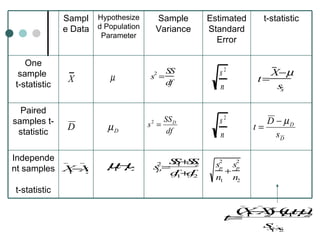
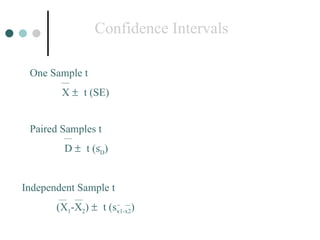
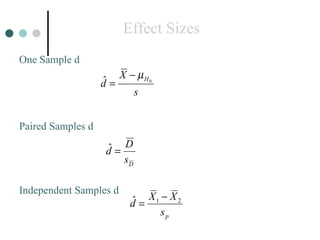
TWO Sample Tests By  Sanket Daptardar
Overview Two paired samples: Within-Subject Designs -Hypothesis test -Confidence Interval -Effect Size Two independent samples: Between-Subject Designs Hypothesis test Confidence interval Effect Size
Comparing Two Populations Until this point, all the inferential statistics we have considered involve using one sample as the basis for drawing conclusion about one population. Although these single sample techniques are used occasionally in real research, most research studies aim to compare of two (or more) sets of data in order to make inferences about the differences between two (or more) populations. What do we do when our research question concerns a mean difference between two sets of data?
Two kinds of studies There are two general research strategies that can be used to obtain the two sets of data to be compared: The two sets of data could come from two independent populations (e.g. women and men, or students from section A and from section B) The two sets of data could come from related populations (e.g. “before treatment” and “after treatment”) <- between-subjects design <- within-subjects design
Part I Two paired samples: Within-Subject Designs -Hypothesis test -Confidence Interval -Effect Size
Paired T-Test for Within-Subjects Designs Our hypotheses:   H o :   D  = 0   H A :   D     0 To test the null hypothesis, we’ll again compute a t statistic and look it up in the t table. Paired Samples t t =  D -   D   s D  =    s D
Steps for Calculating a Test Statistic Paired Samples T Calculate difference scores Calculate D Calculate s d Calculate T and d.f. Use Table E.6
Confidence Intervals for Paired Samples Paired Samples t   D     t (s D ) General formula X     t (SE)
Effect Size for Dependent Samples Paired Samples d One Sample d
Exercise In Everitt’s study (1994), 17 girls being treated for anorexia were weighed before and after treatment.  Difference scores were calculated for each participant. Test the null hypothesis that there was no change in weight. Compute a 95% confidence interval for the mean difference. Calculate the effect size Change in Weight n = 17   = 7.26 s D  = 7.16
Exercise T-test Change in Weight n = 17   = 7.26 s D  = 7.16
Exercise Confidence Interval Change in Weight n = 17   = 7.26 s D  = 7.16
Exercise Effect Size Change in Weight n = 17   = 7.26 s D  = 7.16
Part II Two independent samples: Between-Subject Designs -Hypothesis test -Confidence Interval -Effect Size
T-Test for Independent Samples The goal of a between-subjects research study is to evaluate the mean difference between two populations (or between two treatment conditions). H o :   1  =    2 H A :   1      2 We can’t compute difference scores, so …
T-Test for Independent Samples We can re-write these hypotheses as follows:   H o :   1  -    2  = 0   H A :   1  -   2    0 To test the null hypothesis, we’ll again compute a t statistic and look it up in the t table.
T-Test for Independent Samples General t formula t =  sample statistic - hypothesized population parameter   estimated standard error Independent samples t   One Sample t
T-Test for Independent Samples Standard Error for a Difference in Means The single-sample standard error ( s x  ) measures how much error expected between X and   . The independent-samples standard error (s x1-x2 ) measures how much error is expected when you are using a sample mean difference (X 1  – X 2 ) to represent a population mean difference.
T-Test for Independent Samples Standard Error for a Difference in Means Each of the two sample means represents its own population mean, but in each case there is some error.  The amount of error associated with each sample mean can be measured by computing the standard errors. To calculate the total amount of error involved in using  two  sample means to approximate  two  population means, we will find the error from each sample separately and then  add  the two errors together.
T-Test for Independent Samples Standard Error for a Difference in Means But… This formula only works when n 1  = n 2 .  When the two samples are different sizes, this formula is  biased .  This comes from the fact that the formula above treats the two sample variances equally.  But we know that the statistics obtained from large samples are better estimates, so we need to give larger sample more weight in our  estimated standard error.
T-Test for Independent Samples Standard Error for a Difference in Means We are going to change the formula slightly so that we use the pooled sample variance instead of the individual sample variances. This pooled variance is going to be a weighted estimate of the variance derived from the two samples.
Steps for Calculating a Test Statistic One-Sample T Calculate sample mean Calculate standard error Calculate T and d.f. Use Table D
Steps for Calculating a Test Statistic Independent Samples T Calculate X 1 -X 2 Calculate pooled variance Calculate standard error Calculate T and d.f. Use Table E.6 d.f. = (n 1  - 1) + (n 2  - 1)
Illustration A developmental psychologist would like to examine the difference in verbal skills for 8-year-old boys versus 8-year-old girls.  A sample of 10 boys and 10 girls is obtained, and each child is given a standardized verbal abilities test.  The data for this experiment are as follows: Girls Boys n 1  = 10   = 37 SS 1  = 150 n 2  = 10   = 31 SS 2  = 210
STEP 1:  get mean difference Illustration Girls Boys n 1  = 10   = 37 SS 1  = 150 n 2  = 10   = 31 SS 2  = 210
STEP 2:  Compute Pooled Variance Illustration Girls Boys n 1  = 10   = 37 SS 1  = 150 n 2  = 10   = 31 SS 2  = 210
STEP 3: Compute Standard Error Illustration Girls Boys n 1  = 10   = 37 SS 1  = 150 n 2  = 10   = 31 SS 2  = 210
STEP 4: Compute T statistic and df d.f. = (n 1  - 1) + (n 2  - 1) =  (10-1) + (10-1) = 18 Illustration Girls Boys n 1  = 10   = 37 SS 1  = 150 n 2  = 10   = 31 SS 2  = 210
STEP 5: Use table E.6 T = 3 with 18 degrees of freedom For alpha = .01, critical value of t is 2.878 Our T is more extreme, so we reject the null There is a significant difference between boys and girls Illustration Girls Boys n 1  = 10   = 37 SS 1  = 150 n 2  = 10   = 31 SS 2  = 210
T-Test for Independent Samples t-statistic Independent samples  t-statistic Single sample  t-statistic Estimated Standard Error Sample Variance Hypothesized Population Parameter Sample Data
Confidence Intervals for Independent Samples One Sample t   X     t (s x ) General formula X     t (SE) Independent Sample t   (X 1 -X 2 )     t (s x1-x2 )
Effect Size for Independent Samples One Sample d Independent Samples d
Exercise Subjects are asked to memorize 40 noun pairs.  Ten subjects are given a heuristic to help them memorize the list, the remaining ten subjects serve as the control and are given no help.  The ten experimental subjects have a X-bar = 21 and a SS = 100.  The ten control subjects have a X-bar = 19 and a SS = 120.  Test the hypothesis that the experimental group differs from the control group. Give a 95% confidence interval for the difference between groups Give the effect size
Exercise T-test Experimental Control n 1  = 10   = 21 SS 1  = 100 n 2  = 10   = 19 SS 2  = 120
Exercise d.f. = (n 1  - 1) + (n 2  - 1) =  (10-1) + (10-1) = 18 T-test Experimental Control n 1  = 10   = 21 SS 1  = 100 n 2  = 10   = 19 SS 2  = 120
Exercise Confidence Interval Experimental Control n 1  = 10   = 21 SS 1  = 100 n 2  = 10   = 19 SS 2  = 120
Exercise Effect Size Experimental Control n 1  = 10   = 21 SS 1  = 100 n 2  = 10   = 19 SS 2  = 120
Summary Hypothesis Tests Confidence Intervals Effect Sizes 1 Sample 2 Paired Samples 2 Independent Samples
Review
Independent samples  t-statistic t-statistic Paired samples t-statistic One sample  t-statistic Estimated Standard Error Sample Variance Hypothesized Population Parameter Sample Data
Confidence Intervals Paired Samples t   D     t (s D ) One Sample t X     t (SE) Independent Sample t   (X 1 -X 2 )     t (s x1-x2 )
Effect Sizes Paired Samples d One Sample d Independent Samples d

Two Sample Tests

  • 1.
    TWO Sample TestsBy Sanket Daptardar
  • 2.
    Overview Two pairedsamples: Within-Subject Designs -Hypothesis test -Confidence Interval -Effect Size Two independent samples: Between-Subject Designs Hypothesis test Confidence interval Effect Size
  • 3.
    Comparing Two PopulationsUntil this point, all the inferential statistics we have considered involve using one sample as the basis for drawing conclusion about one population. Although these single sample techniques are used occasionally in real research, most research studies aim to compare of two (or more) sets of data in order to make inferences about the differences between two (or more) populations. What do we do when our research question concerns a mean difference between two sets of data?
  • 4.
    Two kinds ofstudies There are two general research strategies that can be used to obtain the two sets of data to be compared: The two sets of data could come from two independent populations (e.g. women and men, or students from section A and from section B) The two sets of data could come from related populations (e.g. “before treatment” and “after treatment”) <- between-subjects design <- within-subjects design
  • 5.
    Part I Twopaired samples: Within-Subject Designs -Hypothesis test -Confidence Interval -Effect Size
  • 6.
    Paired T-Test forWithin-Subjects Designs Our hypotheses: H o :  D = 0 H A :  D  0 To test the null hypothesis, we’ll again compute a t statistic and look it up in the t table. Paired Samples t t = D -  D s D = s D
  • 7.
    Steps for Calculatinga Test Statistic Paired Samples T Calculate difference scores Calculate D Calculate s d Calculate T and d.f. Use Table E.6
  • 8.
    Confidence Intervals forPaired Samples Paired Samples t D  t (s D ) General formula X  t (SE)
  • 9.
    Effect Size forDependent Samples Paired Samples d One Sample d
  • 10.
    Exercise In Everitt’sstudy (1994), 17 girls being treated for anorexia were weighed before and after treatment. Difference scores were calculated for each participant. Test the null hypothesis that there was no change in weight. Compute a 95% confidence interval for the mean difference. Calculate the effect size Change in Weight n = 17 = 7.26 s D = 7.16
  • 11.
    Exercise T-test Changein Weight n = 17 = 7.26 s D = 7.16
  • 12.
    Exercise Confidence IntervalChange in Weight n = 17 = 7.26 s D = 7.16
  • 13.
    Exercise Effect SizeChange in Weight n = 17 = 7.26 s D = 7.16
  • 14.
    Part II Twoindependent samples: Between-Subject Designs -Hypothesis test -Confidence Interval -Effect Size
  • 15.
    T-Test for IndependentSamples The goal of a between-subjects research study is to evaluate the mean difference between two populations (or between two treatment conditions). H o :  1 =  2 H A :  1   2 We can’t compute difference scores, so …
  • 16.
    T-Test for IndependentSamples We can re-write these hypotheses as follows: H o :  1 -  2 = 0 H A :  1 -  2  0 To test the null hypothesis, we’ll again compute a t statistic and look it up in the t table.
  • 17.
    T-Test for IndependentSamples General t formula t = sample statistic - hypothesized population parameter estimated standard error Independent samples t One Sample t
  • 18.
    T-Test for IndependentSamples Standard Error for a Difference in Means The single-sample standard error ( s x ) measures how much error expected between X and  . The independent-samples standard error (s x1-x2 ) measures how much error is expected when you are using a sample mean difference (X 1 – X 2 ) to represent a population mean difference.
  • 19.
    T-Test for IndependentSamples Standard Error for a Difference in Means Each of the two sample means represents its own population mean, but in each case there is some error. The amount of error associated with each sample mean can be measured by computing the standard errors. To calculate the total amount of error involved in using two sample means to approximate two population means, we will find the error from each sample separately and then add the two errors together.
  • 20.
    T-Test for IndependentSamples Standard Error for a Difference in Means But… This formula only works when n 1 = n 2 . When the two samples are different sizes, this formula is biased . This comes from the fact that the formula above treats the two sample variances equally. But we know that the statistics obtained from large samples are better estimates, so we need to give larger sample more weight in our estimated standard error.
  • 21.
    T-Test for IndependentSamples Standard Error for a Difference in Means We are going to change the formula slightly so that we use the pooled sample variance instead of the individual sample variances. This pooled variance is going to be a weighted estimate of the variance derived from the two samples.
  • 22.
    Steps for Calculatinga Test Statistic One-Sample T Calculate sample mean Calculate standard error Calculate T and d.f. Use Table D
  • 23.
    Steps for Calculatinga Test Statistic Independent Samples T Calculate X 1 -X 2 Calculate pooled variance Calculate standard error Calculate T and d.f. Use Table E.6 d.f. = (n 1 - 1) + (n 2 - 1)
  • 24.
    Illustration A developmentalpsychologist would like to examine the difference in verbal skills for 8-year-old boys versus 8-year-old girls. A sample of 10 boys and 10 girls is obtained, and each child is given a standardized verbal abilities test. The data for this experiment are as follows: Girls Boys n 1 = 10 = 37 SS 1 = 150 n 2 = 10 = 31 SS 2 = 210
  • 25.
    STEP 1: get mean difference Illustration Girls Boys n 1 = 10 = 37 SS 1 = 150 n 2 = 10 = 31 SS 2 = 210
  • 26.
    STEP 2: Compute Pooled Variance Illustration Girls Boys n 1 = 10 = 37 SS 1 = 150 n 2 = 10 = 31 SS 2 = 210
  • 27.
    STEP 3: ComputeStandard Error Illustration Girls Boys n 1 = 10 = 37 SS 1 = 150 n 2 = 10 = 31 SS 2 = 210
  • 28.
    STEP 4: ComputeT statistic and df d.f. = (n 1 - 1) + (n 2 - 1) = (10-1) + (10-1) = 18 Illustration Girls Boys n 1 = 10 = 37 SS 1 = 150 n 2 = 10 = 31 SS 2 = 210
  • 29.
    STEP 5: Usetable E.6 T = 3 with 18 degrees of freedom For alpha = .01, critical value of t is 2.878 Our T is more extreme, so we reject the null There is a significant difference between boys and girls Illustration Girls Boys n 1 = 10 = 37 SS 1 = 150 n 2 = 10 = 31 SS 2 = 210
  • 30.
    T-Test for IndependentSamples t-statistic Independent samples t-statistic Single sample t-statistic Estimated Standard Error Sample Variance Hypothesized Population Parameter Sample Data
  • 31.
    Confidence Intervals forIndependent Samples One Sample t X  t (s x ) General formula X  t (SE) Independent Sample t (X 1 -X 2 )  t (s x1-x2 )
  • 32.
    Effect Size forIndependent Samples One Sample d Independent Samples d
  • 33.
    Exercise Subjects areasked to memorize 40 noun pairs. Ten subjects are given a heuristic to help them memorize the list, the remaining ten subjects serve as the control and are given no help. The ten experimental subjects have a X-bar = 21 and a SS = 100. The ten control subjects have a X-bar = 19 and a SS = 120. Test the hypothesis that the experimental group differs from the control group. Give a 95% confidence interval for the difference between groups Give the effect size
  • 34.
    Exercise T-test ExperimentalControl n 1 = 10 = 21 SS 1 = 100 n 2 = 10 = 19 SS 2 = 120
  • 35.
    Exercise d.f. =(n 1 - 1) + (n 2 - 1) = (10-1) + (10-1) = 18 T-test Experimental Control n 1 = 10 = 21 SS 1 = 100 n 2 = 10 = 19 SS 2 = 120
  • 36.
    Exercise Confidence IntervalExperimental Control n 1 = 10 = 21 SS 1 = 100 n 2 = 10 = 19 SS 2 = 120
  • 37.
    Exercise Effect SizeExperimental Control n 1 = 10 = 21 SS 1 = 100 n 2 = 10 = 19 SS 2 = 120
  • 38.
    Summary Hypothesis TestsConfidence Intervals Effect Sizes 1 Sample 2 Paired Samples 2 Independent Samples
  • 39.
  • 40.
    Independent samples t-statistic t-statistic Paired samples t-statistic One sample t-statistic Estimated Standard Error Sample Variance Hypothesized Population Parameter Sample Data
  • 41.
    Confidence Intervals PairedSamples t D  t (s D ) One Sample t X  t (SE) Independent Sample t (X 1 -X 2 )  t (s x1-x2 )
  • 42.
    Effect Sizes PairedSamples d One Sample d Independent Samples d